

Abstract
High mobility group B (HMGB) proteins contain two HMG box domains known to bind without sequence specificity into the DNA minor groove, slightly intercalating between basepairs and producing a strong bend in the DNA backbone. We use optical tweezers to measure the forces required to stretch single DNA molecules. Parameters describing DNA flexibility, including contour length and persistence length, are revealed. In the presence of nanomolar concentrations of isolated HMG box A from HMGB2, DNA shows a decrease in its persistence length, where the protein induces an average DNA bend angle of 114 ± 21° for 50 mM Na+, and 87 ± 9° for 100 mM Na+. The DNA contour length increases from 0.341 ± 0.003 to 0.397 ± 0.012 nm per basepair, independent of salt concentration. In 50 mM Na+, the protein does not unbind even at high DNA extension, whereas in 100 mM Na+, the protein appears to unbind only below concentrations of 2 nM. These observations support a flexible hinge model for noncooperative HMG binding at low protein concentrations. However, at higher protein concentrations, a cooperative filament mode is observed instead of the hinge binding. This mode may be uniquely characterized by this high-force optical tweezers experiment.
INTRODUCTION
Though the high mobility group (HMG) proteins were discovered in the 1970s, their function remained unclear for decades. Their name refers simply to their electrophoretic character in SDS-PAGE analysis. HMG proteins are abundant in eukaryotes, a typical cell containing 106 HMG proteins (1). Gradually it became clear that these nuclear proteins contain motifs that are associated with chromatin, though HMG proteins appear outside of the nucleus as well (2–4). Finally it was determined that these proteins change the conformation of DNA upon binding, but through a mechanism distinct from the more numerous histones (1,4,5).
HMG proteins are divided into several major classes that are characterized by protein structure and their degree of DNA sequence specificity; for example, those containing an AT hook, one or more HMG boxes, or particular nucleosome binding properties (2,6,7). The HMGB protein studied in this work is an isolated domain known as HMG box A (∼80 residues) derived from human HMGB2. The structure of an HMG box is shown in Fig. 1 a (8). The domain is composed of three helices and a tail, and is stabilized by hydrophobic interactions between neighboring residues. The N-terminal tail is highly variable and may or may not interact with DNA depending on the particular HMGB protein studied (1,9). In the case of yeast NHP6Ap, the N-terminal tail is highly basic and lies in the compressed major groove of the complex (10). The remaining two helices are known to bind against the minor groove, with hydrophobic side chains from amino acids at one or both of two specific positions intercalating between basepairs, untwisting the duplex, and producing a strong bend in the backbone toward the major groove, as shown in the HMGB domain of Fig. 1 b (8,9,11–13). The angle of this bend has been reported over a wide range from 30 to 130°, though values between 70 and 90° are typical for a domain with a single HMG box (11,14–17). The propensity of HMG proteins to bend DNA implies their affinity for unusual structures containing bent DNA, such as cruciforms (18) and chemically cross-linked DNA (19). It has been reported that the box A domain of HMGB2 studied here is actually a relatively weak DNA bending protein compared to box B or to intact HMGB proteins containing two consecutive HMG boxes (12). DNA bending potential is thought to reflect, in part, the pattern of intercalating hydrophobic residues along the α-helices that interacts with DNA.
FIGURE 1.
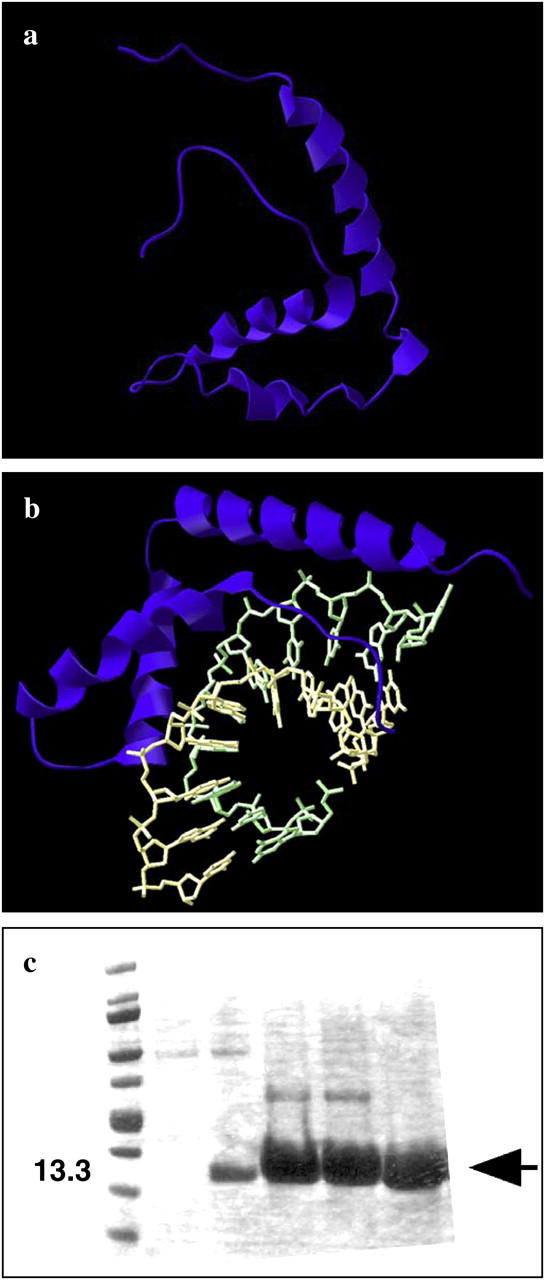
(a) The HMG box that characterizes the HMGB family, from Rattus norvegicus, as studied by NMR spectroscopy. Of the helical domains, only the shorter regions are believed to bind to DNA. The functions of the longer helix and the long tail are not clear, though they may serve to stabilize charges in the binding region. (b) The orientation of the HMG box (purple) as it binds to dsDNA (green and yellow) in this crystal structure involving protein from Drosophila melanogaster. Binding generates a strong bend in the DNA backbone, significantly affecting base stacking. Specific protein residues (not shown) further alter the DNA structure by intercalating between the basepairs. Both images were generated using Swiss View/DeepView v3.7 software and coordinates from the National Center for Biotechnology Information Protein Data Bank. (c) Example of typical denaturing SDS polyacryamide gel analysis of human recombinant HMGB2 box A protein as eluted in fractions from a nickel chelate column. (First lane) Molecular weight standards. (Arrow) Pure HMGB2 recombinant protein used for single-molecule studies.
The function of HMGB proteins in living cells remains unknown, though clues exist (13,20,21). In a biological context, these proteins are seen as facilitating the binding of other transcription factors (22,23) presumably by forming direct contacts with these proteins, at least transiently (24). Yeast strains lacking the two prominent HMGB proteins NH6PA/B are viable, but show interesting patterns of altered gene expression and inducibility (22,25) and fail to transcribe the U6 snRNA gene at elevated temperature (26). Studies of this latter defect suggest that NHP6 proteins stabilize the binding of TFIIIC to the U6 promoter (26). This observation is consistent with the notion that HMG proteins influence transcription factor binding either directly (27) or by altering the propensity for DNA looping (28). Likewise, mice lacking the HMGB1 protein survive (presumably due to redundant properties of other HMGB proteins) but suffer defects in glucose metabolism suggesting a subtle misregulation of gene expression (29).
When mixed with naked DNA, HMGB proteins can substitute for the bacterial HU protein in their ability to facilitate the formation of nucleoprotein complexes requiring small DNA loops (30). When added to naked DNA fragments that are too short and inflexible for cyclization, HMG proteins enhance unimolecular ligation into small circles (30,31). These results suggest that HMG proteins can profoundly alter the apparent flexibility of naked DNA in dilute solutions. The mechanism of this DNA flexibility enhancement by HMG proteins is unknown. One simple model (28,31) is that HMG proteins randomly bind to DNA, introducing transient kinks of random direction into the polymer. This process provides an ensemble of new DNA shapes that are, on average, more compact than molecules in the initial DNA population, though no individual molecule is actually more flexible. Compact shapes that, by chance, favor particular nucleoprotein structures in biological systems are then captured by other proteins and stabilized.
Alternative models for HMGB enhancement of apparent DNA flexibility might be imagined. It is possible that HMGB protein binding introduces an actual locus of enhanced DNA flexibility, such that individual DNA molecules are altered in their intrinsic flexibility by protein binding, as seen in recent experiments on the Escherichia coli HU protein (32). Enhanced flexibility might facilitate the binding of other proteins and DNA looping for transcription activation. In contrast to the previous model, these flexible hinges need not unbind easily. Finally, HMGB proteins may bind cooperatively creating a rigid filament around the dsDNA molecule, as was also seen with HU (32). This work sheds light on these fundamental mechanistic models of DNA flexibility enhancement by sequence nonspecific HMGB proteins.
In the optical tweezers experiments reported here, biotin-labeled DNA is stretched between two streptavidin coated beads. As the force is increased, the structural parameters of the DNA double helix are revealed, including the free energy of the basepair interaction. Such experiments have been performed with DNA in varying concentrations of salt (33–36). Repeating the experiment in the presence of varying concentrations of HMG protein and fitting the force extension curves to polymer elasticity models allows quantitative characterization of the protein-DNA interaction. Experiments performed at high forces capable of denaturing DNA also allow us to examine a separate cooperative binding mode, in which protein-DNA filaments are formed.
MATERIALS AND METHODS
Experiment
The optical tweezers experiment is shown schematically in Fig. 2 a. Two beams, each with ∼200 mW of near-infrared, vertically polarized continuous wave light (JDS Uniphase, San Jose, CA), are convergently directed using high-efficiency polarizing beam-splitting cubes (Melles Griot, Carlsbad, CA). The beams are focused to a diameter of ∼1 μm using 60× water immersion objectives (Nikon, Tokyo, Japan). The focus of each counter propagating beam overlaps in a flow cell, forming the optical trap. As the beams leave the trap, the polarization, now horizontal, allows another beam-splitting cube to direct the light into a lateral effect detector (Melles Griot). These diodes determine any deflection of each beam to within a few microns. The white light sources and the charge-coupled device cameras provide simultaneous images of the tip and the beams.
FIGURE 2.
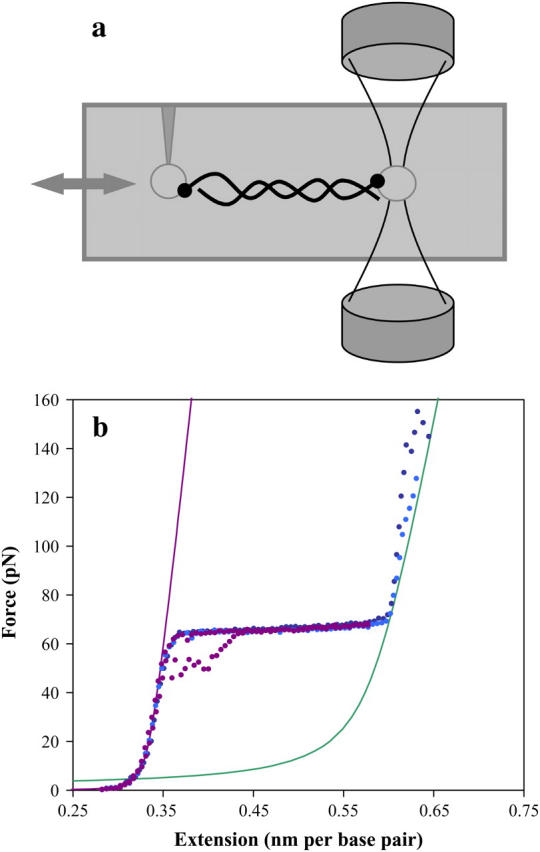
(a) In this optical tweezers diagram, the vertical counter propagating beams are focused on the right. Within the gray flow cell, a streptavidin-coated polystyrene bead (open circle) is held in the trap formed by the beams, while another is attached to the glass micropipette tip on the left. Labeled DNA molecules are stretched by moving the cell and tip relative to the trap. (b) Typical force extension curves for double-stranded DNA are shown as dotted lines. As the stretching force is increased, dsDNA reveals an entropic elastic response, followed by the overstretching region. The data in purple shows typical data for a full cycle of extension and relaxation, including some hysteresis upon reannealing. The data in blue and cyan show the response of the resulting single strands to yet higher forces, as the strands finally separate near 150 pN (thus there are no relaxation curves). The solid lines are DNA models for ssDNA and dsDNA, as described in the text.
A streptavidin-coated polystyrene bead with a diameter of 5 μm (Bangs Labs, Fishers, IN) is held in the trap, while another is attached to a micropipette tip (World Precision Instruments, Sarasota, FL). A solution containing phage-λ DNA (∼48,000 basepairs, biotin labeled on each 3′ terminus), is introduced into the cell allowing DNA attachment between the beads. The DNA solution consists of 10 mM Hepes, pH 7.5, and Na+ ions at either 50 or 100 mM. The micropipette tip, mounted on a piezoelectric stage (Melles Griot), may be moved, causing the DNA to stretch between the two beads. As the force on the DNA increases, the bead in the optical trap is displaced, generating a beam deflection that may be determined on the lateral effect detectors and recorded on custom-built software.
A recombinant plasmid encoding 91 amino acids of HMG box A derived from human HMGB2 was kindly provided by P. Sharp (MIT, Cambridge, MA). The encoded recombinant protein: (MGSSHHHHHHSSGLVPRGSHMLEDPGKGDPNKPRGKMSSYAFFVQTCREEHKKKHPDSSVNFAEFSKKCSERWKTMSAKEKSKFEDMAKSDKARYDREMKNYVPPKGDKKGKKKDP) includes a 25-amino-acid leader segment (italics) containing a hexahistidine tag. Examination of structural data for HMGB/DNA complexes shows that the amino-terminal location of the His6 tag and leader is far from the protein/DNA interface. Furthermore, this His6 leader segment is in a location that is highly variable between different HMGB proteins and not thought to fundamentally alter interactions between the conserved HMG box and DNA unless very positively charged. Protein was expressed in bacterial strain BL21(DE3) containing plasmid pLysE. Sonicated bacterial extracts in native lysis buffer were incubated with nickel chelate resin. After binding, the resin was washed and His-tagged HMG proteins were eluted with a buffer containing imidazole. A typical analysis of eluted protein fractions by denaturing SDS polyacrylamide gel electrophoresis is shown in Fig. 1 c. Eluted protein was dialyzed into a buffer containing 20 mM Tris-HCl, pH 7.5, 50 mM KCl, 5% glycerol, and 5 mM dithiothreitol, and stored frozen at −80°C. Prior to the experiment, the HMG stock solutions are diluted ∼1000-fold into 10 mM HEPES buffer (pH 7.5) with NaCl at 50 or 100 mM as described above.
Data analysis
The worm-like chain (WLC) model describes an elastic polymer with a fixed dihedral bond angle. This formalism has proven successful in characterizing the properties of double-stranded DNA (dsDNA) force-extension data below the overstretching transition. The high-force limit solution for the WLC that includes an elastic correction is described by (35,37):
 |
(1) |
Here the extension per basepair, bds, is the contour length, while Pds is the persistence length, and Kds is the elastic modulus. Typical measured values for dsDNA are bss = 0.34 nm, Pss = 48 nm, and Kss = 1200 pN, though there are known dependencies upon salt concentration and pH (35,38,39).
The extensible freely joined chain model that fits the data of single-stranded DNA (ssDNA) also describes an elastic polymer, but with a varying bond angle. The solution assumes the form (40)
 |
(2) |
where bss is the contour length of single-stranded DNA, Pss and Kss are the persistence length, and elastic modulus of single-stranded DNA, respectively. Experimental values for ssDNA in 150 mM Na+ are bss = 0.56 nm, Pss = 0.75 nm, and Kss = 800 pN (41). As in the double-stranded case, these parameters are affected by solution conditions. This model is particularly appropriate for protein-saturated DNA. The utility of these fits is discussed below.
RESULTS AND DISCUSSION
Characterizing DNA stretching response
Typical DNA stretching data are shown in Fig. 2 b. These results are comparable to previous force spectroscopy data (33–35,39,41–45). When applying a stretching force, the response of dsDNA appears elastic, due to entropy. As the DNA is uncoiled, this effect ends with the onset of the overstretching region where significant cooperative basepair melting occurs. Free dsDNA may be repeatedly stretched and relaxed from this region. A small amount of hysteresis appears in the relaxation curve as the reannealing lags the relaxation. Extending DNA further beyond the overstretching regime yields ssDNA, such that the two ssDNA strands will separate at ∼150 pN applied force (35). The solid curves of Fig. 2 b are generated using the WLC and the freely joined chain models (Materials and Methods).
HMG effects on DNA
The data of Figs. 3 and 4 show the stretching curves for DNA in different concentrations of protein solution containing the isolated box A of HMGB2. As the protein is added, the persistence length decreases while the contour length increases. These changes are attributed to the intercalation mode described above (8,9,11), as discussed in the Introduction. An additional binding mode is described below.
FIGURE 3.
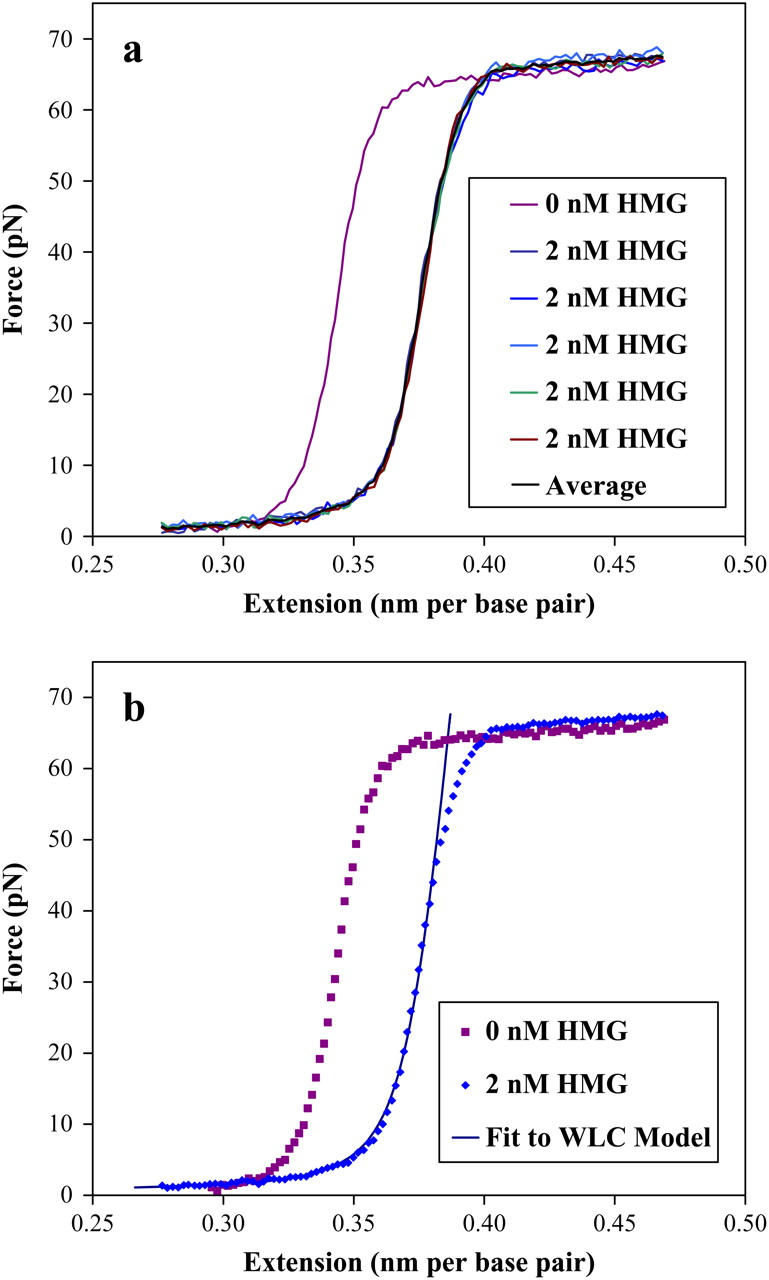
(a) The effects of introducing a 2-nM solution of HMGB2 box A protein to dsDNA in 100 mM Na+ are shown in these stretching curves. (a) The reproducibility of the data is shown as compared to a protein free DNA stretching curve. The average of these five curves is shown in black. (b) The averaged data of the previous figure and the protein-free data are compared and shown as dotted lines. The solid line is a fit to the worm-like chain (WLC) model of the text, yielding a persistence length of 26 ± 3 nm and a contour length of .382 ± .010 nm per basepair (the elastic modulus is explained in a later section). The uncertainty in the data is smaller than the points shown.
FIGURE 4.
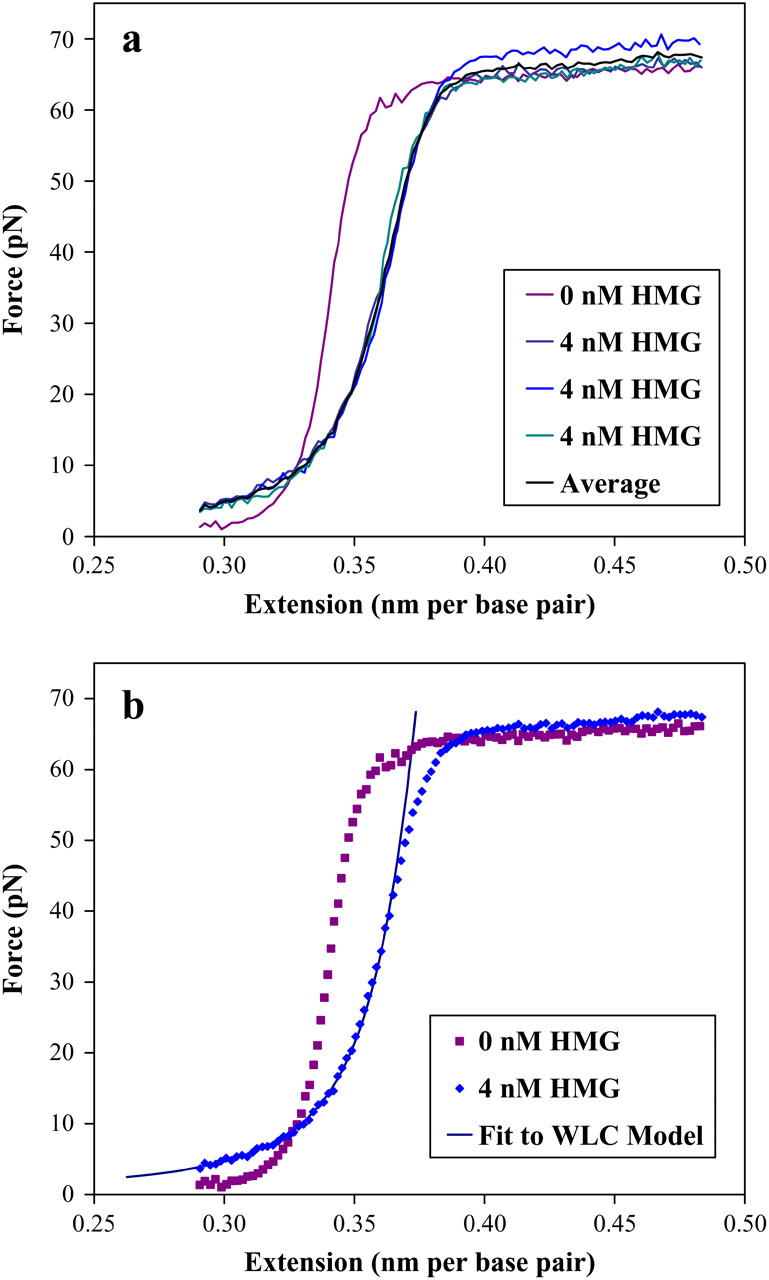
The effects of introducing a 4-nM solution of HMGB2 box A protein to dsDNA in 50 mM Na+ are shown in these stretching curves. (a) The reproducibility of the data is shown as compared to a protein-free DNA stretching curve. The average of these three curves is shown in black. The dynamic range of the piezoelectric prevented the collection of force data below 2 pN. Additionally, this force was held to prevent DNA looping described in a later section. (b) The averaged data of the previous figure and the protein-free data are compared and shown as dotted lines. The solid line is a fit to the worm-like chain (WLC) model of the text, yielding a persistence length of 4.4 ± 2.0 nm and a contour length of .388 ± .010 nm per basepair (the elastic modulus is explained in a later section). The uncertainty in the data is smaller than the points shown.
Fig. 3 a compares data for protein-free DNA in 100 mM Na+ to the same double helix in a 2-nM HMG (also 100 mM Na+) protein solution. The five curves collected with protein show the reproducibility of the data. An average force curve is shown in black. This average data is shown separately in Fig. 3 b. In Fig. 4 a, data is shown for DNA in 50 mM Na+, with 4 nM HMG. A larger effect is seen here, and the average is shown in Fig. 4 b. Additionally, a significant increase in the low extension force is observed for low-salt and high-protein concentrations. The dynamic range of the piezo prevented collection of lower extensions (and low force) and the high extensions necessary to see the overstretching transition (see Fig. 8). Additionally, this force was necessary to prevent loop formation (discussed below).
FIGURE 8.
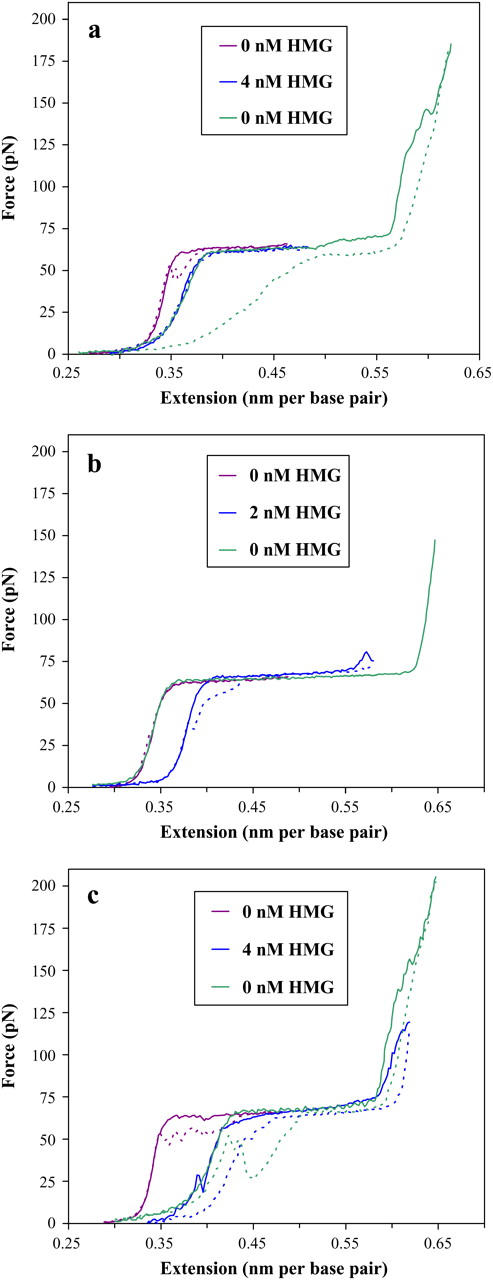
HMG binds strongly to DNA, as seen in this series of solid stretching and dotted relaxation curves shown for various bulk solution protein concentrations. The initial purple curve is an extension/relaxation cycle collected before the addition of any protein, whereas the blue curve reflects dsDNA that has been exposed to a given concentration of HMGB2 protein. The final green curve is the extension/relaxation data for the same dsDNA strand where the bulk protein solution has been rinsed and replaced with fresh buffer. (a) In 50 mM Na+, there is little evidence of protein unbinding. Relaxation shows little hysteresis, and subsequent curves overlap well. Though relatively high stretching forces are applied, the protein appears to remain bound, as evidenced by the overlap of the blue and green curves. Additionally, the protein stabilizes the DNA above the normal breaking force of 150 pN (compare to Fig. 2). (b) Lower concentrations of HMGB2 protein may be unbound from dsDNA in 100 mM Na+. When the DNA is rinsed with buffer, the stretching curve (green) overlaps the initial protein-free stretching curve perfectly, and breaks at the single-strand stretching limit of ∼150 pN (thus no relaxation curve). (c) In 100 mM Na+, higher concentrations of HMG appear to remain bound. The DNA may be rinsed and stretched to a force considerably above the typical DNA breaking force (compare to Figs. 2 and 8 a), with no change in the stretching curve. Considerable hysteresis is shown for DNA stretched beyond the overstretching region. The longer timescales of this experiment (4 h) prevented accurate correction of the baseline for the last curves.
Quantitative effects of HMG–DNA binding
To quantify the extent to which protein binding is capable of altering the flexibility of dsDNA, the stretching data for HMGB protein bound to dsDNA may be fit to the WLC model of Eq. 1. The force uncertainty in the data is generally assumed constant (and is roughly 0.5 pN for our instrument), though due to strong protein aggregation, the uncertainty is weighted by the force for higher protein concentrations (>2 nM), to reduce the effects due to tangling at low forces and drifts in the baseline. The data are then fit using a Levenberg-Marquardt general nonlinear χ2 routine (46,47). Uncertainties in each fitted parameter are derived from the variances yielded by the fit, and added to numerical estimates made by examining the derivative of χ2 with respect to each parameter. The upper force limit to the fit is ∼45 pN, to ensure that cooperative DNA melting has not begun, yet to collect enough information to determine the elastic response (see below). Fits to the averaged data described above are shown as the solid lines to the data in Figs. 3 b and 4 b.
Though this equation may fit force-extension data, in practice the solution is often multivalued. In particular, the addition of the elastic modulus to the model is approximate at high forces (>10 pN). Various theories have been proposed to simplify the relationship, by making Pds and Kds proportional (36), and including screened charges of DNA (35,48). Such measures, although valid for isolated DNA, cannot be considered in the description of the HMG-DNA complex. Others have described DNA-protein binding complexes (49,50), though only for low force. Yet another correction includes improvements to the WLC model utilizing a polynomial expansion in the force (51). These improvements suggested that the persistence length in particular is underestimated in the approximate WLC expression. We have utilized these expansions in our fits and found no change within uncertainty for the resulting parameters for HMG–DNA complexes. Additionally, we have performed fits using a cutoff force of only 10 pN, and eliminating to elastic modulus term in the WLC model. Once again, the results for the remaining parameters are within the uncertainties of our high-force limit fits. Though the elastic correction is approximate, and leads to large errors in that parameter (see below), the protein does appear to have a strong and quantifiable effect upon the curvature and contour length of the DNA.
Force-extension curves were collected for a range of protein concentrations up to 8 nM HMGB in 50 and 100 mM Na+. A protein solution of 2 mL is flown through the cell, which represents ∼10× the flow cell volume, effectively ensuring that the desired final concentration is present in the cell. Above this protein concentration, an additional binding mode was observed, which will be described in another section. Generally the stretching curves were fit individually, and the resulting parameters were averaged. This yields the same results as the fits to the average, as described for Figs. 3 and 4, yet allows us to weight the parameter uncertainties for noisier fits. Additionally, the fits allow corrections to the baseline to be determined, as the instrument will drift over the course of longer experiments. To confirm any drift, as well as the long-term time dependence of any binding, the time courses of several experiments were varied, to separate real increases in the low-force data from instrument drift. These experiments yielded consistent results for the low-force data of high-protein concentration DNA–HMG complexes.
HMG–DNA binding in the flexible hinge model
The results of curve fitting the worm-like chain model for the persistence length are shown in Fig. 5. The persistence length of bare DNA was determined to be 45 ± 3 nm, with a slight difference between 50 and 100 mM Na+ buffer (43 ± 2 nm and 46 ± 2 nm, respectively). This agrees well with the previously measured values of 46 ± 2 nm in 50 mM Na+ and 47 ± 2 nm in 100 mM Na+ (35). At even relatively low HMGB protein concentrations, the persistence length decreases rapidly, though a significant difference appears between dsDNA in different salt concentrations. Binding saturates at high-protein concentrations and the data converge somewhat as the persistence length decreases to 3.2 ± 1.2 nm (50 mM Na+) and to 5.9 ± 1.3 nm (100 mM Na+). We propose that in the lower salt concentration (50 mM Na+), the effect due to binding DNA is nearly complete in 4 nM HMG, and the persistence length is determined by the length of the DNA/HMG intercalated structure. Fits to the concentration dependence of the persistence length are described below.
FIGURE 5.

The results of curve fitting the worm-like chain model for the persistence length. The persistence length of dsDNA without protein was measured as 43 ± 2 nm in 50 mM Na+ and 46 ± 2 nm in 100 mM Na+. At high protein concentrations, the binding saturates as the persistence length decreases to 3.2 ± 1.2 nm in 50 mM Na+ and to 5.9 ± 1.3 nm in 100 mM Na+. The dotted and solid lines are fits in 50 mM and 100 mM Na+ using the method described in the text (Eqs. 3 and 4).
The contour length, defined in Eq. 1 as the separation per basepair of dsDNA, increases as the concentration of HMG is increased. This effect is shown in Fig. 6. Unlike the persistence length, the increase in contour length appears to be independent of the salt concentration, within the uncertainty of our results. As the binding saturates, the contour length stabilizes at 0.397 ± 0.012 nm per basepair, a 16% increase from the measured naked DNA contour length of 0.341 ± 0.003 nm per basepair. The increase in basepair separation appears to be due not only to intercalating residues, but to unwinding and significant untwisting of the helix, as noted above (52).
FIGURE 6.

The contour length of dsDNA increases as the concentration of HMGB2 is increased, according to the worm-like chain model. As the binding saturates, the contour length appears to stabilize at 0.397 ± 0.012 nm per basepair, an increase from the naked DNA contour length of 0.341 ± 0.003 nm per basepair.
The results of the fit to the elastic modulus show more noise than the other parameters. This is unfortunately due to several factors: the sensitivity of the final fit to changes in the elastic modulus is small, whereas higher force data where changes in the elastic modulus are most informative must be disregarded to eliminate overstretching effects. Such effects are not a part of the WLC model. Any drifts in the force baseline appear to affect the elastic modulus more than the other parameters. As discussed in the Materials and Methods section, the elastic modulus is a measure of DNA resistance to further stretching beyond the contour length, and its inclusion into the WLC model is approximate. The elastic modulus is often linked to the persistence length, in an effort to increase the stability of the fitting routines, by eliminating one of the variable parameters. However, the complexity of the DNA-protein interaction precludes this assumption. Generally, however, the elastic modulus increases from a value of 1250 ± 180 pN (naked DNA) to 2500 ± 400 pN (4 nM HMGB2). This value agrees reasonably well with values measured on other DNA binding proteins (53), though there is only scarce data on the subject. Furthermore, while the general trend sees the DNA stiffen as the protein is added, in 50 mM Na+ intermediate amounts of protein appear to cause the DNA to become slightly less stiff. This is most likely due to the contribution of intermediate segments of unbound DNA, which have been substantially perturbed by protein binding and are less stable in lower salt.
Concentration dependence of the persistence length and the induced bending angle
The concentration dependence of the persistence length may yield parameters for the DNA-protein interaction. The measured persistence length that is fit to the worm-like chain model of Eq. 1, P, is the harmonic sum of the persistence length of the protein-bound DNA, PPR, and the unbound DNA, PDNA (54);
 |
(3) |
Here Θ is the binding site occupancy, and ranges from zero to one. This occupancy and the protein concentration are related by the McGhee and von Hippel protein-DNA binding isotherm (55):
 |
(4) |
where K is the binding constant, c is the protein concentration, and n is the DNA binding site size.
Fits to data are shown in Fig. 5, where the solid curve is the fit in 100 mM Na+ and the dashed line is in 50 mM Na+. From these fits, we determine the binding site size, n, to be 5 ± 1 basepairs (bp) and 6 ± 1 bp in 50 and 100 mM Na+, respectively. This compares favorably with previous estimates of 7 bp for HMG–D (56). Additionally, the binding constant, K, was determined to be (2.2 ± 1.1) × 107 M−1 and (9 ± 4) × 106 M−1 in 50 and 100 mM Na+. These results match up well against a value of 2 × 10⁷ M−1 for HMG–D, obtained with circularization assays in 100 mM Na+ (56). Note that K cannot be simply read from Fig. 5 because the fractional binding is not directly proportional to the persistence length, but is instead given by Eq. 3. Finally, the protein-induced persistence length, PPR, was found to be (1.0 ± 0.3) nm and (2.1 ± 0.6) nm in 50 and 100 mM Na+. Thus, the persistence length of protein-bound dsDNA appears to approach the persistence length of ssDNA. The value for PPR should approach the saturated values for P determined in the previous section, as indicated by Eq. 3 in the case Θ = 1. However, though the high concentration data of Figs. 5, 6, and 7 would appear to be saturated, this is not the case. Furthermore, these values have been observed to remain unchanged over several hours, in contrast to the growth of a second binding mode, mentioned below. Unfortunately, data at higher concentrations, where the fits predict Θ = 1, show only this second mode, and reveal no hinge binding. The minimum persistence length actually observed in our experiments is 3.2 ± 1.2 nm in 50 mM Na+ and to 5.9 ± 1.3 nm in 100 mM Na+.
FIGURE 7.

The elastic modulus increases from a value of 1250 ± 180 pN (naked DNA) to 2500 ± 400 pN in the presence of HMGB2 protein. Furthermore, although the general trend shows the DNA to stiffen as the protein is added, in 50 mM salt intermediate amounts of protein appear to cause the DNA to become slightly less stiff.
The parameters gained from these fits may be used to estimate the average bending angle induced by the HMGB2 box A protein when bound to DNA. The persistence length of a polymer that bends by a hinge mechanism can be expressed as (54,57)
 |
(5) |
where bS is the contour length and β is the mean-square bending angle per basepair. Using the data from the fits of the concentration dependence of the persistence length, and using the saturated contour length, bS, from Fig. 6 as 0.397 nm per basepair, we find an average DNA bend angle per protein of 114 ± 21° for 50 nM Na+, and 87 ± 9° for 100 mM Na+. This result is in general agreement with the values reported in other experiments.
HMG–DNA binding affinity and the flexible hinge
Fig. 8 a shows the stretching (solid) and relaxation (dotted) curves for DNA and DNA–HMG complexes in 50 mM Na+. The additional curve in Fig. 8 a reflects dsDNA that has been exposed to a 4-nM solution of HMGB protein, then rinsed with buffer that contains no protein, for at least 2 mL, or 10× the flow cell volume. Furthermore, as the overstretching region was reached, the flow of buffer was restored. In addition to providing an extra 20 pN force, this should remove any unbound protein from the region of the DNA, and prevent any subsequent rebinding. We hypothesized that the resulting curve should resemble the extension curve for naked DNA. However, the subsequent force extension curve demonstrates that the protein remains bound, even when the saturated DNA/HMG complex is subjected to nearly 200 pN. Additionally, the resistance of the bound DNA to breakage has increased significantly in the presence of HMG protein, exceeding the 150-pN limit at which the two ssDNA strands normally separate (observed previously in Fig. 2 b). Thus HMG appears to stabilize DNA. Additionally, the protein solution curve (blue) shows little hysteresis upon relaxation, indicating normal reannealing of the bases between the protein binding sites, indicating no single DNA strand binding, and showing that both binding modes persist after DNA is stretched. The hysteresis observed in the relaxation of the rinsed curve (green) is probably due to melting and subsequent slow cooperative reannealing of the DNA in the HMG-bound regions.
Lower concentrations of HMGB protein may be unbound from dsDNA in 100 mM Na+, as shown in Fig. 8 b. At higher force, however, the curves peak in the overstretching regions for 1 and 2 nM HMG protein. These events appear to reflect protein unbinding, though some protein appears to remain, as the binding appears to remain upon subsequent stretches (not shown). Note that there is still no hysteresis for the relaxation curves. In addition to the application of high force, the DNA may be rinsed with buffer to wash away unbound protein. The subsequent force-extension curve (green) now perfectly overlaps the initial naked DNA stretching curve, and breaks at the single-strand stretching limit of ∼150 pN (so there is no relaxation curve).
Above 2 nM HMG in 100 mM Na+, the protein appears to remain bound upon DNA stretching, even when the DNA is rinsed. The final curve of Fig. 8 c overlaps the stretching data for 4 nM HMG, indicating little protein unbinding. This DNA may be stretched well into the single-strand stretching region repeatedly, and above the normal breaking force of ssDNA (compare to Figs. 2 b and 8 b). Finally, under the conditions of high protein concentration and a stretching force greater than the overstretching force, there is hysteresis in the relaxation curves. The reason for this is unclear, though there may be some limited protein unbinding or HMG-bound DNA melting in the presence of very high (>100 pN) forces.
Thus, HMGB appears to unbind only below a critical concentration limit of ∼2 nM. This result contradicts the model in which the enhanced DNA curvature is due to transient protein binding of fixed angle. Such a model requires rapid protein unbinding to induce the observed decrease in DNA persistence length. We have shown that DNA curvature is enhanced even in conditions under which the protein is not able to unbind. Thus, bound HMG protein appears to be capable of inducing enhanced DNA curvature without unbinding from the DNA. This appears to favor a “flexible hinge” model, in which the protein-bound DNA exhibits actual enhanced curvature, perhaps due to partial denaturation of the double helix.
HMG–DNA filament formation
In Fig. 9 a, the progressive decrease of the overstretching transition, Δb, is visible over the course of several hours. This stands in contrast to the previous figures, especially Fig. 8, where very little change is visible. We hypothesize that in addition to the intercalation mode characterized above, the reduction in the length of the overstretching transition of Fig. 9 a reveals another binding mode. In this mode the protein binds cooperatively, forming a rigid DNA–HMGB2 filament that shows no basepair melting. A similar mode has recently been discovered for the E. coli HU protein (32). Thus, Fig. 9 a shows the development of such a filament in 100 nM HMGB2 protein and 50 mM Na+. Protein intercalation is not apparent at this protein concentration. The progressive decrease in the overstretching transition length (Δb) correlates with decreasing lengths of unbound DNA. If bDNA is the typical force-extension curve for free DNA, and the filament extension curve is given by bfilament, then the observed force-extension curve may be expressed as a linear combination of the two curves, where f is the fraction of bases bound into the filament at a given force
 |
(6) |
FIGURE 9.
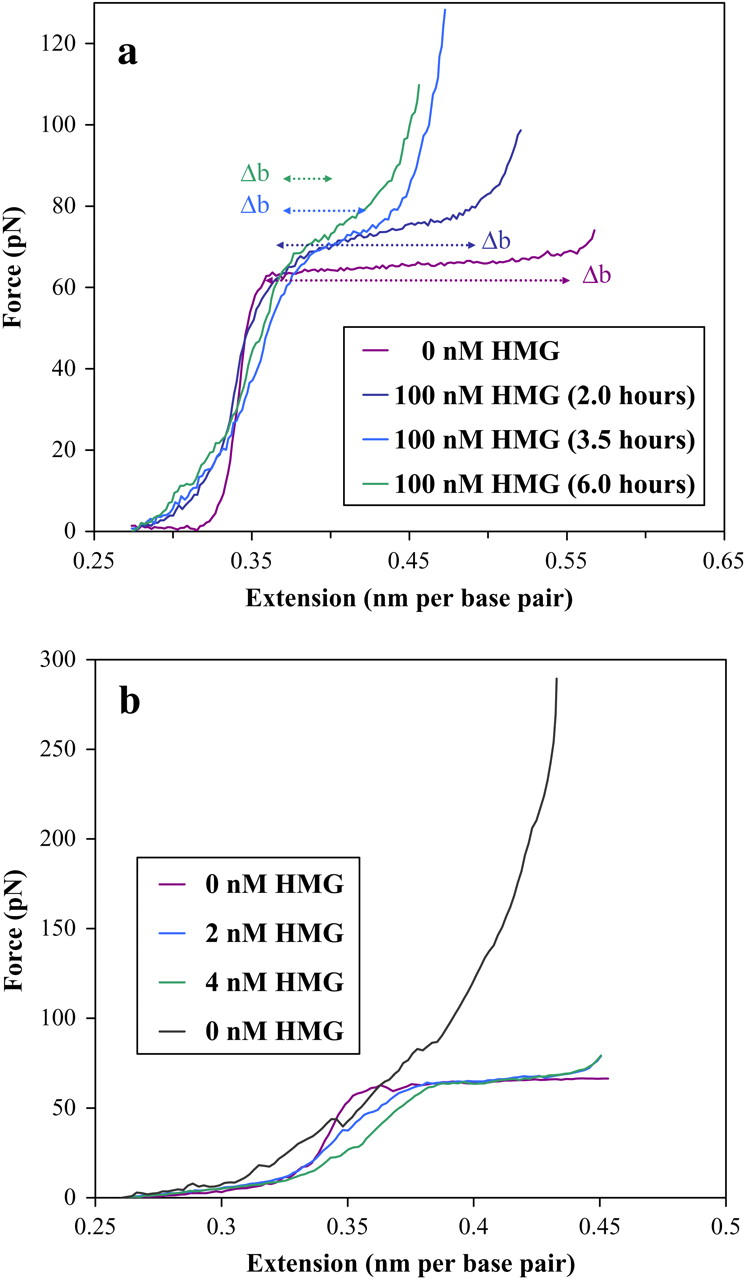
(a) The time evolution of filament formation on dsDNA in 50 mM salt, for 100 nM concentration of HMGB2. The filament appears over the course of hours, as shown by the decrease in the length of the overstretching transition. At these high protein concentrations the contour length appears to remain constant. (b) Evolution of filament formation in 50 mM salt, for the smaller concentrations shown. Evidence of the intercalation mode is apparent here, though it disappears as the protein completely covers the DNA, in the black curve. The protein solution was rinsed and replaced with fresh buffer for this last curve, in an effort to discern any DNA-protein unbinding. Clearly the protein attached to the DNA remains bound, even when the saturated DNA/HMGB2 complex is subjected to the instrumental force limit of nearly 300 pN. The longer timescales of this experiment (4 h) prevented accurate correction of the baseline for the last curves.
Here Δb is manifest in the overstretching transition, as bDNA makes the transition from double- to single-stranded DNA, whereas bfilament does not undergo any transition at forces less than 300 pN. Therefore, as f approaches unity, Δb approaches zero. In contrast to the hinge mode, which requires no more than a few minutes binding time, this filament mode stabilizes over the course of hours. However, the additional binding also reflects HMGB2 protein diffusion into the DNA region. Experiments repeated at lower HMGB2 protein concentrations (Fig. 9 b), while displaying consistent hinge binding, only sporadically demonstrate filament formation, even after several hours. More consistent filament formation was obtained by periodically flowing concentrations of HMG into the flow cell. Thus, the fraction of the DNA that has been bound by HMGB2 protein is probably determined by the total amount of protein that has passed close enough to the DNA to allow binding over the course of the experiment. Once the protein has been bound to the DNA in the filament form, it remains bound up to an applied force of at least 300 pN. This is the force limit of our instrument, as the streptavidin-coated bead is pulled from the optical trap. Clearly the HMGB2–DNA filament is a highly stable structure.
HMG unbinding: evidence of loop formation?
Finally, we may consider individual unbinding events shown in Fig. 10 a. We observed cases where the force-extension curve reached a maximum, and then transiently dropped, consistent with the release of HMGB2-dependent DNA loop. It is possible that each node where the DNA molecule crosses itself in three-dimensional space, perhaps mimicking a cruciform, creates an ideal binding site for HMG proteins. Such loops have been described in DNA under the tension of an optical trap (58), and observed when stabilized by the histones of the nucleosome core particle (59). As HMG proteins may stabilize large loops of DNA by this mechanism, our experiments appear to reveal the force-induced unbinding and opening of these structures. These events were repeatable for individual DNA strands, and occurred over several protein concentrations, including higher (100 nM) concentrations. Thus, loop formation, and the subsequent reduction in contour length, has also been observed in the filament formation described above, though it is not shown here.
FIGURE 10.
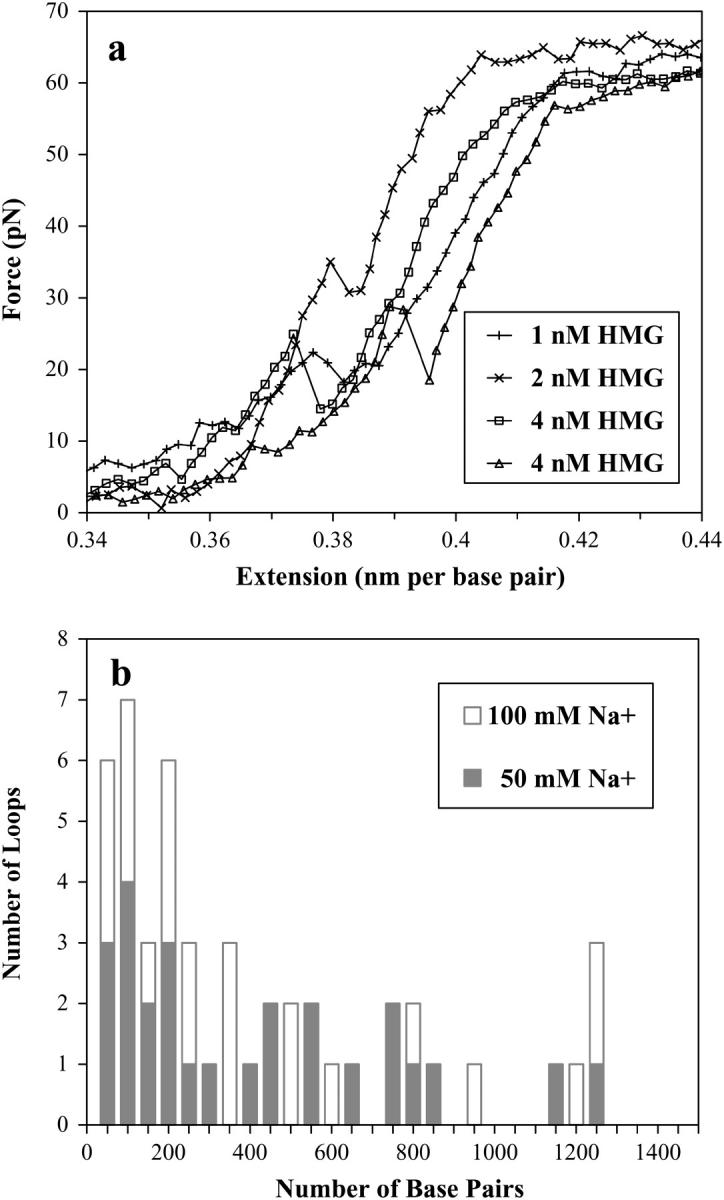
(a) Detection of individual unfolding events involving loops of HMGB2-bound dsDNA. The sudden decrease in the observed force is evidence for unbinding of a crossed dsDNA that was stabilized by HMGB2 protein. This corresponds to release of large loops when the aggregate HMGB2-bound junction is removed. The two curves labeled “4 nM HMG” were collected sequentially. (b) Histogram of released loop sizes in 50 mM Na+ and 100 mM Na+. The mean loop size is ∼440 basepairs, apparently independent of the salt concentration.
The contour length may be fit to the curve above and below this transient change, and the difference should correspond to the DNA length that has been unbound and released (60). Fitting all of the data to the worm-like chain model would be time consuming, and would necessarily involve highly approximate corrections to the elasticity. Alternatively, we could simply determine the change in the contour length directly from the plots, measuring Δb along the extension axis across the transient drop in the force. However, because our data was collected at 100-nm extension intervals, loops lower than 300 basepairs would be difficult to resolve, and any histogram of the loop length would show little detail. Instead, we measured the transient change in the force and used the worm-like chain model (Eq. 1) to estimate the corresponding change in the extension. Fig. 10 b shows the resulting distribution of the observed loop size for ∼50 openings, in 50 mM Na+ and 100 mM Na+, with little apparent difference in the distribution between the two salt concentrations.
The average increase in chain length was 150 nm. This corresponds to the release of a large DNA loop of an average of ∼440 basepairs. This chain length correlates well with the predicted lengths from theoretical studies (58). The theoretical work suggests three types of loop geometries: circular, teardrop, and kinked. Importantly, only kinked geometries may yield loops less than the persistence length (∼50 nm, or 150 basepairs). Overall, given the distribution of loop sizes and the large binding angle induced by the protein, it is likely that we see loops mainly of the kinked geometry, though the other geometries may be present as well.
The data shown here is for a range of protein concentrations from 0.5 to 8.0 nM HMG. As the protein concentration increases, the average loop size actually increases as well. This may be due to some binding saturation, where the randomly induced kinks induced by neighboring proteins begin to oppose each other. However, at higher concentrations, the data becomes somewhat noisier, possibly making the smaller loops difficult to detect.
The free energy that stabilizes this loop,  , may be found for a given force F and length Δℓ;
 |
(7) |
Unzipping an entire loop simultaneously requires a very large free energy of ∼1000 kT. However, if the structure that is opened is a cruciform, then the protein may be bound to a junction of DNA that is only a few nanometers long. Thus, only 15 kT may be required to open the loop. Finally, the average force required to destabilize such structures was ∼27 pN, and this force does not appear to change with loop size or protein concentration, which one might expect if progressively larger loops were stabilized as the protein concentration increased. The release of such HMG-dependent DNA loops under stretching force appears not to be accompanied by global HMG unbinding. We hypothesize that the loops generally form as the protein is being added, while the DNA may loop during fluid flow. These loops are pulled apart over successive stretches and the likelihood of reforming the loops becomes very low if the DNA is kept under tension (>1 pN). Additional studies emphasizing greater extension precision by decreasing the step size and including the dependence of the opening force and loop size upon the pulling rate, would offer further insight into these events.
CONCLUSION
We have examined the binding effects of a functional domain of HMGB2 upon the properties of dsDNA. The worm-like chain model of polymer elasticity fits the data well, indicating that the box A domain of HMGB2 binds and alters the physical properties of DNA, dramatically increasing DNA curvature at even low protein concentrations, and proving difficult to unbind. This agrees with (low-force) observations that DNA bound to HMGB1 and HU proteins shows increased compacting (50). HMGB2 protein significantly distorts the DNA, reducing the persistence length, intercalating between the basepairs and twisting the backbone. Although increasing salt concentration reduces the HMGB2 concentration required to reduce the DNA persistence length, the contour length, and thus helical unwinding and protein intercalation, is affected only by protein concentration. The change in the longitudinal elastic modulus is more complex, though generally increasing as the protein is added.
Is this apparent curvature change due to the formation of rigid kinks that are pulled out as the DNA is stretched, or to the formation of flexible hinges that actually make the DNA more flexible? The stretch and relax curves both show enhanced flexibility, indicating that the protein does not unbind upon DNA stretching (unless association and dissociation are much faster than the timescale of the experiment). Upon removal of the protein from the solution around the DNA, enhanced flexibility was still observed. This indicates that under some conditions the protein does not unbind, suggesting a stable binding that occurs on a longer timescale, as recently observed by others for the bacterial HU protein (32). In a rigid binding model, the HMG–DNA site is stiff and less flexible than the naked DNA, introducing a fixed, transient bend in the backbone, which should also lead to a significant decrease in the contour length. In the flexible hinge model, HMG enhances the local flexibility of the DNA, giving rise to an ensemble of bending angles. Thus, our results are most consistently explained by a flexible hinge model.
At much higher concentrations, an additional cooperative binding mode was observed to lead to irreversible filament formation. The contour length and persistence length appear largely unaffected, while the filament does become stiffer relative to naked DNA. Currently, there is no theory to quantitatively characterize these results, though our high-force optical tweezers instrument offers a promising new technique to study this phenomenon, in solution, for a wide variety of proteins.
Surprisingly, the HMGB2 box A protein appears to bind DNA tenaciously, as even high stretching forces and additional buffer flow failed to cause dissociation. These data would suggest that low concentrations of HMG may be sufficient to bind to nucleosomal DNA, possibly recognizing certain structural motifs. HMG removal may require competition from other binding proteins. Studies utilizing a more physiologically relevant protein construct with two domains of HMGB2 may show further effects upon the properties of single DNA molecules. These ongoing studies offer new insights into the biophysical mechanisms of HMGB proteins.
Acknowledgments
The authors express their gratitude to Prof. Phil Sharp, Massachusetts Institute of Technology, for providing the HMGB2 expression clone. We also thank Ioulia Rouzina for discussions and comments on the manuscript.
This work was supported by the Mayo Foundation and National Institutes of Health grant GM54411 to L.J.M. and by National Science Foundation (MCB-0238190), National Institutes of Health (GM072462), and the Research Corp. to M.C.W.
Philip R. Hardwidge's present address is Biotechnology Laboratory, 237-6174 University Blvd., University of British Columbia, Vancouver, BC, Canada V6T 1Z3.
References
- 1.Travers, A. A. 2003. Priming the nucleosome: a role for HMGB proteins? EMBO Rep. 4:131–136. [DOI] [PMC free article] [PubMed] [Google Scholar]
- 2.Bustin, M. 1999. Regulation of DNA-dependent activities by the functional motifs of the high-mobility group chromosomal proteins. Mol. Cell. Biol. 19:5237–5246. [DOI] [PMC free article] [PubMed] [Google Scholar]
- 3.Falciola, L., F. Spada, S. Calogero, G. Langst, R. Voit, I. Grummt, and M. E. Bianchi. 1997. High mobility group 1 protein is not stably associated with the chromosomes of somatic cells. J. Cell Biol. 137:19–26. [DOI] [PMC free article] [PubMed] [Google Scholar]
- 4.Bianchi, M. E., and M. Beltrame. 2000. Upwardly mobile proteins. Workshop: the role of HMG proteins in chromatin structure, gene expression and neoplasia. EMBO Rep. 1:109–114. [DOI] [PMC free article] [PubMed] [Google Scholar]
- 5.Ragab, A., and A. Travers. 2003. HMG-D and histone H1 alter the local accessibility of nucleosomal DNA. Nucleic Acids Res. 31:7083–7089. [DOI] [PMC free article] [PubMed] [Google Scholar]
- 6.Bustin, M. 2001. Revised nomenclature for high mobility group (HMG) chromosomal proteins. Trends Biochem. Sci. 26:152–153. [DOI] [PubMed] [Google Scholar]
- 7.Bustin, M., and R. Reeves. 1996. High-mobility-group chromosomal proteins: architectural components that facilitate chromatin function. Prog. Nucleic Acid Res. Mol. Biol. 54:35–100. [DOI] [PubMed] [Google Scholar]
- 8.Hardman, C. H., R. W. Broadhurst, A. R. Raine, K. D. Grasser, J. O. Thomas, and E. D. Laue. 1995. Structure of the A-domain of HMG1 and its interaction with DNA as studied by heteronuclear three- and four-dimensional NMR spectroscopy. Biochemistry. 34:16596–16607. [DOI] [PubMed] [Google Scholar]
- 9.Murphy, F. V. I., R. M. Sweet, and M. E. Churchill. 1999. The structure of a chromosomal high mobility group protein-DNA complex reveals sequence-neutral mechanisms important for non-sequence-specific DNA recognition. EMBO J. 18:6610–6618. [DOI] [PMC free article] [PubMed] [Google Scholar]
- 10.Allain, F. H., Y. M. Yen, J. E. Masse, P. Schultze, T. Dieckmann, R. C. Johnson, and J. Feigon. 1999. Solution structure of the HMG protein NHP6A and its interaction with DNA reveals the structural determinants for non-sequence-specific binding. EMBO J. 18:2563–2579. [DOI] [PMC free article] [PubMed] [Google Scholar]
- 11.Klass, J., F. I. Murphy, S. Fouts, M. Serenil, A. Changela, J. Siple, and M. E. Churchill. 2003. The role of intercalating residues in chromosomal high-mobility-group protein DNA binding, bending and specificity. Nucleic Acids Res. 31:2852–2864. [DOI] [PMC free article] [PubMed] [Google Scholar]
- 12.Thomas, J. O., and A. Travers. 2001. HMG1 and 2, and related ‘architectural’ DNA binding. proteins. Trends Biochem. Sci. 26:167–174. [DOI] [PubMed] [Google Scholar]
- 13.Bianchi, M. E., and M. Beltrame. 1998. Flexing DNA: HMG-box proteins and their partners. Am. J. Hum. Genet. 63:1573–1577. [DOI] [PMC free article] [PubMed] [Google Scholar]
- 14.Lnenicek-Allen, M., C. M. Read, and C. Crane-Robinson. 1996. The DNA bend angle and binding affinity of an HMG box increased by the presence of short terminal arms. Nucleic Acids Res. 24:1047–1051. [DOI] [PMC free article] [PubMed] [Google Scholar]
- 15.Stros, M. 1998. DNA bending by the chromosomal protein HMG1 and its high mobility group box domains. Effect of flanking sequences. J. Biol. Chem. 273:10355–10361. [PubMed] [Google Scholar]
- 16.Jamieson, E. R., M. P. Jacobson, C. M. Barnes, C. S. Chow, and S. J. Lippard. 1999. Structure and kinetic studies of a cisplatin-modified DNA icosamer binding to HMG1domain B. J. Biol. Chem. 274:12346–12354. [DOI] [PubMed] [Google Scholar]
- 17.Lorenz, M., A. Hillisch, D. Payet, M. Buttinelli, A. Travers, and S. Diekmann. 1999. DNA bending induced by high mobility group proteins studied by fluorescence resonance energy transfer. Biochemistry. 38:12150–12158. [DOI] [PubMed] [Google Scholar]
- 18.Bianchi, M. E., M. Beltrame, and G. Paonessa. 1989. Specific recognition of cruciform DNA by nuclear protein HMG1. Science. 243:1056–1059. [DOI] [PubMed] [Google Scholar]
- 19.He, Q., U. M. Ohndorf, and S. J. Lippard. 2000. Intercalating residues determine the mode of HMG1 domains A and B binding to cisplatin-modified DNA. Biochemistry. 39:14426–14435. [DOI] [PubMed] [Google Scholar]
- 20.Agresti, A., and M. E. Bianchi. 2003. HMGB proteins and gene expression. Curr. Opin. Genet. Dev. 13:170–178. [DOI] [PubMed] [Google Scholar]
- 21.Thomas, J. O., and A. A. Travers. 2001. HMG1 and 2, and related ‘architectural’ DNA-binding proteins. Trends Biochem. Sci. 26:167–174. [DOI] [PubMed] [Google Scholar]
- 22.Paull, T. T., M. Carey, and R. C. Johnson. 1996. Yeast HMG proteins NHP6A/B potentiate promoter-specific transcriptional activation in vivo and assembly of preinitiation complexes in vitro. Genes Dev. 10:2769–2781. [DOI] [PubMed] [Google Scholar]
- 23.Mitsouras, K., B. Wong, C. Arayata, R. C. Johnson, and M. Carey. 2002. The DNA architectural protein HMGB1 displays two distinct modes of action that promote enhanceosome assembly. Mol. Cell. Biol. 22:4390–4401. [DOI] [PMC free article] [PubMed] [Google Scholar]
- 24.Jayaraman, L., N. C. Moorthy, K. G. Murthy, J. L. Manley, M. Bustin, and C. Prives. 1998. High mobility group protein-1 (HMG-1) is a unique activator of p53. Genes Dev. 12:462–472. [DOI] [PMC free article] [PubMed] [Google Scholar]
- 25.Moreira, J. M., and S. Holmberg. 2000. Chromatin-mediated transcriptional regulation by the yeast architectural factors NHP6A and NHP6B. EMBO J. 19:6804–6813. [DOI] [PMC free article] [PubMed] [Google Scholar]
- 26.Kruppa, M., R. D. Moir, D. Kolodrubetz, and I. M. Willis. 2001. Nhp6, an HMG1 protein, functions in SNR6 transcription by RNA polymerase III in S. cerevisiae. Mol. Cell. 7:309–318. [DOI] [PubMed] [Google Scholar]
- 27.Laser, H., C. Bongards, J. Schuller, S. Heck, N. Johnsson, and N. Lehming. 2000. A new screen for protein interactions reveals that the Saccharomyces cerevisiae high mobility group proteins Nhp6A/B are involved in the regulation of the GAL1 promoter. Proc. Natl. Acad. Sci. USA. 97:13732–13737. [DOI] [PMC free article] [PubMed] [Google Scholar]
- 28.Travers, A. A., S. S. Ner, and M. E. Churchill. 1994. DNA chaperones: a solution to a persistence problem? Cell. 77:167–169. [DOI] [PubMed] [Google Scholar]
- 29.Calogero, S., F. Grassi, A. Aguzzi, T. Voigtlander, P. Ferrier, S. Ferrari, and M. E. Bianchi. 1999. The lack of chromosomal protein Hmg1 does not disrupt cell growth but causes lethal hypoglycaemia in newborn mice. Nat. Genet. 22:276–280. [DOI] [PubMed] [Google Scholar]
- 30.Paull, T. T., M. J. Haykinson, and R. C. Johnson. 1993. The nonspecific DNA-binding and -bending proteins HMG1 and HMG2 promote the assembly of complex nucleoprotein structures. Genes Dev. 7:1521–1534. [DOI] [PubMed] [Google Scholar]
- 31.Ross, E. D., P. R. Hardwidge, and L. J. Maher 3rd. 2001. HMG proteins and DNA flexibility in transcription activation. Mol. Cell. Biol. 21:6598–6605. [DOI] [PMC free article] [PubMed] [Google Scholar]
- 32.Van Noort, J., S. Verbrugge, N. Goosen, C. Dekker, and R. T. Dame. 2004. Dual architectural roles of HU: formation of flexible hinges and rigid filaments. Proc. Natl. Acad. Sci. USA. 101:6969–6974. [DOI] [PMC free article] [PubMed] [Google Scholar]
- 33.Williams, M. C., I. Rouzina, V. A. Bloomfield, and J. R. Wenner. 2002. Thermodynamics of DNA interactions from single molecule stretching experiments. Acc. Chem. Res. 35:159–166. [DOI] [PubMed] [Google Scholar]
- 34.Williams, M. C., J. R. Wenner, I. Rouzina, and V. A. Bloomfield. 2001. Entropy and heat capacity of DNA melting from temperature dependence of single molecule stretching. Biophys. J. 80:1932–1939. [DOI] [PMC free article] [PubMed] [Google Scholar]
- 35.Wenner, J. R., M. C. Williams, I. Rouzina, and V. A. Bloomfield. 2002. Salt dependence of the elasticity and overstretching transition of single DNA molecules. Biophys. J. 82:3160–3169. [DOI] [PMC free article] [PubMed] [Google Scholar]
- 36.Baumann, C. G., S. Smith, V. A. Bloomfield, and C. Bustamante. 1997. Ionic effects on the elasticity of single DNA molecules. Proc. Natl. Acad. Sci. USA. 94:6185–6190. [DOI] [PMC free article] [PubMed] [Google Scholar]
- 37.Odijk, T. 1995. Stiff chains and filaments under tension. Macromolecules. 28:7016–7018. [Google Scholar]
- 38.Marko, J. F., and E. D. Siggia. 1995. Stretching DNA. Macromolecules. 28:8759–8770. [Google Scholar]
- 39.Bustamante, C., J. F. Marko, E. D. Siggia, and S. Smith. 1994. Entropic elasticity of lambda-phage DNA. Science. 265:1599–1600. [DOI] [PubMed] [Google Scholar]
- 40.Smith, S., L. Finzi, and C. Bustamante. 1992. Direct mechanical measurements of the elasticity of single DNA molecules by using magnetic beads. Science. 258:1122–1126. [DOI] [PubMed] [Google Scholar]
- 41.Smith, S. B., Y. Cui, and C. Bustamante. 1996. Overstretching B-DNA: the elastic response of individual double-stranded and single-stranded DNA molecules. Science. 271:795–799. [DOI] [PubMed] [Google Scholar]
- 42.Williams, M. C., and I. Rouzina. 2002. Force spectroscopy of single DNA and RNA molecules. Curr. Opin. Struct. Biol. 12:330–336. [DOI] [PubMed] [Google Scholar]
- 43.Williams, M. C., J. R. Wenner, I. Rouzina, and V. A. Bloomfield. 2001. The effect of pH on the overstretching transition of dsDNA: evidence of force induced DNA melting. Biophys. J. 80:874–881. [DOI] [PMC free article] [PubMed] [Google Scholar]
- 44.Cluzel, P., A. Lebrun, C. Heller, R. Lavery, J. L. Viovy, D. Chatenay, and F. Caron. 1996. DNA: an extensible molecule. Science. 271:792–794. [DOI] [PubMed] [Google Scholar]
- 45.Rief, M., H. Clausen-Schaumann, and H. E. Gaub. 1999. Sequence-dependent mechanics of single DNA molecules. Nat. Struct. Biol. 6:346–349. [DOI] [PubMed] [Google Scholar]
- 46.Bevington, P. R., and D. K. Robinson. 1992. Data Reduction and Error Analysis for the Physical Sciences. McGraw-Hill, New York.
- 47.Press, W. H., S. A. Teukolsky, W. T. Vetterling, and B. P. Flannery. 2002. Numerical Recipes in C: The Art of Scientific Computing. Cambridge University Press, Cambridge, UK.
- 48.Podgornik, R., P. L. Hansen, and V. A. Parsegian. 2000. Elastic modulii renormalization in self-interacting stretchable polyelectrolytes. J. Chem. Phys. 113:9343–9350. [Google Scholar]
- 49.Yan, J., and J. F. Marko. 2003. Effects of DNA-distorting proteins on DNA elastic response. Phys. Rev. E Stat. Nonlin. Soft Matter Phys. 68:011905. [DOI] [PubMed] [Google Scholar]
- 50.Skoko, D., B. Wong, R. C. Johnson, and J. F. Marko. 2004. Micromechanical analysis of the binding of DNA-bending proteins HMGB1, NHP6A, and HU reveals their ability to form highly stable DNA-protein complexes. Biochemistry. 43:13867–13874. [DOI] [PubMed] [Google Scholar]
- 51.Bouchiat, C., M. D. Wang, J. F. Allemand, T. Strick, S. M. Block, and V. Croquette. 1999. Estimating the persistence length of a worm-like chain molecule from force-extension measurements. Biophys. J. 76:409–413. [DOI] [PMC free article] [PubMed] [Google Scholar]
- 52.Churchill, M. E., D. N. Jones, T. Glaser, H. Hefner, M. A. Searles, A. A. Travers, G. L. Shaw, S. S. Ner, J. Keeler, and D. Neuhaus. 1995. HMG-D is an architecture-specific protein that preferentially binds to DNA containing the dinucleotide TG. EMBO J. 14:1264–1275. [DOI] [PMC free article] [PubMed] [Google Scholar]
- 53.Hegner, M., S. Smith, and C. Bustamante. 1999. Polymerization and mechanical properties of single RecA-DNA filaments. Proc. Natl. Acad. Sci. USA. 96:10109–10114. [DOI] [PMC free article] [PubMed] [Google Scholar]
- 54.Rouzina, I., and V. A. Bloomfield. 1998. DNA bending by small, mobile multivalent cations. Biophys. J. 74:3152–3164. [DOI] [PMC free article] [PubMed] [Google Scholar]
- 55.McGhee, J. D., and P. H. von Hippel. 1974. Theoretical aspects of DNA-protein interactions: co-operative and non-co-operative binding of large ligands to a one-dimensional homogeneous lattice. J. Mol. Biol. 86:469–489. [DOI] [PubMed] [Google Scholar]
- 56.Churchill, M. E., A. Changela, L. K. Dow, and A. J. Krieg. 1999. Interactions of high mobility group box proteins with DNA and chromatin. Methods Enzymol. 304:99–103. [DOI] [PubMed] [Google Scholar]
- 57.Schellman, J. A. 1974. Flexibility of DNA. Biopolymers. 13:217–226. [DOI] [PubMed] [Google Scholar]
- 58.Sankararaman, S., and J. F. Marko. 2005. Formation of loops in DNA under tension. Phys. Rev. E Stat. Nonlin. Soft Matter Phys. 71:021911. [DOI] [PubMed] [Google Scholar]
- 59.Leuba, S. H., M. L. Bennink, and J. Zlatanova. 2004. Single molecule analysis of chromatin. Methods Enzymol. 376:73–105. [DOI] [PubMed] [Google Scholar]
- 60.Liphardt, J., B. Onoa, S. Smith, I. Tinoco, and C. Bustamante. 2001. Reversible unfolding of single RNA molecules by mechanical force. Science. 292:733–737. [DOI] [PubMed] [Google Scholar]