Abstract
The interaction of cyanines with nucleic acids is accompanied by intense changes of their optical properties. Consequently these molecules find numerous applications in biology and medicine. Since no detailed information on the binding mechanism of DNA/cyanine systems is available, a T-jump investigation of the kinetics and equilibria of binding of the cyanines Cyan40 [3-methyl-2-(1,2,6-trimethyl-4(1H)pyridinylidenmethyl)-benzothiazolium ion] and CCyan2 [3-methyl-2-[2-methyl-3-(3-methyl-2(3H)-benzothiazolylidene)-1-propenyl]-benzothiazolium ion] with CT-DNA is performed at 25°C, pH 7 and various ionic strengths. Bathochromic shifts of the dye absorption band upon DNA addition, polymer melting point displacement (ΔT = 8–10°C), site size determination (n = 2), and stepwise kinetics concur in suggesting that the investigated cyanines bind to CT-DNA primary by intercalation. Measurements with poly(dA-dT)·poly(dA-dT) and poly(dG-dC)·poly(dG-dC) reveal fair selectivity of CCyan2 toward G-C basepairs. T-jump experiments show two kinetic effects for both systems. The binding process is discussed in terms of the sequence D + S ⇆ D,S ⇆ DSI ⇆ DSII, which leads first to fast formation of an external complex D,S and then to a partially intercalated complex DSI which, in turn, converts to DSII, a more stable intercalate. Absorption spectra reveal that both dyes tend to self-aggregate; the kinetics of CCyan2 self-aggregation is studied by T-jump relaxation and the results are interpreted in terms of dimer formation.
INTRODUCTION
Considerable efforts have been devoted in recent years to find fluorescent dyes which could provide a convenient alternative to the employment of classical ones (acridines, phenanthridines). Among these, the class of cyanines has proved to be particularly useful. Cyanine dyes found their first use in color photography (1) and then in high energy lasers and digital image storage. However, most of the interest in cyanine dyes is related to their biological and biomedical use as molecular probes (2). Nowadays the majority of fluorescent dyes commonly used for DNA visualization assays belongs to the cyanine family (3,4), since these molecules display high affinity for nucleic acid double strands, strong absorption in the visible range of the spectrum, and sharp increase of fluorescence emission when interacting with DNA (5–9). If their first use is DNA sequencing and fluorescence microscopy, cyanines dyes can also be very usefully employed for conformational studies via fluorescence energy transfer (10–12), agarose gel and capillary electrophoresis staining (13), DNA analysis in polymerization chain reactions (14,15), and flow cytometry (16), or as fluorescent probes for membrane fluidity (17,18) and membrane potential studies (19). The ultimate level of DNA detection sensitivity was achieved in the size determination and imaging of individual DNA molecules labeled with cyanine dyes (9).
Cyanine dyes are able to interact with DNA by intercalation, but also by groove-binding (20–22). Eriksson et al. (23) have carried out a study on the rates of dissociation of both non-intercalating and intercalating cyanine dyes: on the ground that groove-binders are more salt-sensitive than intercalators of the same charge, these authors propose that salt effect analysis could enable the two modes of binding to be distinguished.
Taking into account the wide range of uses for biological applications, a deeper understanding of the interaction mode of these molecules with natural polynucleotides is useful in order to plan the synthesis of new cyanine dyes with optimized properties. For this purpose, the knowledge of the interaction mechanism would be particularly important, but no detailed studies on the kinetics of cyanine binding to nucleic acids are available. Hence, a temperature-jump study has been carried out on the DNA/Cyan40 (Cyan40 = 3-methyl-2-(1,2,6-trimethyl-4(1H)pyridinylidenmethyl)-benzothiazolium ion) and DNA/CCyan2 (CCyan2 = 3-methyl-2-[2-methyl-3-(3-methyl-2(3H)-benzothiazolylidene)-1-propenyl]-benzothiazolium ion) systems.
MATERIALS AND METHODS
Materials
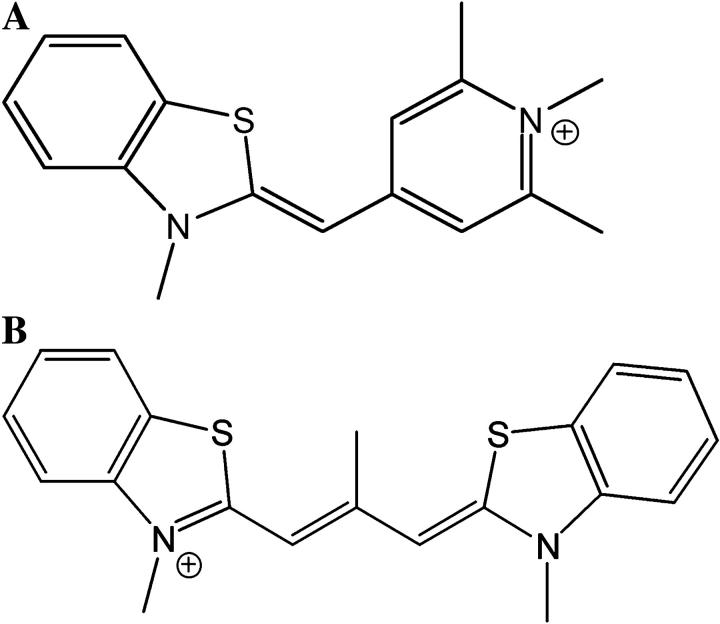
Previously synthesized Cyan40 methyl sulfate (Fig. 1 A) and CCyan2 iodide (Fig. 1 B) (24) were used without further purification. Stock solutions of the dyes (2 × 10⁻³ M) were prepared by dissolving weighed amounts of the solid in DMSO and kept in the dark at 4°C. Working solutions were obtained by dilution of the stocks to such a level that the DMSO content could be neglected and were standardized spectrophotometrically, using ɛ = 5.40 × 10⁴ M−1 cm−1 at λ = 435 nm, I = 0.1 M (NaCl), pH = 7.0 (21) for Cyan40 and ɛ = 4.70 × 10⁴ M−1 cm−1 at 543 nm, I = 0.1 M (NaCl), pH = 7.0 (25) for CCyan2.
FIGURE 1.
(A) Cyan40 ≡ 3-methyl-2-(1,2,6-trimethyl-4(1H)pyridinylidenmethyl)-benzothiazolium ion; and (B) CCyan2 ≡ 3-methyl-2-[2-methyl-3-(3-methyl-2(3H)-benzothiazolylidene)-1-propenyl]-benzothiazolium ion.
Calf thymus DNA was purchased from Pharmacia Biotech (Uppsala, Sweden), in the form of lyophilized sodium salt, dissolved into water and sonicated as described below. Stock solutions were standardized spectrophotometrically, using ɛ = 13,200 M−1 cm−1 at 260 nm, I = 0.1 M (NaCl), pH = 7.0 as obtained from the sample certificate.
Poly(dA-dT)·poly(dA-dT) and poly(dG-dC)·poly(dG-dC), also from Pharmacia Biotech, were purchased as lyophilized sodium salt, dissolved in water and standardized spectrophotometrically, by using ɛ =13,200 M−1 cm−1 at λ = 262 nm, I = 0.1 M (NaCl), pH = 7.0 for poly(dA-dT)·poly(dA-dT) and ɛ = 16,800 M−1 cm−1 at λ = 254 nm, I = 0.1 M (NaCl), pH = 7 for poly(dG-dC)·poly(dG-dC) (26,27). The polynucleotide concentrations are expressed in molarity of basepairs and will be indicated as CP. Sodium chloride was used to adjust the ionic strength, and sodium cacodylate (1.0 × 10⁻² M, or 3 × 10⁻³ M in case of low ionic strength studies) was employed to keep the pH of the solutions at the value of 7.0. Doubly distilled water was used throughout.
Methods
DNA sonication was carried out using an MSE-Soniprep sonicator (Sanyo Gallenkamp, Leicestershire, UK), by applying to suitable DNA samples (10 mL of CT-DNA ∼2 × 10⁻³ M) seven repeated cycles of 10-s sonication and 20-s pause, at an amplitude of 14 μm. The sonicator tip was introduced directly into the solution, this being kept in an ice bath to minimize thermal effects due to sonication. Agarose gel electrophoresis tests indicated that the polymer length was reduced to ∼800 basepairs.
Measurements of pH were made by a Radiometer Copenhagen (Copenhagen, Denmark) PHM84 pH Meter equipped with a combined glass electrode.
Spectrophotometric measurements were carried out on a PerkinElmer (Überlingen, Germany) Lambda 35 spectrophotometer. Binding measurements were performed at λ = 435 nm (Cyan40) and λ = 543 nm (CCyan2). Fluorescence titrations were performed on a PerkinElmer LS55 spectrofluorometer at λexc = 440 nm and λem = 474 nm (Cyan40), and at λexc = 543 nm and λem = 570 nm (CCyan2). The intensity of the emitted light was corrected by applying the equation Fcorr = Fobs antilog [(Absexc + Absem)/2] (28), although under the conditions of the experiments the inner filter effect was largely reduced. The titrations were carried out by adding increasing amounts of the polynucleotide directly into the cell containing the dye solution. The principal component analysis of the dye spectra was performed by the DATAN program developed by Kubista (29).
Kinetic measurements were performed on a T-jump apparatus made in our laboratory, which is based on the Riegler et al. prototype (30), except that photomultipliers are replaced by suitable silica photodiodes (Model S1336, Hamamatsu Photonics, Hamamatsu, Japan). A tungsten lamp-monochromator system or a blue laser diode (λ = 405 nm, 1 mW) were used as light sources. The T-jump apparatus is able to measure absorbance and/or fluorescence changes and both detection modes were employed. To assess possible effects from electric-field alignment some experiments were performed in the absorbance detection mode by inserting a polarizer in front of the entrance cell windows and setting it at the magic-angle value. The relaxation times were found to be independent of the polarizer presence, thus indicating that the length of the sonicated DNA is short enough to make the orientation/deorientation effects much faster than the chemical effect (31). The kinetic curves were collected by a Tektronix TDS 210 (Beaverton, OR) storage oscilloscope, transferred to a PC, and evaluated with the program DISCRETE (32).
Self-aggregation kinetics of CCyan2 was investigated by varying the dye concentration in the 5 × 10⁻⁶ M ÷ 1.4 × 10⁻⁴ M range. Kinetic experiments on the DNA/Cyan40 system were done in the following conditions: CP = 1 × 10⁻⁵ M ÷ 4 × 10⁻⁴ M, CD = 6.8 × 10⁻⁶ M (CP and CD denoting, respectively, the polymer and dye total concentrations). Kinetic experiments on the DNA/CCyan2 system were done in the following conditions: CP = 5 × 10⁻⁵ M ÷ 4 × 10⁻⁴ M and CD = 1 × 10⁻⁶ M. For both systems, two relaxation times differing by more than one order of magnitude (milliseconds and tenths of second) were observed. Since our data storage device lacks the dual sampling scale, the experiments have been recorded first at a high and then at a low sampling rate and the two effects were analyzed separately. Each shot was repeated at least 10 times and the relaxation curves obtained were averaged via an accumulation procedure.
Thermal denaturation experiments were carried out by monitoring absorbance variations with temperature at 260 nm. The DNA concentration was CP = 5 × 10⁻⁵ M for all experiments, whereas dye concentration was CD = 1 × 10⁻⁴ M for the DNA/CCyan2 and DNA/proflavine systems and CD = 2 × 10⁻⁴ M for DNA/CCyan40. The ionic strength and the pH values were 0.013 M (NaCl) and 7.0, respectively. Under these conditions, nucleic acid saturation by the dye is ensured in the whole temperature range. Particular care was put in checking that the equilibrium was achieved after each temperature increase. The temperature was measured by direct insertion of a probe into the cell and found to fluctuate within ±0.1°C.
RESULTS
Equilibria
Cyanines tend to self-aggregate (33–35) and the aggregation process can interfere with that of dye binding to nucleic acids. Hence, we have studied first the self-aggregation of Cyan40 and CCyan2 in the absence of DNA. Fig. 2 A shows how the spectrum of CCyan2 changes with increasing dye concentration. At the lowest concentration, where the dye is supposed to be present as a monomer, a single band, centered at 535 nm, can be observed. A second band at 495 nm appears at higher dye levels and, finally, a shoulder forms between 473 and 483 nm. This behavior indicates that aggregation phenomena are taking place (36), as suggested also by change with concentration of the intensity ratio of the two bands and by the large deviations from the Lambert-Beer law observed for both dyes (Figs. 1S and 2S of Supplementary Material). By adding DNA to the solution containing the aggregate (Fig. 2 B), the shoulder (corresponding to the aggregate) tends to disappear, whereas the intensity of the band at higher wavelength increases and displays a bathochromic shift from 535 nm to 545 nm. This observation indicates that the dye is bound to DNA in its monomer form (at least at the highest values of the DNA/dye ratio) and then that the mode of binding could be intercalative.
FIGURE 2.
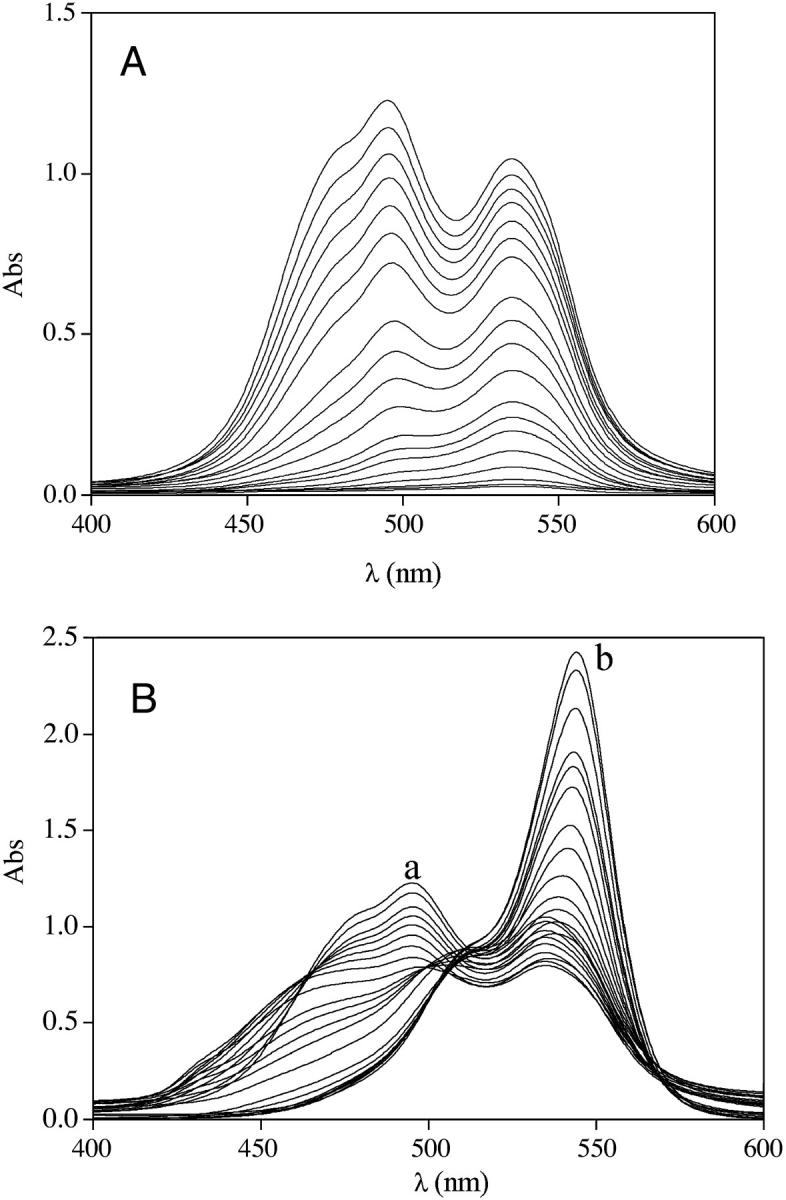
(A) Absorbance spectra of CCyan2 from CD = 5.4 × 10⁻⁷ M to CD =2.0 × 10⁻⁵ M (top). (B) Absorbance spectra of CCyan2 (CD = 2.0 × 10⁻⁵ M) in the presence of increasing amounts (CP) of DNA; (a) CP = 0 M; (b) CP = 8.8 × 10⁻⁴ M. I = 0.1 M NaCl, pH = 7.0, T = 25°C. The spectral behavior indicates the occurrence of a self-aggregation process.
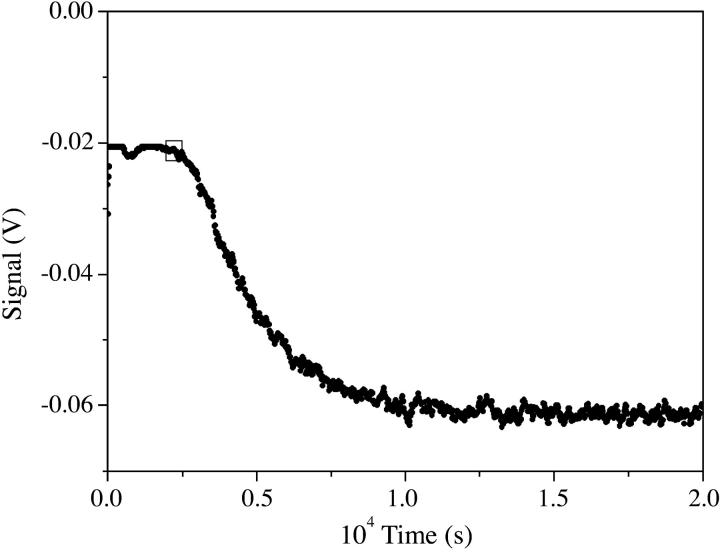
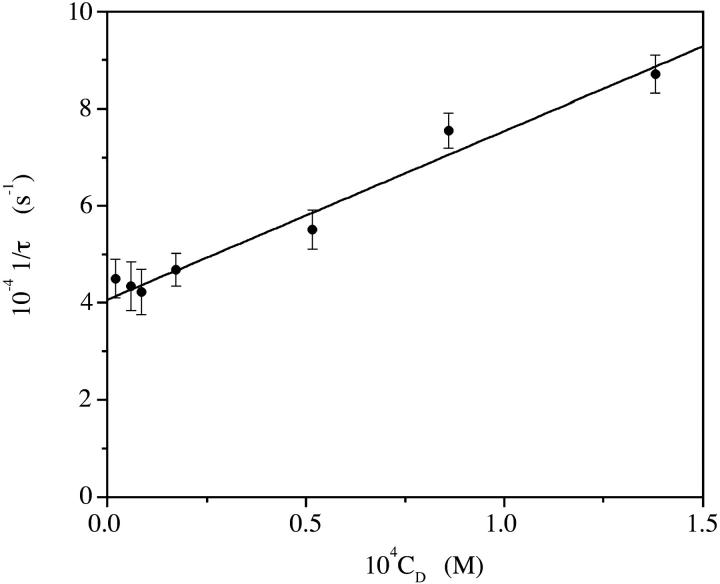
The kinetic analysis of the aggregation process was carried out for CCyan2, the dye displaying the higher propensity to self-aggregate. T-jump curves are monoexponential (Fig. 3) and the trend of a plot of 1/τ versus CD is linear (Fig. 4). Such behavior is rationalized by a simple dimerization process (reaction in Eq. 1, below),
 |
(1) |
According to the reaction in Eq. 1, the concentration-dependence of the relaxation time is expressed by the relationship in Eq. 2:
 |
(2) |
The analysis of the data according to Eq. 2 yields kf = (8.6 ± 0.3) × 107 M−1 s−1 and kd = (4.1 ± 0.2) × 104 s−1. The equilibrium constant of the reaction in Eq. 1 is KD = kf/kd = (2.1 ± 0.4) × 103 M−1.
FIGURE 3.
T-jump experiment showing CCyan2 aggregation; CD = 1.7 × 10⁻⁵ M, I = 0.1 M NaCl, pH = 7.0, T = 25°C, λ = 534 nm, risetime = 5 μs, heating time = 1.6 μs, 1/τ = 4.7 × 10⁴ s−1.
FIGURE 4.
Analysis of the aggregation kinetics of CCyan2. The linear dependence of 1/τ on the dye concentration is interpreted according to a dimerization process. I = 0.1 M NaCl, pH = 7.0, T = 25°C. The continuous line is based on Eq. 2.
In the experiments on DNA/dye interaction, dye concentrations were always kept at levels low enough that aggregation could be excluded. Moreover, it was verified that no relaxation effects could be observed for dye solutions of concentrations equal to those used for the DNA/dye interaction studies.
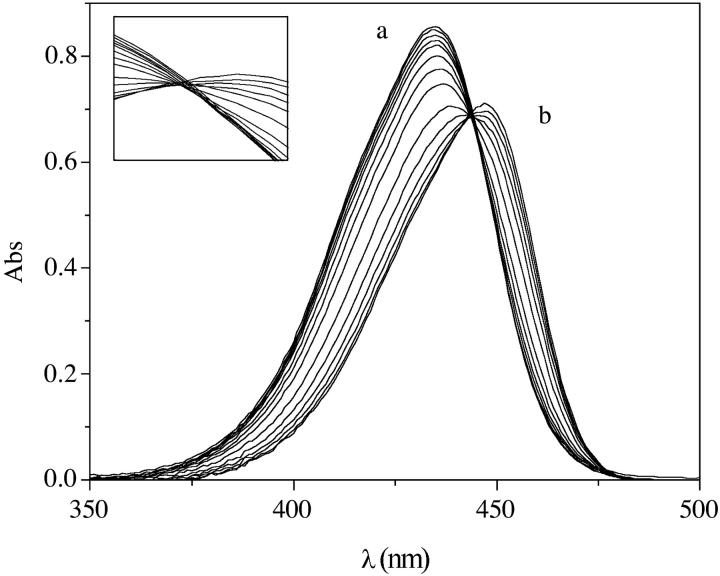
Equilibria of Cyan40 binding to DNA have been investigated by both the spectrophotometric and the spectrofluorimetric methods, whereas the equilibria of the DNA/CCyan2 system were studied only by spectrofluorimetry, as the use of the absorbance mode would had required dye concentrations high enough to make unavoidable the self-aggregation of the dye. The absorbance spectra for the DNA/Cyan40 system (Fig. 5) show both hypochromic and bathochromic effects that can be related to an intercalative mode of interaction (37). The enlargement shows a not-well-defined isosbestic point, suggesting the occurrence of no simple equilibrium (38). A typical titration curve, performed in the absorbance mode, is shown in Fig. 3S in Supplementary Material, whereas the data of fluorescence titrations for the DNA/Cyan40 and DNA/CCyan2 systems are plotted in Figs. 4S and 5S in Supplementary Material, respectively. Note that the emission of fluorescence increases sharply upon addition of increasing amounts of DNA to a dye solution.
FIGURE 5.
Absorbance spectra of the DNA/Cyan40 system. (a) CP = 0, CD = 1.6 × 10⁻⁵ M; (b) CP = 1.5 × 10⁻⁴ M, CD = 1.6 × 10⁻⁵ M; I = 0.1 M NaCl, pH = 7.0, T = 25°C. The insert shows a not-well-defined isosbestic point, which suggests that the binding process is not a simple one.
The equilibrium between a dye molecule, D, and a free site, S, on DNA can be expressed by the apparent reaction in Eq. 3:
 |
(3) |
The bound dye concentration [DS] can be directly obtained from the experimental data. A and A0 are the optical density values for the dye in the presence of DNA and in its absence, respectively, and ɛi is the molar extinction coefficient of the i-species. It turns out that [DS] = (A–A0)/(ɛDS − ɛD) = ΔAbs/Δɛ. The free dye concentration [D] is equal to CD − [DS], whereas the free site concentration is [S] = f(r)CP, where f(r) is the fraction of free polynucleotide sites. It can be demonstrated (39,40) that f(r) = (1 – nr)n[1 − (n−1)r]1−n with r = [DS]/CP and n equal to the site size.
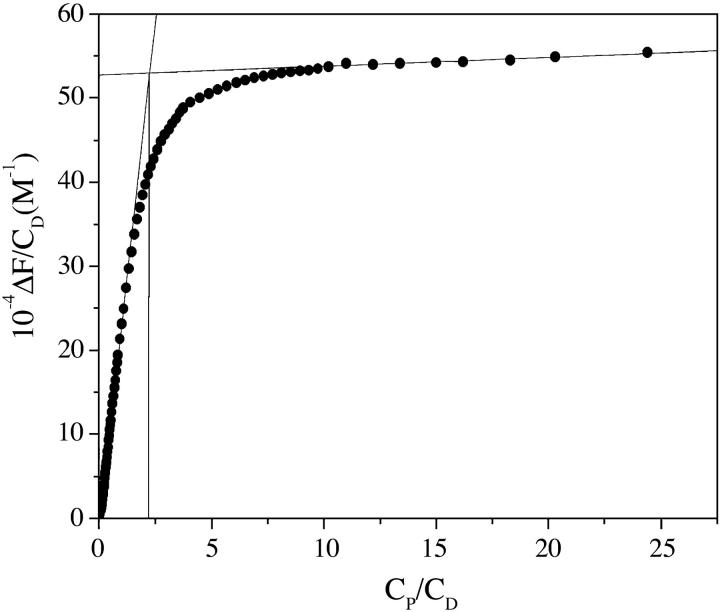
The site size, n, defined as the number of monomer units of the polymer involved in the binding of one dye molecule under conditions of complete saturation, was obtained for the DNA/Cyan40 system by performing low ionic-strength titrations (41,31) where the complete saturation of the polynucleotide is easily achieved.
The straight lines interpolating the initial and final parts of the titration curve intersect to a point where CP/CD = n = 2 (Fig. 6). It was impossible to evaluate the site size of the DNA/CCyan2 system by the same procedure since, under the conditions needed for such an experiment, dye aggregation cannot be avoided. Nevertheless, for further data treatment, the value of 2 was also assumed for this system, on the basis of the molecular similarity of the two dyes.
FIGURE 6.
Fluorescence titration for the DNA/Cyan40 system. CD = 1.4 × 10⁻⁵ M, I = 0.013 M NaCl, pH = 7.0, λex = 440 nm, λem = 474 nm, T = 25°C. The titration at low ionic strength leads to complete polymer saturation. Hence, the intersection of the two straight lines provides the value of the site size (n = 2).
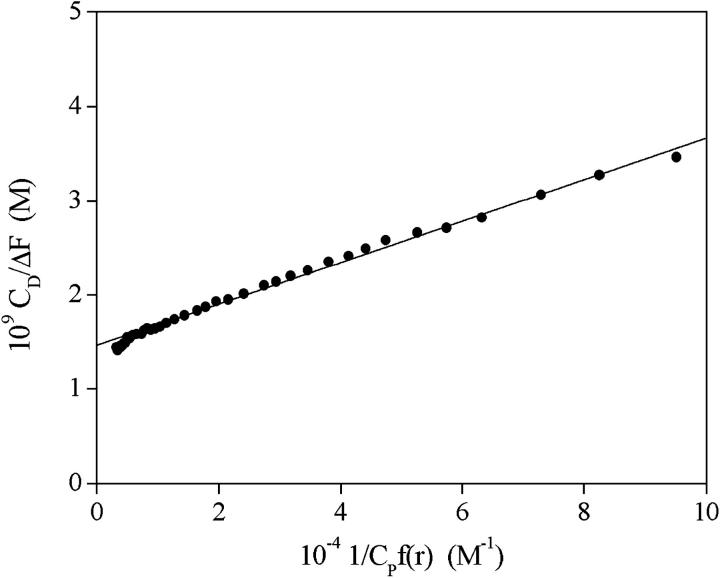
The equilibrium constant of Eq. 3, defined as K = [DS]/([D] × [S]), is evaluated, together with the Δɛ value, from titration data by iterative fits to Eq. 4:
 |
(4) |
To evaluate [S] a first estimate of Δɛ was made from the amplitude of the binding isotherms as those shown in Figs. 3S–5S, then a new Δɛ value is obtained from the intercept of the straight line fitting the experimental data. This second Δɛ value is used to reevaluate [S] and the procedure is repeated until convergence is reached. Usually three iterations only are needed (42).
The same procedure has been used for fluorescence measurements, simply replacing ΔAbs and Δɛ by the difference in the fluorescence intensities ΔF = F − F0 and Δφ = φDS − φD, respectively. The parameter φi is defined as φi = 2.3 I0 ɛi l Qik, where I0 is the excitation intensity, ɛi is the absorption coefficient at the excitation wavelength, Qi is the quantum yield of the ith-species, l is the optical path, and k is an instrumental factor. An example of the analysis of the data is shown in Fig. 7. The values of the equilibrium parameters are collected in Table 1.
FIGURE 7.
Analysis of a spectrofluorimetric titration for the DNA/CCyan2 system. The continuous line is based on Eq. 4. CD = 5 × 10⁻⁷ M, I = 0.1 M NaCl, pH = 7.0, λexc = 543 nm, λem = 570 nm, T = 25°C.
TABLE 1.
Reaction parameters for the interaction of CT-DNA with Cyan40 and CCyan2 (pH = 7.0, I = 0.1 M NaCl, T = 25°C)
| Dye | 10−4K M−1 | 10−3K0 M−1 | K1 | K2 | 10−3k1 s−1 | 10−3k−1 s−1 | 10−1k2 s−1 | 10−1k−2 s−1 |
|---|---|---|---|---|---|---|---|---|
| Cyan40 | 3.2 ± 1.2* | 9.8 ± 1.8 | 1.5 ± 0.3¶ | 1.2 ± 0.3¶ | 5.9 ± 1.2 | 3.9 ± 0.5 | 9.2 ± 0.9 | 8.0 ± 0.7 |
| 2.5 ± 0.1† | ||||||||
| 2.4 ± 0.1‡ | ||||||||
| 3.2 ± 0.1§ | ||||||||
| CCyan2 | 6.8 ± 1.4* | 7.6 ± 0.4 | 4.1 ± 0.8¶ | 1.2 ± 0.7¶ | 5.4 ± 0.3 | 1.3 ± 0.2 | 1.3 ± 0.4 | 1.1 ± 0.3 |
| 6.8 ± 0.1‡ |
Spectrophotometric data were also analyzed by means of Eq. 5 (43) for the DNA/Cyan40 system. Fits to Eq. 5 are linear for r < 0.15 (Fig. 6 S),
 |
(5) |
Eq. 5 provides the values of K = KSCB and B, where B is a constant related to the site size by the relationship n = (1+1/B)/2 (39). The values of the equilibrium parameters obtained by the Scatchard analysis agree with the ones found by the procedure described above (Table 1). Deviations from linearity occurring for r > 0.15 reveal a rearrangement of the occupied sites at high degrees of site occupation.
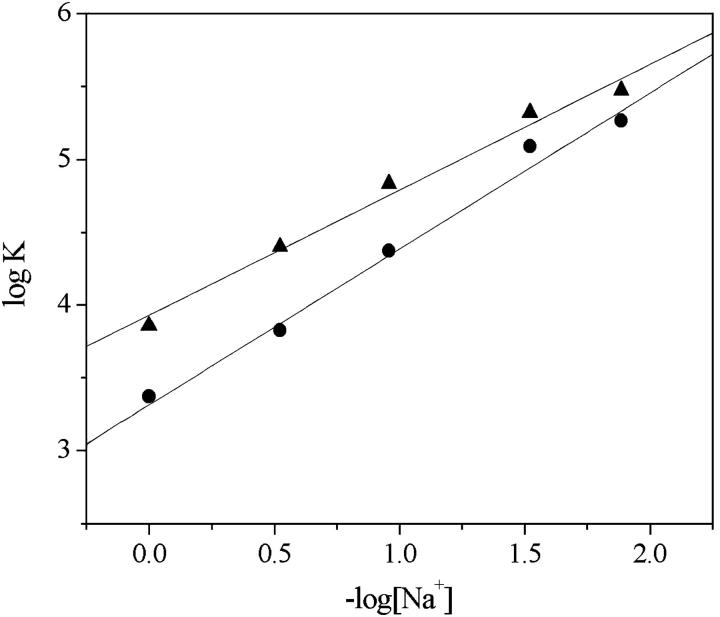
As the intercalation reaction takes place between charged partners, a salt-concentration dependence of the equilibrium parameters is likely to be observed (44). Table 2 shows that the equilibrium constants decrease by increasing salt (NaCl) concentrations from 0.013 to 1 M, in agreement with the presence of electrostatic interactions between the positively charged dye and the negatively charged phosphate on DNA. The trend of a plot of logK versus −log[Na+] is linear (Fig. 8), in agreement with the Record equation (45,46), and the slopes of the straight line interpolating the experimental data points are 1.1 for DNA/Cyan40 and 0.86 for DNA/CCyan2.
TABLE 2.
Salt concentration dependence of the reaction parameters for the interaction of CT-DNA with Cyan40 and CCyan2 (pH = 7.0, T = 25°C)
| Cyan40
|
CCyan2
|
||||||||
|---|---|---|---|---|---|---|---|---|---|
| [Na+] (M) | 10−4K* M−1 | 10−4K* M−1 | 10−4K† M−1 | 10−7K0k1 M−1 s−1 | 10−3k−1 s−1 | 10−1k2 s−1 | 10−1k−2 s−1 | 10−4K0K1 (M−1) | K2 |
| 0.013 | 18 ± 2 | 30 ± 1 | |||||||
| 0.03 | 12 ± 1 | 21 ± 1 | 16 ± 7 | 9.6 ± 2.2 | 1.5 ± 0.3 | 1.8 ± 0.2 | 1.1 ± 0.2 | 6.4 ± 1.3 | 1.5 ± 0.4 |
| 0.1 | 2.7 ± 0.2 | 6.8 ± 0.1 | 6.8 ± 1.4 | 4.1 ± 0.4 | 1.3 ± 0.2 | 1.3 ± 0.4 | 1.1 ± 0.3 | 3.1 ± 0.7 | 1.2 ± 0.7 |
| 0.3 | 0.67 ± 0.03 | 2.5 ± 0.1 | 2.5 ± 1.0 | 1.5 ± 0.8 | 1.5 ± 0.1 | 1.2 ± 0.2 | 0.78 ± 0.10 | 1.0 ± 0.5 | 1.5 ± 0.4 |
| 1 | 0.24 ± 0.01 | 0.72 ± 0.01 | |||||||
From static measurements.
Kinetics K = K0K1(1 + K2).
FIGURE 8.
Log K as a function of –log[Na+] for the DNA/Cyan40 (•) and DNA/CCyan2 (▴) systems. pH = 7.0, T = 25°C. The lower slope value derived for CCyan2 reflects a lower density of positive charge for this dye compared to Cyan40.
Van't Hoff plots of the temperature dependence of the equilibrium constants between 15°C and 45°C for both the DNA/Cyan40 and DNA/CCyan2 systems display good linearity (Fig. 7S). The reaction enthalpy, ΔH°, is (−5.3 ± 0.2) kcal M−1 for Cyan40 and (−4.3 ± 0.2) kcal M−1 for CCyan2.
Kinetics
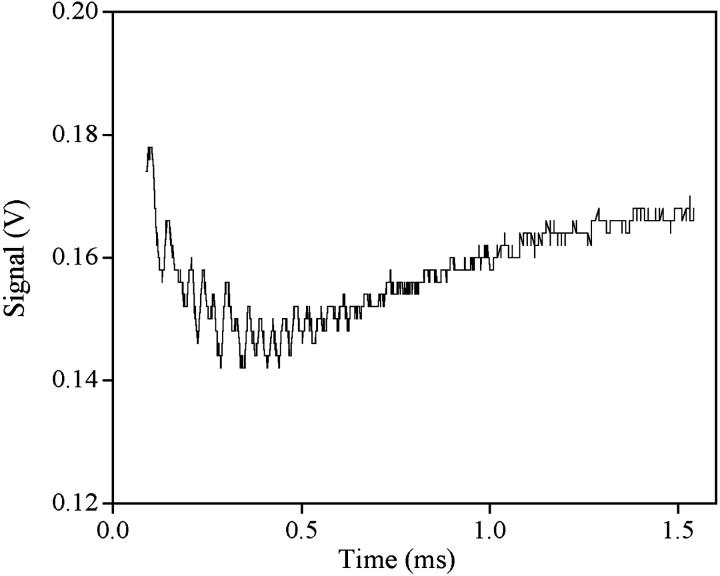
T-jump relaxation curves are biexponential for both systems, and reveal the presence of two distinct kinetic effects differing by one order of magnitude on the timescale and with amplitudes of opposite sign (Fig. 9). The analysis of the kinetic data is made by plotting the reciprocal of the two relaxation times, 1/τf and 1/τs, on F(C), a function of reactant concentrations defined as F(C) = CPf(r) – [D]f ′(r) with f′(r) = df(r)/dr (40). The obtained curves tend to level off at the highest F(C) values for both systems (Fig. 10, A and B, and Fig. 11, A and B).
FIGURE 9.
Relaxation curve for the DNA/Cyan40 system monitored in the fluorescence mode. CD = 6.8 × 10⁻⁶ M, CP = 3.9 × 10⁻⁴ M, I = 0.1 M, pH = 7.0, T = 25°C, λexc = 405 nm (laser diode), risetime = 5 μs, heating time = 1.6 μs. The biexponential effect reveals that the binding occurs in two steps at least.
FIGURE 10.
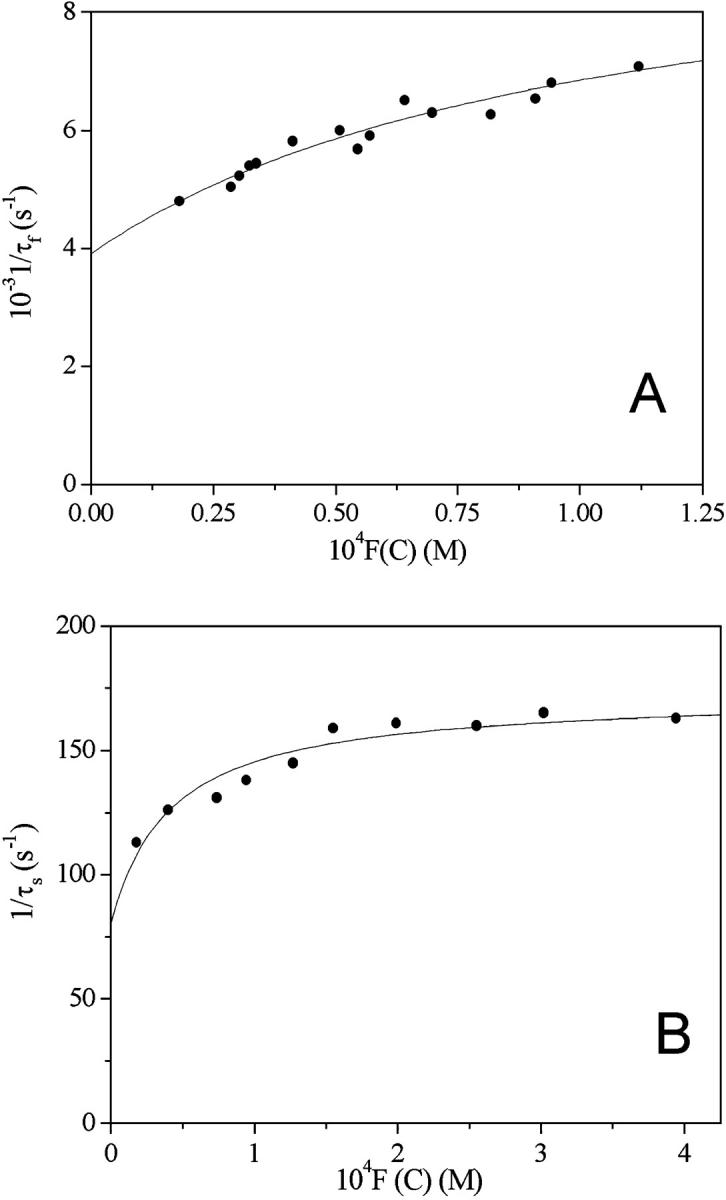
Dependence of the reciprocal relaxation times on the concentration variable F(C) for the DNA/Cyan40 system at I = 0.1 M NaCl, pH = 7.0, T = 25°C. (A) Fast effect; (B) slow effect. The curved trend displayed by the fast effect indicates that this is composed by two steps at least.
FIGURE 11.
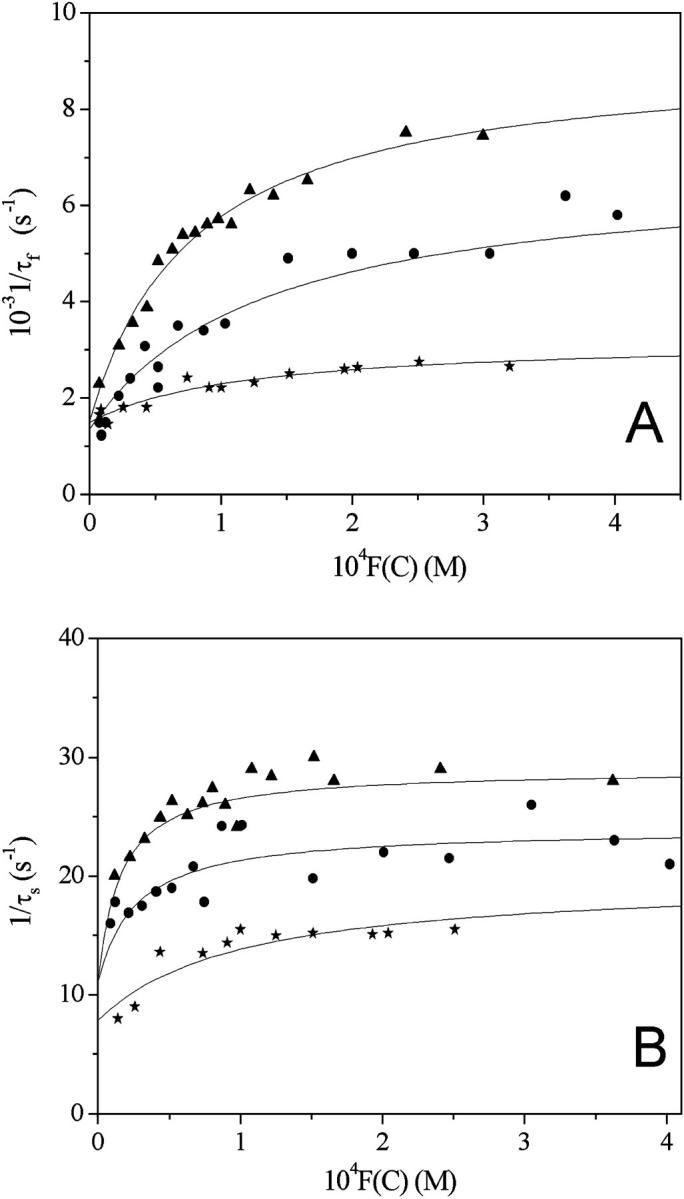
Dependence of the reciprocal relaxation times on the concentration variable F(C) for the DNA/CCyan2 system at pH = 7.0, T = 25°C. (▴) I = 0.03 M, (•) I = 0.1 M, and (H) I = 0.3 M. (A) Fast effect; (B) slow effect. The curved trend of the fast effect indicates that this is composed by two steps at least.
The kinetic behavior agrees with the three-step series mechanism below,
 |
(6) |
where S and D are the free sites and free dye respectively, whereas D,S, DSI, and DSII are conformationally different complexes. Data have been fitted to Eqs. 7 and 8,
 |
(7) |
and
 |
(8) |
where
 |
The curved concentration dependence of 1/τf observed for both systems (Figs. 10 A and 11 A) indicates that the fast effect is composed by two series steps, the first of them being too fast to be kinetically measured. However, fit to Eq. 7 enabled us to evaluate the equilibrium constant, K0, of this very fast step which, according to Eq. 6, corresponds to formation of the complex D,S.
The values of the reaction parameters obtained at 25°C and I = 0.1 M are collected in Table 1.
The salt effect on the kinetics of dye-site interaction has been investigated for the DNA/CCyan2 system. Fig. 11, A and B, show the dependence of 1/τf and 1/τs on the NaCl concentration. The values of the reaction parameters are collected in Table 2.
Melting curves
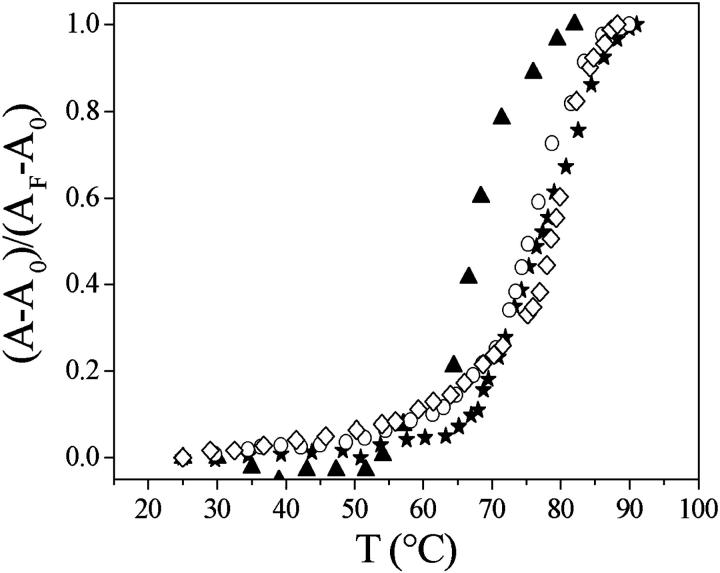
Fig. 12 shows the melting curves of free DNA and of DNA saturated with Cyan40, CCyan2, and with proflavine. The figure shows that free DNA melts at 68°C, DNA/Cyan40 at 76°C, DNA/CCyan2 at 78°C, and DNA/proflavine at 80°C.
FIGURE 12.
Melting curves of (▴) DNA; (★) DNA/CCyan2 (ΔT = 10°C); (○) DNA/Cyan40 (ΔT = 8°C); and (⋄) DNA/proflavine (ΔT = 12°C). I = 0.013 M (NaCl), λ = 260 nm, pH = 7.0.
Interaction with synthetic polynucleotides
The binding affinities of both Cyan40 and CCyan2 for poly(dA-dT)·poly(dA-dT) and poly(dG-dC)·poly(dG-dC) have been measured under the same experimental conditions and with the same method used for the CT-DNA studies. The values of the equilibrium parameters, collected in Table 3, show that CCyan2 displays a remarkable selectivity toward G-C sequences, whereas Cyan40 is less selective.
TABLE 3.
Overall equilibrium constants of complex formation between the cyanine dyes Cyan40 and CCyan2 and different polynucleotides (I = 0.1 M NaCl, pH = 7.0, T = 25°C)
| Cyan40
|
CCyan2
|
|
|---|---|---|
| 10−4K (M−1) | 10−4K (M−1) | |
| Poly(dA-dT)·poly(dA-dT) | 2.3 ± 0.4 | 1.6 ± 0.2 |
| Poly(dG-dC)·poly(dG-dC) | 4.9 ± 0.2 | 16.5 ± 0.1 |
| CT-DNA | 2.4 ± 0.3 | 6.8 ± 0.2 |
DISCUSSION
It has been shown that both Cyan40 and CCyan2 undergo self-aggregation in aqueous media, CCyan2 being much more effective than Cyan40. The difference could be ascribed to the more extended planarity of the structure of CCyan2 compared to that of Cyan40. Actually, the latter dye contains more methyl groups that hinder dye-dye overlapping (Fig. 1). Concerning CCyan2, the hypsochromically shifted band found can be related to H-aggregation of the monomer dye (47), which is to face-to-face aggregation with extensive π-stacking between monomers. The extended, planar (even if twisted) molecular configuration of CCyan2 allows these co-facial, with little offset, structures to be stabilized. By contrast, aggregated structures with large offset (J-aggregates) would have produced a bathochromic effect (47).
The equilibrium constant value for CCyan2 dimerization derived from kinetics (KD = 2.1 × 10³ M−1) is similar to that found for other dyes of the cyanine family (48). It should be noted that the dimerization model (Eq. 1) provides a simplified representation of the self-association process of CCyan2. Actually, the principal component analysis (29) of the spectra of Fig. 2 A enabled us to detect the presence of a third component. However, its contribution to the global spectral behavior was found to be insignificant and it has been neglected. On the basis of the KD value, it has been calculated that, for CD = 1 × 10⁻⁶ M, the dimer fraction is 0.2% only at I = 0.1 M and 0.7% at I = 1 M. The latter value has been obtained by using for KD at I = 1 M the value of 7.2 × 10³ M−1, calculated with the help of the Davies equation with B = 0.3. Therefore, we can ensure that kinetic data obtained for DNA/cyanine systems are related to the dye monomer/polynucleotide interaction only. Concerning the DNA/Cyan40 system, titrations made in the absorbance mode (high dye concentration) and in the fluorescence mode (low dye concentration) gave the same result, thus proving the negligible influence of the possible presence of small amounts of dimer.
Both cyanine dyes have shown to interact with DNA, forming stable complexes with overall binding constant, K, of the order of magnitude of 104 M−1, in agreement with the constants measured for other cyanines (25). The dependence of K on salt concentration indicates that the electrostatic contribution to the binding is in keeping with the Manning-Record theory (45,46). The slopes of the plots of Fig. 8 are m′ψ = 1.1 for DNA/Cyan40 and m′ψ = 0.86 for DNA/CCyan2; the difference suggests that the positive charge is more delocalized in the case of CCyan2.
The remaining contribution to the binding process is primary due to intercalation. This mode of binding was proved for CCyan2 (25): the fluorescence quenching constant was found to be ∼10 times less than expected for groove binding; moreover, linear dichroism experiments showed that the dye is oriented perpendicular to the helix axis. Concerning Cyan40, a model was proposed where one heterocycle is intercalated and the remaining stays in the groove (21). The intercalative model is also supported by the present experiments, namely:
The site size, derived by the analysis of the binding isotherms, is 2, in agreement with the excluded site model.
The reaction enthalpies, −5.3 kcal mol−1 for DNA/Cyan40 and −4.3 kcal mol−1 for DNA/CCyan2, are in fair agreement with the values found for the intercalation of proflavine into DNA (−5.9 kcal mol−1) (42).
The melting temperature displacements (Fig. 12) are similar to that produced by proflavine intercalation (the larger ΔTm value found for CCyan2 is in agreement with the greater affinity of this dye for DNA as shown in Table 1).
The bathochromic shifts exhibited by the absorbance spectra during titration (Fig. 5) are not in contrast with intercalation (37).
Concerning the kinetics, the direct transfer mechanism proposed for the DNA/ethidium (49) was discarded since this requires that the plot of (1/τf × 1/τs) versus F(C) would display a parabolic trend, contrary to our findings. The alternative mechanism depicted in Scheme 1, below, where DSI and DSII are mutually exclusive, could in principle be operative.
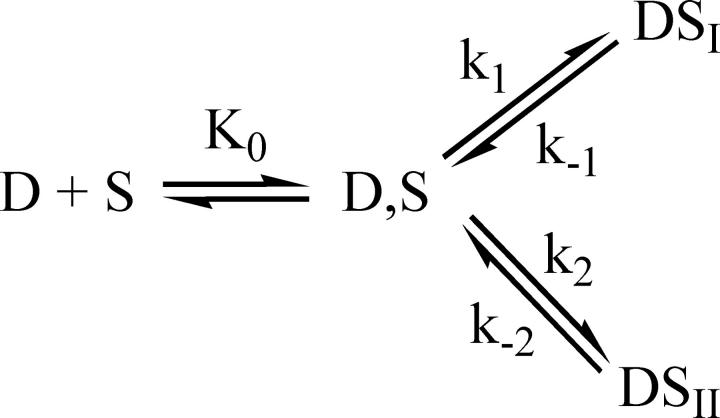 |
(9) |
Eq. 7, which in the series mechanism is associated to the fast effect, also applies to this branched mechanism. On the other hand, concerning the slow effect associated to Eq. 8, Kf in the numerator must now be replaced by K0, but the form of the equation remains unchanged. Therefore, the branched mechanism could not be kinetically distinguished from our series mechanism.
However, we are in favor of the latter after having considered the following possibilities:
DSI is intercalated in A-T and DSII is intercalated in G-C. Then, in the poly(dG-dC)·poly(dG-dC)/cyanine system, only one relaxation effect should be observed. Experiments in progress in our laboratory show that this is not the case, since two effects are clearly observed in the poly(dG-dC)·poly(dG-dC)/CCyan2 system.
Intercalation in DSI involves one of the two functionalities of the cyanine and intercalation in DSII involves the other functionality. In this case CCyan2, with two identical functionalities, should display only one effect, contrary to experiment.
DSI intercalates crossing one groove and DSII intercalates crossing the other groove. Suppose that the two processes require different activation energies, so two effects are observed. This could be possible for large molecules but less probable for small dyes as our cyanines. Further, two effects are observed also for intercalation of proflavine into poly(A)·poly(A) where only one groove is present (31).
Therefore, the most probable is that DSI and DSII differ by the extent of intercalation. Since the intercalation process involves a structural change of the polynucleotide, one has to postulate some intermediate complex between the free dye and the fully intercalated state, to allow time for the structural reorganization to occur (50). This is the series mechanism.
The values of K0 (Table 1) are higher than those found for the DNA/ethidium (51), poly(A)·poly(A)/proflavine (31) and poly(A)·poly(U)/proflavine (52) systems: this could be ascribed to additional interactions, established very rapidly so that their relaxation parameters cannot be measured under the concentration conditions of our T-jump experiments. These could be partially of electronic nature, since the sulfur-containing dye, thionine, is known to bind to AMP more strongly than proflavine (53). Extensive dye-groove interactions could not be present in D,S, otherwise the value of K0 would be orders-of-magnitude above the experimental one (54). Dye-dye interaction of the outside bound ligand should also be excluded, because of the high polymer/dye ratio.
Concerning the step D,S ⇆ DSI, one observes that the values of k1 are similar for the two ligands, as the values of k−1. This means that the interconversion D,S ⇆ DSI should have similar kinetic features. The intercalation of the common benzothioazole residue satisfies this condition. In the last step, DSI ⇆ DSII, it turns out that both k2 and k−2 for DNA/CCyan2 are lower by one order of magnitude as compared with DNA/Cyan40. If the assumption holds that DSI and DSII differ for the extent of intercalation, the different behavior of the two systems could be explained in two ways:
In DSI only the common benzothioazole residue is intercalated, whereas in DSII the entire dye molecule is allocated within basepairs.
The transition involves further accommodation of the benzothioazole residue into the polymer cavities, whereas the remaining residue stays outside, possibly undergoing groove-interaction.
Both the activation modes require a higher energy expense for the larger CCyan2 molecule, as reflected in the reduced value of k2. On the other hand, the larger extension of the aromatic system of this dye stabilizes the DSII structure, causing a reduction of k−2 for CCyan2, compared to that of Cyan40, where the half-intercalation model (2, above) seems to be favored (21).
The rate constants for dissociation of CCyan2 do not depend significantly on salt concentration, as already observed for the dissociation rate constants of the DNA/ethidium system (55). This could be explained on the assumption that dye intercalation plays a major role in the binding process. In such a case, the dissociation process should be independent of the counterion concentration. Actually, a scarce salt dependence of the dissociation rates has been found for other monovalent and divalent cyanine-intercalators as BO+ and BO-PRO2+ (23). In contrast, the kinetics of dissociation of monovalent dyes that undergo only groove binding exhibit positive salt effects, as shown in the case of BEBO+ and BOXTO+, where plots of log kd versus −log[Na+] yield negative slopes (23).
SUPPLEMENTARY MATERIAL
An online supplement to this article can be found by visiting BJ Online at http://www.biophysj.org.
Supplementary Material
Acknowledgments
This work has been supported by Fondazione Cassa di Risparmio di Pisa.
References
- 1.West, W., and P. B. Gilman. 1977. Spectral sensitivity and the mechanism of spectral sensitization. In The Theory of Photographic Process, 4th Ed. T.H. James, editor. Macmillan, NY. 251–290.
- 2.Rye, H. S., S. Yue, D. E. Wemmer, M. A. Quesada, R. P. Haugland, R. A. Mathies, and A. N. Glazer. 1992. Stable fluorescent complexes of double-stranded DNA with bis-intercalating asymmetric cyanine dyes: properties and applications. Nucleic Acids Res. 20:2803–2812. [DOI] [PMC free article] [PubMed] [Google Scholar]
- 3.Haughland, R. 1996. Molecular probes. In Handbook of Fluorescent Probes and Research Chemicals, 6th Ed. Molecular Probes, Eugene, OR.
- 4.Deligeorgiev, T. G. 1998. Molecular probes based on cyanine dyes for nucleic acid research. In Near-Infrared Dyes for High Technology Applications. S. Daehne, U. Resch-Genger, and O.S. Wolfbeis, editors. NATO ASI Series, Kluwer, Dordrecht. 125.
- 5.Goodwin, P. M., M. E. Johnson, J. C. Martin, W. P. Ambrose, B. L. Marrone, J. H. Jett, and R. A. Keller. 1993. Rapid sizing of individual fluorescently stained DNA fragments by flow-cytometry. Nucleic Acids Res. 21:803–806. [DOI] [PMC free article] [PubMed] [Google Scholar]
- 6.Castro, A., F. R. Fairfield, and E. B. Shera. 1993. Fluorescence detection and size measurement of single DNA molecules. Anal. Chem. 65:849–852. [Google Scholar]
- 7.Schwartz, D. C., X. Li, L. I. Hernandez, S. P. Ramnarain, E. J. Huff, and Y. K. Wang. 1993. Ordered restriction maps of Saccharomyces cerevisiae chromosomes constructed by optical mapping. Science. 262:110–114. [DOI] [PubMed] [Google Scholar]
- 8.Cai, W., H. Aburatani, V. P. Stanton, Jr., D. E. Housman, Y. K. Whang, and D. C. Schwatz. 1995. Ordered restriction endonuclease maps of yeast artificial chromosomes created by optical mapping on surfaces. Proc. Natl. Acad. Sci. USA. 92:5164–5168. [DOI] [PMC free article] [PubMed] [Google Scholar]
- 9.Guerrieri, S., I. D. Johnson, C. Bustamante, and K. S. Wells. 1997. Direct visualization of individual DNA molecules by fluorescence microscopy: characterization of the factors affecting signal/background and optimization of imaging conditions using YOYO. Anal. Biochem. 249:44–53. [DOI] [PubMed] [Google Scholar]
- 10.Clegg, R. M., A. I. Murchie, A. Zechel, C. Carlberg, S. Diekmann, and D. M. Lilley. 1992. Fluorescence resonance energy transfer analysis of the structure of the four-way DNA junction. Biochemistry. 31:4846–4856. [DOI] [PubMed] [Google Scholar]
- 11.Norman, D. G., R. J. Grainger, D. Uhrin, and D. M. Lilley. 2000. Location of cyanine-3 on double-stranded DNA: importance for fluorescence resonance energy transfer studies. Biochemistry. 39:6317–6324. [DOI] [PubMed] [Google Scholar]
- 12.Mortensen, B., and M. Chui. 2002. Fluorescein-cyanine 5 as a fluorescence resonance energy transfer pair for assays. U.S. Pat. Appl. Publ. 16.
- 13.Zhu, H., S. M. Clark, S. C. Benson, H. S. Rye, A. N. Glazer, and R. A. Mathies. 1994. High-sensitivity capillary electrophoresis of double-stranded DNA fragments using monomeric and dimeric fluorescent intercalating dyes. Anal. Chem. 66:1941–1948. [DOI] [PubMed] [Google Scholar]
- 14.Schwartz, H. E., and K. J. Ulfelder. 1992. Capillary electrophoresis with laser-induced fluorescence detection of PCR fragments using thiazole orange. Anal. Chem. 64:1737–1740. [Google Scholar]
- 15.Bengtsson, M., H. J. Karlsson, G. Westman, and M. Kubista. 2003. A new minor groove binding asymmetric cyanine reporter dye for real-time PCR. Nucleic Acids Res. 31:e45/1–e45/5. [DOI] [PMC free article] [PubMed] [Google Scholar]
- 16.Hirons, G. T., J. J. Fawcett, and H. A. Crissman. 1994. TOTO and YOYO: new very bright fluorochromes for DNA content analyses by flow cytometry. Cytometry. 15:129–140. [DOI] [PubMed] [Google Scholar]
- 17.Kurihara, K., Y. Toyoshima, and M. Sukigara. 1977. Phase transition and dye aggregation in phospholipid-amphiphilic dye liposome bilayers. J. Phys. Chem. 81:1833–1837. [Google Scholar]
- 18.Armitage, B., and D. F. O'Brien. 1992. Vectorial photoinduced electron transfer between phospholipid membrane-bound donors and acceptors. J. Am. Chem. Soc. 114:7396–7403. [Google Scholar]
- 19.Reers, M., T. W. Smith, and L. B. Chen. 1991. J-aggregate formation of a carbocyanine as a quantitative fluorescent indicator of membrane potential. Biochemistry. 30:4480–4486. [DOI] [PubMed] [Google Scholar]
- 20.Timcheva, I. I., V. A. Maximova, T. G. Deligeorgiev, N. I. Gadjev, R. W. Sabnis, and I. G. Ivanov. 1997. Fluorescence spectral characteristics of novel asymmetric monomethine cyanine dyes in nucleic acid solutions. FEBS Lett. 405:141–144. [DOI] [PubMed] [Google Scholar]
- 21.Yarmoluk, S. M., S. S. Lukashov, M. Y. Ogul'chausky, M. Y. Losytskyy, and O. S. Kornyushyna. 2001. Interaction of cyanine dyes with nucleic acids. XXI. Arguments for half–intercalation model of interaction. Biopolymers. 62:219–227. [DOI] [PubMed] [Google Scholar]
- 22.Karlsson, H. J., M. Eriksson, E. Pezon, B. Akerman, P. Lincoln, and G. Westman. 2003. Groove-binding unsymmetrical cyanine dyes for staining of DNA: syntheses and characterization of the DNA-binding. Nucleic Acids Res. 31:6227–6234. [DOI] [PMC free article] [PubMed] [Google Scholar]
- 23.Eriksson, M., H. J. Karlsson, G. Westman, and B. Åkerman. 2003. Groove-binding unsymmetrical cyanine dyes for staining of DNA: dissociation rates in free solution and electrophoresis gels. Nucleic Acids Res. 31:6235–6242. [DOI] [PMC free article] [PubMed] [Google Scholar]
- 24.Lukashov, S. S., M. Yu. Losytskyy, Y. Lu. Slominskii, and S. M. Yarmoluk. 2001. Interaction of cyanine dyes with nucleic acids. VII. Carbocyanine dyes, substituted in polymethine chain, as possible probes for fluorescent nucleic acid detection. Biopolym. Cell. 17:169–177. [Google Scholar]
- 25.Yarmoluk, S. M., S. S. Lukashov, M. Y. Losytskyy, B. Akerman, and O. S. Kornyushyna. 2002. Interaction of cyanine dyes with nucleic acids. XXVI. Intercalation of trimethine cyanine dye Cyan2 into double-stranded DNA: study by spectral luminescence methods. Spectrochim. Acta [A]. 58:3223–3232. [DOI] [PubMed] [Google Scholar]
- 26.Müller, W., and D. M. Crothers. 1968. Studies of the binding of actinomycin and related compounds to DNA. J. Mol. Biol. 35:251–290. [DOI] [PubMed] [Google Scholar]
- 27.Schmechel, D. E. V., and D. M. Crothers. 1971. Kinetic and hydrodynamic studies of the complex of proflavine with poly(A)·poly(U). Biopolymers. 10:465–480. [DOI] [PubMed] [Google Scholar]
- 28.Lacowicz, J. R. 1999. Principle of Fluorescence Spectroscopy, 2nd Ed. Kluver Academic-Plenum Publishers, New York.
- 29.Kubista, M., R. Sjöback, and B. Albinsson. 1993. Determination of equilibrium constants by chemometric analysis of spectroscopic data. Anal. Chem. 65:994–998. [Google Scholar]
- 30.Riegler, R., C. B. Rabl, and T. M. Jovin. 1974. A temperature-jump apparatus for fluorescence measurements. Rev. Sci. Instrum. 45:580–588. [Google Scholar]
- 31.Ciatto, C., M. L. D'Amico, G. Natile, F. Secco, and M. Venturini. 1999. Intercalation of proflavine and a platinum derivative of proflavine into double-helical poly(A). Biophys. J. 77:2717–2724. [DOI] [PMC free article] [PubMed] [Google Scholar]
- 32.Provencher, S. W. 1976. An Eigen function expansion method for the analysis of exponential decay curves. J. Chem. Phys. 64:2772–2777. [Google Scholar]
- 33.West, W., and S. Pearce. 1965. The dimeric state of cyanine dyes. J. Phys. Chem. 69:1894–1903. [Google Scholar]
- 34.Herz, A. H. 1973. Dye-dye interactions of cyanines in solution and at silver bromide surfaces. Photogr. Sci. Eng. 18:323–335. [Google Scholar]
- 35.Nygren, J., N. Svanvik, and M. Kubista. 1998. The interaction between the fluorescent dye thiazole orange and DNA. Biopolymers. 46:39–51. [DOI] [PubMed] [Google Scholar]
- 36.Yarmoluk, S. M., V. B. Kovalska, S. S. Lukashov, and Y. L. Slominskiin. 1999. Interaction of cyanine dyes with nucleic acids. XII. β-substituted carbocyanines as possible fluorescent probes for nucleic acids detection. Bioorg. Med. Chem. Lett. 9:1677–1678. [DOI] [PubMed] [Google Scholar]
- 37.Pasternack, R. F., and E. J. Gibbs. 1996. Porphyrin and metalloporphyrin interaction with nucleic acids. In Metal Ions in Biological Systems, Vol. 33. A. Sigel and H. Sigel, editors. Marcel Dekker, New York. [PubMed]
- 38.D'Amico, M. L., V. Paiotta, F. Secco, and M. Venturini. 2002. A kinetic study of the intercalation of ethidium bromide into poly(A)·poly(U). J. Phys. Chem. B. 106:12635–12641. [Google Scholar]
- 39.McGhee, J. D., and P. H. von Hippel. 1974. Theoretical aspects of DNA-protein interaction: cooperative and non-cooperative binding of large ligands to one-dimensional homogeneous lattice. J. Mol. Biol. 86:469–489. [DOI] [PubMed] [Google Scholar]
- 40.Jovin, T. M., and G. Striker. 1977. Chemical relaxation kinetic studies of E. coli RNA polymerase binding to poly[d(A-T)] using ethidium bromide as a fluorescence probe. Mol. Biol. Biochem. Biophys. 24:245–281. [DOI] [PubMed] [Google Scholar]
- 41.Zimmermann, H. W. 1986. Physicochemical and cytochemical investigations on the binding of ethidium and acridine dyes to DNA and to organelles in living cells. Angew. Chem. Int. Ed. 25:115–130. [Google Scholar]
- 42.Biver, T., F. Secco, M. R. Tinè, and M. Venturini. 2003. Equilibria and kinetics of the intercalation of Pt-proflavine and proflavine into calf thymus DNA. Arch. Biochem. Biophys. 418:63–70. [DOI] [PubMed] [Google Scholar]
- 43.Scatchard, G. 1949. The attraction of proteins for small molecules and ions. Ann. N. Y. Acad. Sci. 51:660–672. [Google Scholar]
- 44.Peacocke, A. R., and J. N. H. Skerret. 1956. The intercalation of aminoacridines with nucleic acids. Q. Rev. Biophys. 25:51–54. [Google Scholar]
- 45.Record, M. T., T. M. Lohaman, and P. De Haseth. 1976. Ion effects on ligand-nucleic acid interactions. J. Mol. Biol. 107:145–158. [DOI] [PubMed] [Google Scholar]
- 46.Record, M. T., C. F. Jr. Anderson, and T. M. Lohaman. 1978. Thermodynamic analysis of ion effects on the binding and conformational equilibriums of proteins and nucleic acids: the roles of ion association of release, screening, and ion effects on water activity. Q. Rev. Biophys. 11:103–178. [DOI] [PubMed] [Google Scholar]
- 47.Miaomiao, W., G. L. Silva, and B. A. Armitage. 2000. DNA-template formation of a helical cyanine dye J-aggregate. J. Am. Chem. Soc. 122:9977–9986. [Google Scholar]
- 48.Petty, J. T., J. A. Bordelon, and M. E. Robertson. 2000. Thermodynamic characterization of the association of cyanine dyes with DNA. J. Phys. Chem. B. 104:7221–7227. [Google Scholar]
- 49.Bresloff, J. L., and D. Crothers. 1975. DNA-ethidium reaction kinetics: demonstration of direct ligand transfer between DNA binding sites. J. Mol. Biol. 95:103–123. [DOI] [PubMed] [Google Scholar]
- 50.Li, H. J., and D. M. Crothers. 1969. Relaxation studies of the proflavine-DNA complex: the kinetics of an intercalation reaction. J. Mol. Biol. 39:461–477. [DOI] [PubMed] [Google Scholar]
- 51.Meyer-Almes, F. J., and D. Pörschke. 1993. The mechanism of intercalation into the DNA double helix by ethidium. Biochemistry. 32:4246–4253. [DOI] [PubMed] [Google Scholar]
- 52.Biver, T., F. Secco, and M. Venturini. 2005. Relaxation kinetics of the interaction between RNA and metal-intercalators: the poly(A)·poly(U)/platinum-proflavine system. Arch. Biochem. Biophys. 437:215–223. [DOI] [PubMed] [Google Scholar]
- 53.Sharples, D., and J. R. Brown. 1976. Correlation of the base specificity of DNA-intercalating ligands with their physico-chemical properties. FEBS Lett. 69:37–40. [DOI] [PubMed] [Google Scholar]
- 54.Breusegem, S. Y., R. M. Clegg, and F. G. Loontiens. 2002. Base-sequence specificity of Hoechst 33258 and DAPI binding to five (A/T)4 DNA sites with kinetic evidence for more than one high-affinity Hoechst 33258-AATT complex. J. Mol. Biol. 315:1049–1061. [DOI] [PubMed] [Google Scholar]
- 55.Wilson, W. D., C. R. Krishnamoorthy, Y. H. Whang, and J. C. Smith. 1985. Mechanism of intercalation: ion effects on the equilibrium and kinetic constants for the interaction of propidium and ethidium with DNA. Biopolymers. 24:1941–1961. [DOI] [PubMed] [Google Scholar]
Associated Data
This section collects any data citations, data availability statements, or supplementary materials included in this article.


