

Abstract
Phot proteins are homologs of the blue-light receptor phototropin. We report a comparative study of the photocycles of the isolated, light-sensitive domains LOV1 and LOV2 from Chlamydomonas reinhardtii phot protein, as well as the construct LOV1/2 containing both domains. Transient absorption measurements revealed a short lifetime of the LOV2-wt triplet state (500 ns), but a long lifetime (287 μs) of the triplet in the mutant LOV2-C250S, in which the reactive cysteine is replaced by serine. For LOV1, in comparison, corresponding numbers of 800 ns and 4 μs for the two conformers in LOV1-wt, and 27 μs for LOV1-C57S have been reported. The triplet decay kinetics in the mixed domains LOV1/2-wt, LOV1/2-C57S, and LOV1/2-C250S can be analyzed as the superposition of the behavior of the corresponding single domains. The situation is different for the slow, thermal reaction of the photoadduct back to the dark form. Whereas the individual domains LOV1 and LOV2 show two decay components, the double domains LOV1/2-C57S and LOV1/2-C250S both show only a single component. The interaction of the two domains does therefore not manifest itself during the lifetime of the triplet states, but changes the decay behavior of the adduct states.
INTRODUCTION
Blue-light sensitive photoreceptors that control crucial biological processes are under intensive study in many laboratories (1–8). Important blue-light receptor groups are photolyases (9), cryptochromes (2,4), BLUF-domain containing proteins (7), which all contain flavin adenine dinucleotide as chromophore, and phototropins (phot) with flavin mononucleotide (FMN) as the chromophoric molecule (5).
The phototropins and homologs (phot) are involved in phototropism (plant growth toward the light source) (10), chloroplast movement (11), stomatal opening (12), rapid inhibition of stem growth (13), and gametogenesis (sexual differentiation) (14). Phototropins comprise two blue-light-sensitive domains, LOV1 and LOV2 (LOV: light-, oxygen-, and voltage-sensitive) and a C-terminal serine-threonine protein kinase domain. Upon illumination, LOV domains undergo a photocycle comprising a triplet-state LOV-715 and a second-intermediate LOV-390, the latter reconverting to the LOV dark form within many seconds to minutes (15,16). LOV-390 contains FMN covalently connected to the thiol group of the reactive cysteine via the C(4a) position of the isoalloxazine ring (17–20).
The mechanism of formation of this covalent adduct is still under debate. Based on results from ultrafast spectroscopy it was suggested that H+ transfer from the thiol group to the N(5) position leads to a protonated triplet excited state that is subsequently attacked by the thiolate (21). However, theoretical studies on a model system using an ab initio formalism showed that a radical mechanism via transfer of a hydrogen atom from the cysteine to the flavin is energetically favored (22). The preference of an electron over a proton transfer mechanism was supported by studies on an LOV1 mutant, in which the reactive cysteine was replaced by methionine (23,24). Likewise, time-resolved EPR measurements on several LOV domains lead to the conclusion that a radical pair mechanism is dominating the pathway from the triplet state to the adduct under most reaction conditions (25,26). In Phot-LOV1 from Chlamydomonas reinhardtii the thiol group is present in two conformations with different distances of the cysteine thiol to the FMN-C4(a) (20). It is still under debate which of them is more reactive (27).
LOV domains do not undergo major conformational changes upon illumination, as was shown by x-ray crystallography on LOV2 from Adiantum phytochrome 3 (19), as well as by crystallographic and Fourier transform infrared studies on LOV1 from Chlamydomonas Phot (20,28). However, Harper et. al. (29) have found by NMR spectroscopy that a short α-helix of ∼20 residues that connects LOV2 with the kinase associates with the LOV2 core in darkness but not in the light. How the photoreactions of LOV2 and possibly also of LOV1 influence that interaction is still not known.
Little is known about the direct interaction of the two domains LOV1 and LOV2. In phot proteins from higher plants the domains are connected by a linker of ∼150–180 residues. Fluorescence measurements on LOV domains from several plant species showed that the decay kinetics of LOV-390 in peptides containing both LOV domains is slower than in those with isolated domains (30). Moreover, the data obtained from the tandem LOV domain proteins closely resemble those from the full-length proteins, indicating a relevant interaction between the two domains. From a similar study on phototropin 2 from the fern Adiantum capillus-veneris, the authors suggested that LOV1 reduces the lifetime of the LOV1/2 signal to limit the physiological response at high light levels (31).
Here we present absorption spectroscopic studies on LOV2 and LOV1/LOV2 doublets from C. reinhardtii phot on a timescale ranging from 100 ns to minutes after light stimulation. We show how the individual LOV domains influence each other with respect to adduct formation and decay and how they are influenced by ion concentration and pH of the medium.
MATERIALS AND METHODS
Expression and purification
Originally the LOV1-encoding gene fragment (amino acids 16–133) from the full-length cDNA clone (accession No: AV 394090) of the C. reinhardtii phot was inserted in frame to the His-tag sequence of His-pMALc2x (modified pMALc2x from New England Biolabs, Frankfurt, Germany). The MBP-encoding segment was excised and the resulting vector was named LOV1-His-p2x, carrying 15 His at the N-terminus end (final molecular weight (MW) 15174.15). LOV1 was excised with EcoRI/HindIII and replaced by LOV2 (amino acids 199–336, final MW of the protein 17393.48) or LOV1/2 (amino acids 16–336, MW of the protein 36738.54), both amplified by PCR from the cDNA. Replacement of cysteine 57 or cysteine 250 by serine was done by site-directed mutagenesis according to standard protocols. Proteins were expressed in Escherichia coli strain BL21 (DE3) and purified via Ni-NTA resins according to the instructions of the supplier (Qiagen, Hilden, Germany). LOV2-C250S was cloned into His-pMALc2x and purified as maltose-binding fusion protein (MW 66819) on Amylose resin (NEB, Frankfurt, Germany) according to instructions of the supplier. The LOV proteins were diluted in 10 mM phosphate buffer, pH 8, 10 mM NaCl, 100 μM phenylmethanesulfonyl fluoride.
Ultraviolet/Vis spectra and dependence of slow kinetics on pH and NaCl
The absorption spectra were recorded with a Lambda 9 spectrophotometer (Perkin Elmer, Frankfurt, Germany). For slow kinetics, the samples were kept in a rectangular (10 × 2 mm) cuvette and irradiated for 60 s with a 50-W tungsten lamp (Osram, München, Germany) through a 435 nm cutoff filter (GG435, Schott, Mainz, Germany). The time traces were recorded at 475 nm in the dark. During the process, the temperature was maintained at 20°C. Samples with different pH values and salt concentrations were obtained by adding 1 M potassium phosphate buffer and 1 M sodium chloride solutions to the standard samples.
Replacement of sodium and chloride by different cations and anions
The samples were dialyzed against a 10-mM potassium phosphate buffer, pH 4.7. Potassium chloride, N-methylglucamine chloride, tetraethylammonium chloride, sodium perchlorate, and sodium phenylsulfonate were added as a 1-M solution to a final concentration of 100 mM. The pH changed only slightly by the addition.
Varying NaCl concentration at acidic pH
Starting from a 10-mM or 100-mM potassium phosphate buffer, pH 4.7, the NaCl concentration of the protein solution was varied from 5 to 600 mM by addition of 1 M NaCl. For each salt concentration a fresh sample was used.
Activation energy of the thermal reaction LOV-390 → LOV-447
For determination of the activation energy, the temperature was set within the range 20–30°C with an accuracy of 0.1°C. Time traces were recorded as described above.
Flash photolysis experiments
Experiments were performed with a setup described previously (16). In brief, the sample was excited at its maximum absorption around 447 nm wavelength by a light pulse of 15-ns duration and ∼1-mJ energy from a dye laser (Scanmate, Lambda Physik, Göttingen, Germany), which is pumped by the third harmonic of a Nd:YAG laser (SL-803, Spectron Laser Systems, Rugby, England). The transient absorption was measured along the 10-mm pathway perpendicular to the excitation using a pulsed 150-W Xe lamp (MSP-05, Müller, Moosinning, Germany). Two monochromators, one before and the other after the sample, were taken to select the wavelength and exclude fluorescence and stray light. The transmitted signal was detected by a photomultiplier (R446, Hamamatsu Photonics, Herrsching, Germany) and recorded by a 500-MHz digital storage oscilloscope (TDS 744A, Tektronix, Beaverton, OR) triggered by the excitation pulse via a photodiode. Each data set was created by taking four averaged traces in succession: the signal trace, the reference trace without laser, a fluorescence signal without measuring light pulse, and a baseline without both light sources. The temperature was always kept at 20°C.
RESULTS
To obtain information on the interaction of the two domains LOV1 and LOV2, the double-domain construct LOV1/2 was employed. In C. reinhardtii phot, the domains are separated by a linker region of 72 amino acids, which is ∼½ the length of the higher plant homologs (32). Two mutants, LOV1/2-C57S and LOV1/2-C250S, enabled us to clearly separate the light-induced processes in the two domains. In LOV1/2-C57S, the thiol group of the reactive cysteine in LOV1 was replaced by the nonreactive hydroxyl group of serine; in LOV1/2-C250S an analogous exchange was made in the LOV2 domain. Hence, in these mutants, adduct formation is selectively prevented in one of the two domains. For direct comparison, the behavior of the single LOV1 and LOV2 domains, as well as the LOV2-C250S mutant, was investigated. The LOV2-C250S mutant, the wild-type LOV2 used in flash photolysis, and the LOV1 domain used in the salt dependence were prepared with a HispMal fusion protein. All other domains contained a Hisp2x tag.
Absorption spectra
The absorption spectra of the three wild-type domains LOV1, LOV2, and LOV1/2 and the three mutants are shown in Fig. 1. The spectrum of LOV2-C250S contained an obvious contribution from scattering, which was corrected for by subtraction of a contribution proportional to λ−4. The absorption bands of all LOV domains are very similar: the S0 → S1 transition has the strongest peak in the range 443–447 nm, with additional vibronic maxima near 470 nm and 420 nm. The S0 → S2 transition appears as two vibronic bands of equal intensity with peak positions around 353 and 370 nm. Only a small shift of the main absorption peak is observed from 447 nm in LOV1 to 446 nm in LOV2, LOV1/2, and LOV1/2-C250S, to 444 nm in LOV1/2-C57S, and to 443 nm in LOV2-C250S. No further shifts were observed upon changing pH and salt conditions in our experiments.
FIGURE 1.

Absorption spectra of the investigated single and double LOV domain constructs. All samples include a His-Tag except the LOV2-C250S mutant (His-pMal). For a better comparison, the spectra are shifted vertically. Only minor differences in the spectra are visible.
Decay of the triplet excited state
After excitation of the LOV domains to the excited singlet state with blue light, intersystem crossing into the triplet excited state occurs. This process has been investigated by ultrafast spectroscopy (21,33). The triplet excited state has a strong absorption with two maxima at 650 (15) and 715 nm (16). To determine the decay kinetics of the triplet excited state, flash photolysis experiments were performed on a LOV2 domain connected to maltose binding protein (His-pMal) because this sample was better soluble than LOV2-His. In analogy to the LOV1 domain the triplet state of LOV2 is named LOV2-715 in this article. As depicted in Fig. 2 A, LOV2-715 decays with a single time constant of ∼500 ns. The fluorescence of the sample with a quantum yield of 7% (34) interferes with the data acquisition even at the detection wavelength of 710 nm due to an overload of the photomultiplier. Hence, the data in the first 100 ns are not accurate enough to permit a more detailed analysis of the decay.
FIGURE 2.
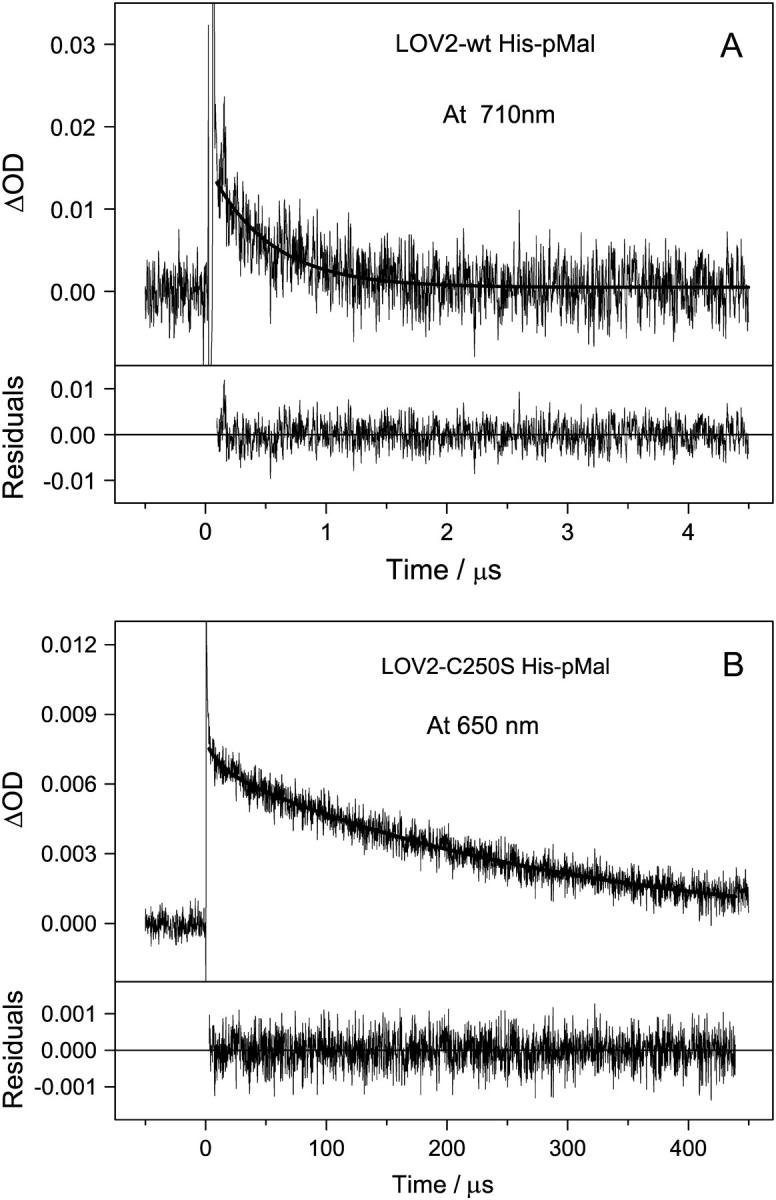
Decay time traces of triplet states of the wild-type LOV2 domain at 710 nm (A) and the mutant LOV2-C250S at 650 nm (B) after excitation with a blue laser pulse. Fitted curves are indicated by solid lines. (A) A monoexponential fit yields a time constant of 500 ns. (B) The biexponential decay is characterized by two time constants: τ1 = 12 μs (90%) and τ2 = 287 μs (10%).
In mutants of the LOV domains, where the reactive cysteine is replaced by alanine or serine, the lifetime of the triplet state increases significantly (15,16). In these mutants the adduct is not formed, hence the lifetime of the triplet state is limited by other processes like intersystem crossing into the ground state or quenching by oxygen. These processes should also take place in the wild-type and compete there with adduct formation. In the LOV2-C250S mutant (His-pMal), the lifetime of the triplet state is unusually long: The decay was monitored at a detection wavelength of 650 nm and could be fitted by a biexponential decay with two time constants of 12 (±3) μs and 287 (±13) μs (see Fig. 2 B). The long time constant contributes 90% to the amplitude of the decay. To exclude the presence of a radical species or a charge transfer complex at the measuring wavelength of 650 nm, the experiment was repeated with detection at 710 nm, where only the triplet state is expected to absorb. At this wavelength the signal/ noise ratio of our apparatus is smaller than at 650 nm. Taking this limitation into account, the decay times and amplitudes obtained from the data measured at 710 nm (not shown), 4 (±1) μs (35%) and 256 (±12) μs (65%), can be attributed to the same species observed at 650 nm.
In the double-domain constructs, the triplet-state lifetimes and the reaction rates for adduct formation in the excited domain might be affected by the presence of the second domain. The decay of the triplet excited state in the LOV1/2-C57S mutant (Hisp2x) was studied to investigate this influence. As one domain cannot be excited selectively due to the complete overlap of the absorption spectra of the two domains, a superposition of the two decay processes was observed. The decay process was fitted with a sum of three exponential functions resulting in time constants of 400 ns, 5 μs, and 30 μs (see Fig. 3 B). These values are close to those from the processes in the individual domains, which are 500 ns for wild-type LOV2 and 3 μs and 27 μs for the LOV1-C57S mutant (16). An analogous experiment was performed with the LOV1/2-C250S mutant (Hisp2x), where the adduct formation is inactivated in the LOV2 domain. In Fig. 3 A, the time trace is depicted together with a biexponential fit with time constants of 4 μs (21%) and 253 μs (79%). A second measurement with a shorter time window showed two time constants of 600 ns (82%) and 4 μs (18%) (data not shown). Taken together, these time constants are similar to a superposition of the decay processes of LOV2-C250S mutant (∼12 μs and ∼290 μs) and wild-type LOV1 (800 ns and 4 μs) (16). A summary of the triplet decay times is shown in Table 1.
FIGURE 3.
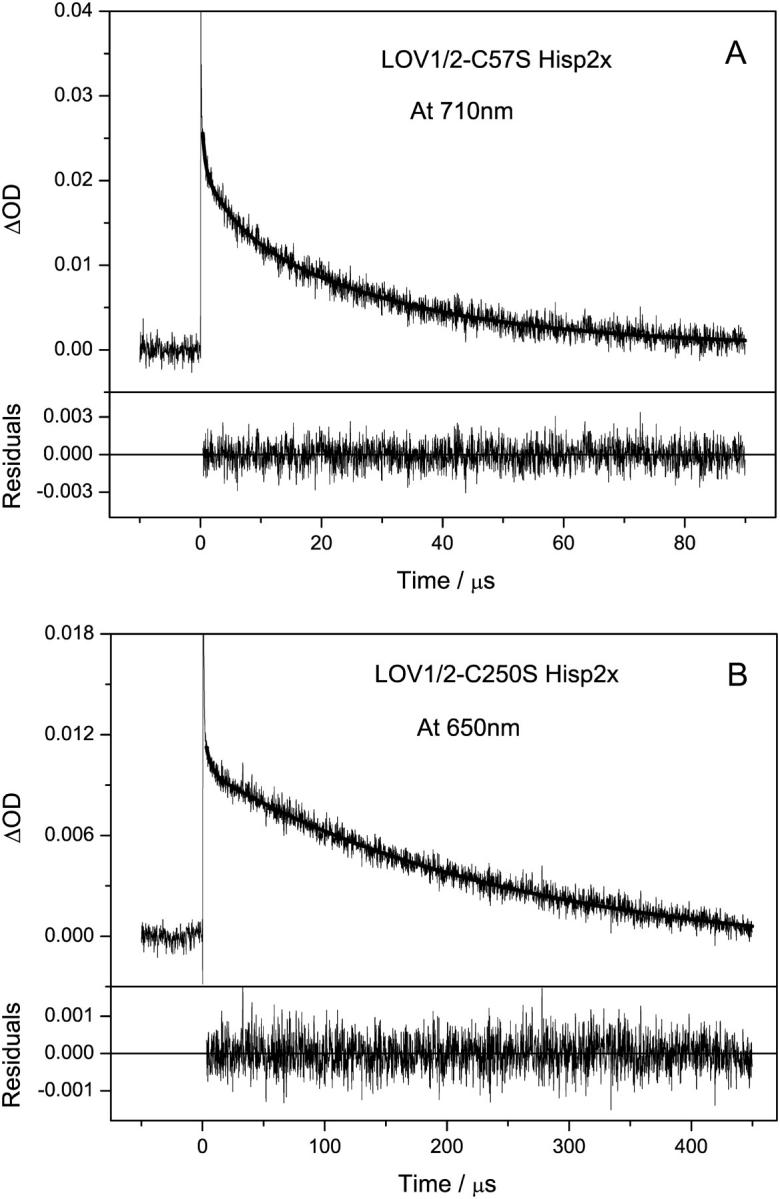
Decay time traces after excitation of the double domain constructs LOV1/2-C57S (A) and LOV1/2-C250S (B), where one domain was selectively inactivated by the mutation. For LOV1/2-C57S, three time constants were directly obtained with 400 ns (32%), 5 μs (19%), and 30 μs (49%). For LOV1/2-C250S, the fit yields decay time constants of 4 μs (21%) and 253 μs (79%).
TABLE 1.
Time constants of the triplet-state decay in the single and double LOV domains
| Species | Time constant τ1 (μs) | Time constant τ2 (μs) | Time constant τ3 (μs) |
|---|---|---|---|
| LOV2 | 0.5 | — | — |
| LOV2-C250S | — | 12 | 287 |
| LOV1/2-C250S | 0.6 | 4 | 253 |
| LOV1/2-C57S | 0.4 | 5 | 30 |
| LOV1* | 0.8 | 4 | — |
| LOV1-C57S* | — | 3 | 27 |
All samples were measured at pH 8, 10 mM NaCl, and 20°C.
Measurements taken from Kottke et al. (16).
Recovery kinetics of the adduct
The decay of the adduct LOV-390 in the dark was monitored by measuring the recovery of absorption of the dark form at 475 nm after irradiation of the sample with a tungsten lamp for 60 s. All samples were carrying a His-tag and were measured under identical conditions at pH 8 and 10 mM NaCl. In LOV2, the adduct decay cannot be fitted adequately by a monoexponential function. A biexponential fit produces two time constants of 30 s (25%) and 270 s (75%). In previous experiments, LOV2 in a His-pMal fusion protein also showed a biexponential adduct decay with two time constants of 41 s and 387 s (34), but the different temperatures and illumination conditions make a direct comparison difficult. In contrast, the time traces of both mutated double domains are fitted adequately by a monoexponential function. Motivated by this observation, we reinvestigated the adduct decay of the LOV1 domain, which was analyzed previously by a single-exponential decay yielding a time constant of 200 s (16). Indeed, a biexponential analysis revealed a small contribution (15%) of a fast-decay component also in LOV1, resulting in time constants of 45 and 320 s. All the time constants obtained are listed in Table 2.
TABLE 2.
Time constants of the adduct decay in the single and double LOV domains
| Species | Time constant τ1 (s) | Time constant τ2 (s) |
|---|---|---|
| LOV1 | 45 (15%) | 320 (85%) |
| LOV2 | 30 (25%) | 270 (75%) |
| LOV1/2 | 25 (30%) | 270 (70%) |
| LOV1/2-C250S | — | 260 |
| LOV1/2-C57S | 30 | — |
All samples were measured at pH 8, 10 mM NaCl, and 20°C. All domains were obtained from a Hisp2x construct.
Bleaching of the FMN absorption in LOV2 by blue light and ultraviolet light
Despite the large quantum yield of adduct formation in LOV2 (34), the absorption of the dark form cannot be bleached completely. Fig. 4 B shows the relative bleaching ΔA/A measured at 475 nm as a function of light intensity. The triangles represent the data obtained for the LOV2 domain by excitation with white light (tungsten lamp). In this case the dark form will be excited with higher probability than the adduct. Squares and circles refer to excitation with a high-pressure xenon lamp filtered through the combination of a UG11 and a WG280 filter (Schott). The transmission curve of this filter combination is shown in Fig. 4 A in comparison to the spectra of LOV-447 and LOV-390. Apparently both species are excited with similar probability in this spectral region. The relative intensity level 1 corresponds to the highest intensity that could be applied to the sample; lower intensities were set with neutral density filters. The curves in Fig. 4 B give the best fits of a model including a photochemical backreaction from the adduct to the dark form, which is presented in the Discussion section. Obviously the bleaching does not extrapolate to 100% in the limit of infinite light intensity. In addition, the bleaching was measured immediately after irradiation with a very strong blue light-emitting diode (LED; 1 W, 1 s), leading to ΔA/A = 0.91 for LOV1 and ΔA/A = 0.93 for LOV2. The spectrum of this LED light source with a center wavelength of 460 nm is also shown in Fig. 4 A.
FIGURE 4.

(A) Absorption spectra of the dark form and the adduct in relation to the transmission spectrum of the filter combination used for UV irradiation and the emission spectrum of the blue LED. (B) Bleaching ΔA/A of the absorption at 475 nm under the influence of blue light from a tungsten lamp (LOV2, triangles) and UV light in the range 280 – 390 nm (LOV1, squares, and LOV2, circles). The lines represent the best fits with equations (1) for LOV1 and (2) for LOV2.
pH effect on the adduct decay in LOV2 and LOV1/2-C57S
When the pH is lowered from 8.0 to 3.8 in the single LOV1 domain, the amplitude of the fast-decaying component declines to zero and the decay becomes monoexponential. The decay time increases from 280 s at pH 6.8 to 860 s at pH 3.8 (16). For LOV2-Hisp2x, however, two decay components are observed in the whole pH range 4.7–10.0. The amplitude of the fast component increases under acidic conditions, from 16% at physiological pH (7.5) to 38% at pH 4.3. The pH dependence of the two time constants of the biexponential decay are plotted in Fig. 5 A. Whereas the time constant of the faster decay is not affected, that of the slow decay increases by a factor of 3.5 in going from neutral to acidic conditions. In the range pH 7–10 it is almost constant. In contrast to LOV1, an increase of the NaCl concentration from 10 mM to 100 mM does not alter the pH dependence of the lifetimes. Due to release of the chromophore, LOV2 could not be studied at pH <4.7. Hence a second plateau in the pH dependence could not be observed. A reliable fit using an acid/base model (16) is not possible and only estimates can be obtained for the lifetime of the acidic form of the protein (τ > 1400 s) and the equilibrium constant (pKa ≈ 5–6). The corresponding theoretical curve is shown in Fig. 5 A.
FIGURE 5.
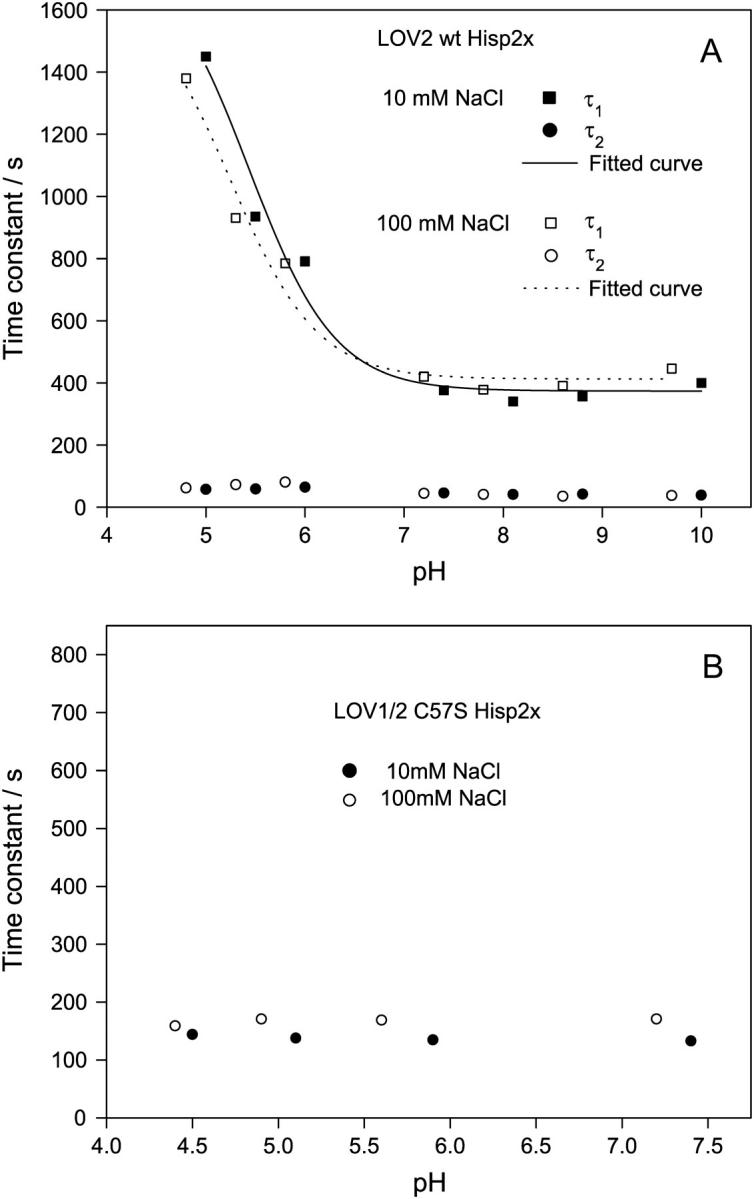
pH dependence of the time constants obtained from the adduct decay in the LOV2 domain at 10 and 100 mM NaCl concentration and 100 mM phosphate buffer. (A) The two time constants of the biexponential decay in the wild-type LOV2 are plotted separately. The fitted curves are derived from a simple acid/base model (16) and yield an estimated pKa between 5 and 6. (B) In the LOV1/2-C57S mutant, only the LOV2 domain is forming the adduct. The slow component shown in A with its strong pH dependence is not present any more.
The decay of the LOV1/2-C57S mutant (Hisp2x) remains monoexponential with constant decay time in the pH range 4.3–7.4 (Fig. 5 B). No significant change is observed when the NaCl concentration is increased from 10 mM to 100 mM.
Effect of the NaCl concentration on the adduct lifetime
The increase of the adduct lifetime of LOV1 under acidic conditions is strongly amplified by a simultaneous increase of the NaCl concentration from 10 mM to 100 mM (16). A similar behavior was not observed for LOV2 or the LOV1/2-C57S mutant. Hence a specific interaction of LOV1 with either sodium or chloride ions might exist. Thus, sodium and chloride were replaced by cations and anions of more delocalized charge and bigger size. Measurements were performed in a 10-mM phosphate buffer at pH 4.7 and 100 mM salt concentration in all cases. Replacement of sodium by potassium, N-methylglucaminate (NMG+), or Et4N+ slightly reduces the time constant by 5–10% (Table 3). Replacement of chloride by the anions perchlorate or phenylsulfonate, however, reduces the lifetime of the adduct by almost 50% and brings it back close to the value observed for low salt concentration (10 mM). We conclude that of all ions investigated the chloride ions have by far the strongest influence on the adduct lifetime.
TABLE 3.
Influence of cations and anions on the time constants of the adduct decay in LOV1
| Cation varied | Time constant (s) | Anion varied | Time constant (s) | ||
|---|---|---|---|---|---|
| Na+ | Cl− | 692 | Na+ | Cl− | 692 |
| NMG+ | Cl− | 659 | Na+ |  |
397 |
| K+ | Cl− | 645 | Na+ |  |
341 |
| (Et)4N+ | Cl− | 622 | |||
All samples were measured at pH 4.7, 10 mM phosphate buffer and 100 mM ion concentration. The LOV1 domain was obtained from a His-pMal construct.
In search of a defined stoichiometry of the interaction between LOV1 and chloride ions, the dependence of the adduct decay was studied as a function of NaCl concentration in the range 5–600 mM in phosphate buffer solutions of 10 and 100 mM pH 4.7 (see Fig. 6). No stepwise or sigmoidal dependence of the rate constants on the NaCl concentration was visible. Instead, a plot of the rate constant versus the logarithm of the salt concentration resulted in a linear dependence.
FIGURE 6.

Rate constants of adduct decay in the wild-type LOV1 domain (His-pMal) at 10 mM and 100 mM phosphate buffer pH 4.7. The NaCl concentration was varied from 5 to 600 mM, which slows down the adduct decay considerably. The logarithmic representation yields a linear dependence.
Activation energy of bond cleavage in the adduct
From the temperature dependence of rate constants of reactions, the activation energy can be determined by application of the Arrhenius equation. Kinetic measurements of adduct decay were performed in the temperature range between 20 and 30°C. For LOV1-Hisp2x at pH 7.8, the two time constants of the biexponential fit were evaluated separately (Fig. 7 A). The activation energy for the slow component of the decay is 62 kJ/mol, whereas the fast component does not depend on the temperature within the experimental error. At acidic pH (4.8) the activation energy rises to 78 kJ/mol as the dark form recovery slows down considerably. In LOV2-Hisp2x, the logarithm of both decay rates of the adduct depends linearly on the reciprocal temperature according to the Arrhenius equation (see Fig. 7 B). As in LOV1, the activation barriers are higher in acidic solution. For LOV2 we find 65 and 100 kJ/mol at pH 4.9 for the fast and slow components, respectively, compared to 52 and 72 kJ/mol at pH 7.8. The activation energy for the fast decay at pH 7.8 compares well to the 55 kJ/mol determined in LOV2 from Avena sativa phot1 (35).
FIGURE 7.

Arrhenius plot of the rate constants of the adduct decay in the wild-type LOV1 (A) and LOV2 (B) domains. Measurements were performed at temperatures between 20 and 30°C. All decay traces were fitted biexponentially except for LOV1 at acidic pH. (A) In LOV1, activation energies of 62 kJ/mol for the slow component at pH 7.8 and 78 kJ/mol at pH 4.8 were obtained. (B) In LOV2, the activation energies are 52 and 72 kJ/mol at pH 7.8 and 65 and 100 kJ/mol at pH 4.9 for the fast and slow component, respectively.
DISCUSSION
Lifetimes of the triplet excited states
The triplet excited state in the wild-type LOV2 domain from C. reinhardtii phot decays with a time constant of 500 ns. Up to now, lifetimes of the triplet excited state have been investigated in two other LOV domains by time-resolved absorption spectroscopy: In LOV2 from A. sativa phot1, the wild-type domain shows a monoexponential decay with a time constant of 4 μs (15), whereas in LOV1 from C. reinhardtii phot, a biexponential decay is observed with 800 ns and 4 μs (16). Hence, the LOV2 domain from C. reinhardtii phot displays the fastest triplet-state decay of the three domains, which is in line with the very efficient formation of the adduct (Φadd = 0.9 (34)).
For LOV1-715, a double exponential decay has been observed (16) and assigned to two conformers which differ in the relative arrangement of the reactive cysteine sulfur to the FMN. Since in LOV2 only a fast single exponential decay is observed, the second conformer leading to the slow (4 μs in LOV1) decay component might not be populated in LOV2. This might again be related to the higher quantum efficiency of LOV2 compared to LOV1 (34,36,37). In one of the two conformers (I) in LOV1 the cysteine sulfur is closer to the carbon atom C4a of FMN to which it finally binds (20). In the other conformer the sulfur is closer to C5a of FMN. Ab initio calculations have shown that this carbon atom (C5a) acquires a much larger positive charge than the C4a atom in the FMN triplet state (20,22). If the first reaction step on the path from the triplet to the adduct is electron transfer, conformer II might react faster than conformer I. This interpretation is supported by the observation that conformer II has higher abundance than conformer I, and the fast triplet decay component has a higher amplitude than the slow decay component. It will be interesting to see which of the two conformers is realized in LOV2.
The triplet excited state in the LOV2-C250S mutant decays with a main time constant of 250–300 μs. Compared to the LOV1-C57S mutant with a main time constant of 27 μs (16), the process is significantly slower. For free FMN in phosphate buffer, a time constant of 204 μs was determined from extrapolation to infinite dilution (38). In the protein, triplet-triplet annihilation and quenching by FMN in the ground state are prevented by the protective influence of the apoprotein. The protein scaffold also reduces the contribution of low-frequency modes, as evidenced by the resolved vibrational structure in the ultraviolet (UV) spectrum. This may explain the fact that the lifetime of the triplet state in LOV2-C250S is even longer than that of free FMN in water. In fact, not the long lifetime of LOV2-C250S but the 10 times shorter lifetime of LOV1-C57S demands an explanation. A quenching channel not active in the LOV2 domain must exist in the LOV1 domain. Since no x-ray structure of comparable quality to that of the LOV1 domain is yet available for Chlamydomonas LOV2, structural differences between the two domains can only indirectly be inferred from their sequences. Sequence comparison reveals no additional triplet quenching residues in close neighborhood to the FMN in LOV1 in comparison to LOV2. One can speculate that the triplet lifetime is not shortened due to external quenching but rather by an enhancement of an internal decay channel of FMN. For example, deviation from planarity might increase the spin orbit interaction and enhance intersystem crossing. Hence, it would be interesting to see whether FMN is more planar in LOV2 than in LOV1.
As stated in the Results section, the time constants of the decay of the triplet excited state in LOV1 and LOV2 remain almost unchanged when a second domain is attached in the double-domain construct. The triplet excited states in the LOV1/2-C57S, as well as the LOV1/2-C250S mutant, show a decay that can be interpreted as the superposition of the separate decays of LOV2 wild-type combined with LOV1-C57S mutant and LOV1 wild-type combined with LOV2-C250S mutant, respectively. It may be concluded at this point that either the two domains do not interact in darkness as well as in the triplet excited state, or the interaction between the two domains does not influence the properties of the triplet states of their chromophores.
Thermal decay of the adduct LOV-390
For wild-type LOV2 from C. reinhardtii Phot, there is a discrepancy between our decay times of 30 and 270 s and previous data with a 20-s time constant (30). This difference may be related to the fact that our construct contains only a small His-tag attached to the protein, whereas Kasahara et al. (30) used a much larger calmodulin-binding protein. Interestingly, the LOV1/2-C57S mutant, where the LOV1 domain is inactivated, shows a similarly fast decay time of 30 s. This is a clear indication of an interaction between the domains, which blocks the slow pathway of adduct decay observed in the LOV2-His protein. The same observation applies also to the LOV1-His domain and the LOV1/2-C250S mutant. The comparison shows that the LOV1 domain has in this respect a stronger influence on LOV2 than vice versa. The influence on the adduct decay in the first domain is exerted without light activation of the second domain. However, the molecular basis for the observed biexponentiality in LOV1-His and LOV2-His is not yet understood.
The wild-type LOV1/2 domain shows an adduct decay which is easily interpreted as a superposition of the decays of the single domains in the LOV1/2 mutant systems. The values of 270 and 30 s are in fair agreement with previous measurements (30).
Photochemical backreaction of LOV-390 to LOV-447
One cause for incomplete bleaching even at highest light intensities could be the existence of a light driven backreaction. An alternative explanation is the presence of a fraction of FMN molecules incapable of forming the adduct. In previous studies of LOV1 (16) and LOV2 (39) only the first hypothesis was considered. Direct evidence for such a photoinduced backreaction was provided by time-resolved absorption spectroscopy on LOV2 from Adiantum phy3 (40). Since excitation with UV light, which can excite the adduct, leads to almost the same photostationary state as excitation with light that cannot excite the adduct, the alternative hypothesis of a photoinactive fraction of FMN should also be tested. Accordingly, the bleaching data shown in Fig. 4 will be analyzed by the following model: the photoreactive fraction of FMN has concentration c0 = c1 + c2, where c1 and c2 are the concentrations in the corresponding dark and adduct states, respectively. The concentration of the inactive form is defined as c3 = c0xi. The dark form (species 1) is photochemically converted to the adduct (species 2) with an apparent rate constant Fα1 given by
 |
where F is the total photon flux, Φ1 the quantum yield, ɛ1(λ) the extinction coefficient of species 1, and ρ(λ) the normalized quantum emission spectrum of the light source. The backreaction can occur either thermally with rate constant k2, or photochemically with an apparent rate constant Fα2 defined in analogy to that of the forward reaction. In the photostationary state the concentrations cj of both species are related by
 |
where xs is the fraction of the photoreactive FMN that is in the adduct state. The absorbance of this sample measured at wavelength λ′ is
 |
The relative bleaching induced by light of intensity F is then given by
 |
Hence, a plot of ΔA/A versus F can be fitted by the expression
 |
(1) |
where the parameters R and a have the interpretation
 |
where xa = 1/(1 + xi) is the mole fraction of photochemically active FMN. Whereas this function provides a good fit with the data for LOV1 (see also Kottke et al. (16)), the corresponding fit to the data for LOV2 is rather poor. This can be attributed to the fact that in LOV2 there are two coexisting species with sizeable concentrations that show distinctly different decay-rate constants. Hence the fitting function is extended to
 |
(2) |
where the subscripts f and s refer to the fast- and slow-decaying components, respectively. The fit with this function is shown as the solid lines in Fig. 4. The extrapolated limits for bleaching with UV light are R = 0.882 ± 0.003 for LOV1 and Rf + Rs = 0.910 ± 0.006 for LOV2, which indicates that ∼9–12% of the absorption at 475 nm cannot be bleached. Very strong bleaching with a high power (1-W) blue LED at 460 nm for 1 s resulted in ΔA/A = 0.91 for LOV1 and ΔA/A = 0.93 for LOV2, i.e., ∼7–9% of the absorption at 475 nm cannot be bleached. We estimate that the absorption coefficient of the adduct at 475 nm is <4% of that of the dark form. Since the spectrum of the LED has little overlap with the spectrum of the adduct, we may set α2/α1 ≈ 0 and obtain xa = 0.948 for LOV1 and xa = 0.969 for LOV2. Hence ∼3–5% of the FMN in these samples is not converted to the adduct by the strong LED light pulse, whereas 5–8% is not converted by UV light of infinite intensity that excites both the dark form and the adduct with similar probability. The ratio of the two bleaching limits for UV and LED irradiation is, according to our model, given by
 |
If a photoreaction induced by the LED can be neglected, this leads to α2/α1 ≈ 0.034 for LOV1 and α2/α1 ≈ 0.022 for LOV2 for UV irradiation. If the overlap of the spectrum of the LED with that of the adduct is sufficient to induce some backreaction, these numbers could even become slightly larger. Hence there is some evidence for a photochemical backreaction, albeit with a much smaller quantum yield as compared to the forward reaction.
pH dependence of adduct decay in LOV2
The adduct decay in the LOV2 domain displays a similar pH dependence as has been shown for LOV1 (16) (see Fig. 5 A). The pKa value for this process cannot be determined precisely from the data set, since it is close to the pH limit of LOV2 domain stability. The pKa value is in the range of 5–6, which is similar to the values of 5.3 and 5.6 found in LOV1. This supports the previous interpretation that a protonation of the FMN phosphate and the change of its interaction with Arg58 are responsible for this effect, as this arginine is also conserved in LOV2 (Arg251) (6). In the LOV1/2-C57S mutant, no pH effect was observed (see Fig. 5 B). This might be due to a coverage of the protonation site in LOV2 by the attached LOV1 domain, suggesting an interaction between LOV1 and LOV2. In LOV2 from A. sativa phot1, the effect of pH change on the adduct decay time is small (35). This might be explained by the fact that a calmodulin-binding protein was fused to the protein.
Influence of salt concentration on the adduct decay
The data shown in Table 3 indicate that chloride ions are responsible for the major part of the observed salt effect in LOV1. If the new species formed at increased salt concentration are in fast equilibrium with the species present at low salt concentration, a monoexponential adduct decay is observed. If the new species formed at high salt concentration also have a well defined stoichiometry, a stepwise dependence of the rate constant on the salt concentration is expected, with each step corresponding to an equilibrium. However, the concentration dependence shows no steps that could be interpreted in terms of equilibria between FMN and FMN*Cln complexes with a defined stoichiometry. Instead, a linear rise of the rate constant with the logarithm of the salt concentration is observed. A specific interaction of chloride with a single site, e.g., by intrusion of a chloride ion into the binding pocket of the FMN, is therefore unlikely. Such a specific interaction between a chloride ion and a serine has, for example, been identified within the chloride pump halorhodopsin (41).
The smooth logarithmic dependence on the chloride concentration observed for the rate constant of LOV1 suggests an unspecific interaction that gradually weakens the driving force and/or increases the barrier for the thermal backreaction of the adduct. The FMN in the dark form of the LOV domains is held in place not by a covalent bond but by ∼12 hydrogen bonds to amino acid side chains (20). The x-ray structure of the adduct shows that most of these hydrogen bonds are changed by the formation of the adduct. This might contribute to the driving force for the thermal backreaction. Chloride ions might modify the electrostatic potential near these hydrogen bonds, especially in the vicinity of the solvent-accessible phosphate group of the FMN. A mutation of arginine 58 (R58K), which contributes with two hydrogen bonds to fixation of the FMN phosphate to the protein in LOV1, has indeed shown a profound influence on the velocity of the thermal backreaction (37).
Activation energy of the adduct decay process
The linear dependence in the Arrhenius plots of LOV1 and LOV2 allows the conclusion that no heat capacity change is taking place during the conversion from LOV-390 to the dark form. This is in contrast to the last step in the photocycle of the photoreceptor photoactive yellow protein (42). In photoactive yellow protein, the heat capacity change results from the exposure of hydrophobic sites to the medium (42). Our findings support the hypothesis that no big conformational changes occur during the photocycle of LOV domains. Besides evidence from x-ray crystallography, where movements might be restricted, this has also been shown by Fourier transform infrared difference spectroscopy in solution. There, the absence of strong amide difference bands rules out big conformational changes of the protein backbone in the LOV1 photocycle (28).
In LOV1, the fast component of the adduct decay at pH 7.8 does not depend on the temperature. This implies that the underlying process does not have an activation barrier. As the slow component shows an activation energy of 62 kJ/mol, the two time constants might originate from two mechanistically different processes. Interestingly, the component without activation energy disappears when LOV2 is present in the LOV1/2-C250S mutant. In contrast, the components in LOV2 all show a considerable activation barrier with energy values of 52–100 kJ/mol.
CONCLUSION
The results of our investigation can be summarized by the picture of the photocycle shown in Fig. 8. After excitation to the first excited singlet state, LOV2 converts to the triplet state, which is observed in transient absorption spectroscopy as species LOV2-715. In the LOV2-C250S mutant this triplet state returns to the ground state LOV2-446 with a main time constant of ∼290 μs. In the wild-type, this triplet decays with a time constant of 500 ns under formation of the adduct state LOV2-390.
FIGURE 8.
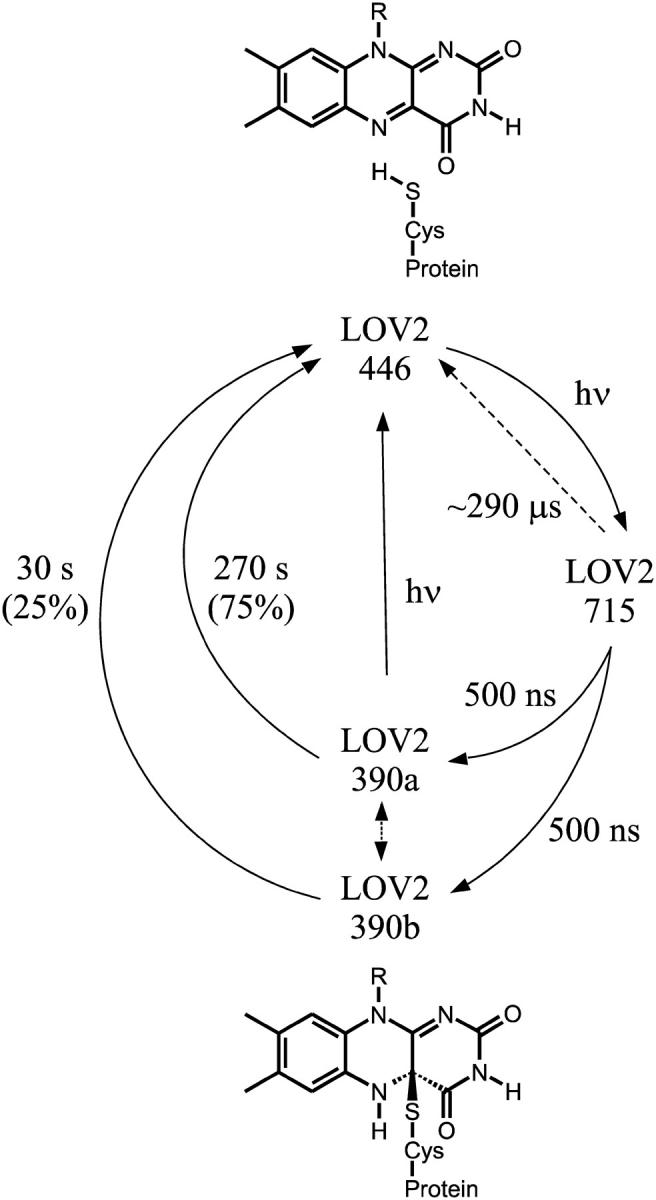
Photocycle of the single wild-type LOV2 domain from C. reinhardtii Phot at pH 8 and 10 mM NaCl. The dashed arrow depicts the triplet decay in the absence of any adduct formation as obtained from the LOV2-C250S mutant. The biexponential decay of the adduct implies two separate species of LOV2-390. These might correspond to two dark forms for LOV2-446.
The backreaction of LOV2-390 to LOV2-446 in the dark is double-exponential in the whole pH range studied (4.8–10.0), indicating that two species are involved, which can, however, not yet be distinguished on the triplet level or in their dark forms. The situation is different from LOV1, where a minor fast component in the decay of the adduct is only discernible at high pH. Also, the decay times in LOV2-390 are not affected by chloride, in strong contrast to the behavior of LOV1-390.
In the double domains (LOV1/2-wt, LOV1/2-C57S, LOV1/2-C250S), the triplet states apparently do not interact, but decay with the time constants of the corresponding single domains. The rates of the thermal backreaction from the adduct do, however, depend on the presence of a second domain. The single LOV domains show a second component in the decay, which disappears upon interaction with the other domain in the double-domain constructs. Furthermore, the pH dependence of the LOV2 adduct decay is no longer present in the LOV1/2-C57S mutant, which might be caused by a coverage of the protonation site. Interestingly, calmodulin-binding proteins seem to have a similar effect on the single LOV domains. One might speculate that the species leading to the second decay time in the kinetics of the single domains are in fact dimers.
Acknowledgments
We thank Tina Schiereis for excellent technical assistance.
H.G. and T.K. gratefully acknowledge postgraduate stipends from the Deutsche Forschungsgemeinschaft (GK 640 Sensory Photoreceptors). B.D. acknowledges support by the Fonds der Chemischen Industrie.
References
- 1.Taylor, B. L., and I. B. Zhulin. 1999. PAS domains: internal sensors of oxygen, redox potential and light. Microbiol. Mol. Biol. Rev. 63:479–506. [DOI] [PMC free article] [PubMed] [Google Scholar]
- 2.Briggs, W. R., and E. Huala. 1999. Blue-light photoreceptors in higher plants. Annu. Rev. Cell Dev. Biol. 15:33–62. [DOI] [PubMed] [Google Scholar]
- 3.Hegemann, P., M. Fuhrmann, and S. Kateriya. 2001. Algal sensory photoreceptors. J. Phycol. 37:668–676. [Google Scholar]
- 4.Christie, J. M., and W. R. Briggs. 2001. Blue light sensing in higher plants. J. Biol. Chem. 276:11457–11460. [DOI] [PubMed] [Google Scholar]
- 5.Briggs, W. R., and J. M. Christie. 2002. Phototropin 1 and phototropin 2: Two versatile plant blue-light receptors. Trends Plant Sci. 7:204–210. [DOI] [PubMed] [Google Scholar]
- 6.Crosson, S., S. Rajagopal, and K. Moffat. 2003. The LOV domain family: photoresponsive signaling modules coupled to diverse output domains. Biochemistry. 42:2–10. [DOI] [PubMed] [Google Scholar]
- 7.Gomelsky, M., and G. Klug. 2002. BLUF: a novel FAD-binding domain involved in sensory transduction in microorganisms. Trends Biochem. Sci. 27:497–500. [DOI] [PubMed] [Google Scholar]
- 8.Braatsch, S., and G. Klug. 2004. Blue light perception in bacteria. Photosynth. Res. 79:45–57. [DOI] [PubMed] [Google Scholar]
- 9.Sancar, A. 1994. Structure and function of DNA photolyase. Biochemistry. 33:2–9. [DOI] [PubMed] [Google Scholar]
- 10.Iino, M. 2001. Phototropism in higher plants. In Photomovement. D. P. Häder and M. Lebert, editors. Elsevier, Amsterdam. 659–811.
- 11.Haupt, W. 1999. Chloroplast movement: from phenomenology to molecular biology. Prog. Bot. 60:3–36. [Google Scholar]
- 12.Schroeder, J. I., G. J. Allen, V. Hugouvieux, J. M. Kwak, and D. Waner. 2001. Guard cell signal transduction. Annu. Rev. Plant Physiol. Plant Mol. Biol. 52:627–658. [DOI] [PubMed] [Google Scholar]
- 13.Parks, B. M., K. M. Folta, and E. P. Spalding. 2001. Photocontrol of stem growth. Curr. Opin. Plant Biol. 4:436–440. [DOI] [PubMed] [Google Scholar]
- 14.Huang, K., and C. F. Beck. 2003. Phototropin is the blue-light receptor that controls multiple steps in the sexual life cycle of the green alga Chlamydomonas reinhardtii. Proc. Natl. Acad. Sci. USA. 100:6269–6274. [DOI] [PMC free article] [PubMed] [Google Scholar]
- 15.Swartz, T. E., S. B. Corchnoy, J. M. Christie, J. W. Lewis, I. Szundi, W. R. Briggs, and R. A. Bogomolni. 2001. The photocycle of a flavin-binding domain of the blue light photoreceptor phototropin. J. Biol. Chem. 276:36493–36500. [DOI] [PubMed] [Google Scholar]
- 16.Kottke, T., J. Heberle, D. Hehn, B. Dick, and P. Hegemann. 2003a. Phot LOV1: Photocycle of a blue light receptor domain from the green alga Chlamydomonas reinhardtii. Biophys. J. 84:1192–1201. [DOI] [PMC free article] [PubMed] [Google Scholar]
- 17.Salomon, M., J. M. Christie, E. Knieb, U. Lempert, and W. R. Briggs. 2000. Photochemical and mutational analysis of the FMN-binding domains of the plant blue light receptor, phototropin. Biochemistry. 39:9401–9410. [DOI] [PubMed] [Google Scholar]
- 18.Salomon, M., W. Eisenreich, H. Dürr, E. Schleicher, E. Knieb, V. Massey, W. Rüdiger, F. Müller, A. Bacher, and G. Richter. 2001. An optomechanical transducer in the blue light receptor phototropin from Avena sativa. Proc. Natl. Acad. Sci. USA. 98:12357–12361. [DOI] [PMC free article] [PubMed] [Google Scholar]
- 19.Crosson, S., and K. Moffat. 2002. Photoexcited structure of a plant photoreceptor domain reveals a light-driven molecular switch. Plant Cell. 14:1067–1075. [DOI] [PMC free article] [PubMed] [Google Scholar]
- 20.Fedorov, R., I. Schlichting, E. Hofmann, T. Domratcheva, M. Fuhrmann, and P. Hegemann. 2003. Crystal structures and molecular mechanism of a light induced signaling switch: the Phot-LOV1 domain from Chlamydomonas reinhardtii. Biophys. J. 84:2474–2482. [DOI] [PMC free article] [PubMed] [Google Scholar]
- 21.Kennis, J. T. M., S. Crosson, M. Gauden, I. H. M. van Stokkum, K. Moffat, and R. van Grondelle. 2003. Primary reactions of the LOV2 domain of phototropin, a plant blue-light receptor. Biochemistry. 42:3385–3392. [DOI] [PubMed] [Google Scholar]
- 22.Neiß, C., and P. Saalfrank. 2003. Ab initio quantum chemical investigation of the first steps of the photocycle of phototropin: a model study. Photochem. Photobiol. 77:101–109. [DOI] [PubMed] [Google Scholar]
- 23.Bittl, R., C. W. M. Kay, S. Weber, and P. Hegemann. 2003. Characterization of a radical product in a C57M Mutant of a LOV1 domain by electron paramagnetic resonance. Biochemistry. 42:8506–8512. [DOI] [PubMed] [Google Scholar]
- 24.Kottke, T., B. Dick, R. Fedorov, I. Schlichting, R. Deutzmann, and P. Hegemann. 2003b. Irreversible photoreduction of flavin in a mutated Phot-LOV1 domain. Biochemistry. 42:9854–9862. [DOI] [PubMed] [Google Scholar]
- 25.Kay, C. W. M., E. Schleicher, A. Kuppig, H. Hofner, W. Rüdiger, M. Schleicher, M. Fischer, A. Bacher, S. Weber, and G. Richter. 2003. Blue light perception in plants. Detection and characterization of a light-induced neutral flavin radical in a C450A mutant of phototropin. J. Biol. Chem. 278:10973–10982. [DOI] [PubMed] [Google Scholar]
- 26.Schleicher, E., R. M. Kowalczyk, C. M. Kay, P. Hegemann, A. Bacher, M. Fischer, R. Bittl, G. Richter, and S. Weber. 2004. On the reaction mechanism of adduct formation in LOV domains of the plant blue-light receptor phototropin. J. Am. Chem. Soc. 126:11067–11076. [DOI] [PubMed] [Google Scholar]
- 27.Bednarz, T., A. Losi, W. Gärtner, P. Hegemann, and J. Heberle. 2004. Functional variations among LOV domains as revealed by FT-IR difference spectroscopy. Photochem. Photobiol. Sci. 3:575–579. [DOI] [PubMed] [Google Scholar]
- 28.Ataka, K., P. Hegemann, and J. Heberle. 2003. Vibrational spectroscopy of an algal Phot-LOV1 domain probes the molecular changes associated with blue-light reception. Biophys. J. 84:466–474. [DOI] [PMC free article] [PubMed] [Google Scholar]
- 29.Harper, S. M., L. C. Neil, and K. H. Gardner. 2003. Structural basis of a phototropin light switch. Science. 301:1541–1544. [DOI] [PubMed] [Google Scholar]
- 30.Kasahara, M., T. E. Swartz, M. A. Olney, A. Onodera, N. Mochizuki, H. Fukuzawa, E. Asamizu, S. Tabata, H. Kanegae, M. Takano, J. M. Christie, A. Nagatani, and W. R. Briggs. 2002. Photochemical properties of the flavin mononucleotide-binding domains of the phototropins from Arabidopsis, rice, and Chlamydomonas reinhardtii. Plant Physiol. 129:762–773. [DOI] [PMC free article] [PubMed] [Google Scholar]
- 31.Kagawa, T., M. Kasahara, T. Abe, S. Yoshida, and M. Wada. 2004. Function analysis of phototropin2 using fern mutants deficient in blue light-induced chloroplast avoidance movement. Plant Cell Physiol. 45:416–426. [DOI] [PubMed] [Google Scholar]
- 32.Huang, K., T. Merkle, and C. F. Beck. 2002. Isolation and characterization of a Chlamydomonas gene that encodes a putative blue-light photoreceptor of the phototropin family. Physiol. Plant. 115:613–622. [DOI] [PubMed] [Google Scholar]
- 33.Schüttrigkeit, T. A., C. K. Kompa, M. Salomon, W. Rüdiger, and M. E. Michel-Beyerle. 2003. Primary photophysics of the FMN binding LOV2 domain of the plant blue light receptor phototropin of Avena sativa. Chem. Phys. 294:501–508. [Google Scholar]
- 34.Holzer, W., A. Penzkofer, T. Susdorf, M. Alvarez, Sh. D. M. Islam, and P. Hegemann. 2004. Absorption and emission spectroscopic characterisation of the LOV2-domain of phot from Chlamydomonas reinhardtii fused to a maltose binding protein. Chem. Phys. 302:105–118. [Google Scholar]
- 35.Corchnoy, S. B., T. E. Swartz, J. W. Lewis, I. Szundi, W. R. Briggs, and R. A. Bogomolni. 2003. Intramolecular proton transfers and structural changes during the photocycle of the LOV2 domain of Phototropin 1. J. Biol. Chem. 278:724–731. [DOI] [PubMed] [Google Scholar]
- 36.Islam, S. D. M., A. Penzkofer, and P. Hegemann. 2003. Quantum yield of triplet formation of riboflavin in aqueous solution and of flavin mononucleotide bound to the LOV1 domain of Phot1 from Chlamydomonas reinhardtii. Chem. Phys. 291:97–114. [Google Scholar]
- 37.Losi, A., T. Kottke, and P. Hegemann. 2004. Recording of blue light-induced energy and volume changes within the wild-type and mutated Phot-LOV1 domain from Chlamydomonas reinhardtii. Biophys. J. 86:1051–1060. [DOI] [PMC free article] [PubMed] [Google Scholar]
- 38.Fritz, B. J., K. Matsui, S. Kasai, and A. Yoshimura. 1987. Triplet lifetimes of some flavins. Photochem. Photobiol. 45:539–541. [Google Scholar]
- 39.Holzer, W., A. Penzkofer, and P. Hegemann. 2005. Absorption and emission spectroscopic characterization of the LOV2-His domain of phot from Chlamydomonas reinhardtii. Chem. Phys. 308:79–91. [DOI] [PubMed] [Google Scholar]
- 40.Kennis, J. T. M., I. H. M. van Stokkum, S. Crosson, M. Gauden, K. Moffat, and R. van Grondelle. 2004. The LOV2 domain of phototropin: A reversible photochromic switch. J. Am. Chem. Soc. 126:4512–4513. [DOI] [PubMed] [Google Scholar]
- 41.Kolbe, M., H. Besir, L. O. Essen, and D. Oesterhelt. 2000. Structure of the light-driven chloride pump halorhodopsin at 1.8 Å resolution. Science. 288:1390–1396. [DOI] [PubMed] [Google Scholar]
- 42.Van Brederode, M. E., W. D. Hoff, I. H. M. Van Stokkum, M. L. Groot, and K. J. Hellingwerf. 1996. Protein folding thermodynamics applied to the photocycle of the photoactive yellow protein. Biophys. J. 71:365–380. [DOI] [PMC free article] [PubMed] [Google Scholar]