

Abstract
In the complex pathway of histidine biosynthesis, a key branch point linking amino acid and purine biosynthesis is catalyzed by the bifunctional enzyme imidazole glycerol phosphate (IGP) synthase. The first domain of IGP synthase, a triad glutamine amidotransferase, hydrolyzes glutamine to form glutamate and ammonia. Its activity is tightly regulated by the binding of the substrate PRFAR to its partner synthase domain. Recent crystal structures and molecular dynamics simulations strongly suggest that the synthase domain, a (β/α)8 barrel protein, mediates the insertion of ammonia and ring formation in IGP by channeling ammonia from one remote active site to the other. Here, we combine both mutagenesis experiments and computational investigations to gain insight into the transfer of ammonia and the mechanism of conduction. We discover an alternate route for the entrance of ammonia into the (β/α)8 barrel and argue that water acts as both agonist and antagonist to the enzymatic function. Our results indicate that the architecture of the two subdomains, most notably the strict conservation of key residues at the interface and within the (β/α)8 barrel, has been optimized to allow the efficient passage of ammonia, and not water, between the two remote active sites.
INTRODUCTION
Histidine biosynthesis is an ancient (1,2) and complex metabolic pathway consisting of 11 enzymatic steps (3), involving either seven enzyme complexes in eukarya, or nine in other domains of life (4). The histidine biosynthetic pathway has been the subject of a multitude of scientific studies, providing models for operon theory (5–7), and genetic regulatory mechanisms (8). More recently, the components of the pathway have served as models of metabolic (2,9) and structural (10,11) evolution. Work done by Ames in the early 1960s reported that the enzyme regulating the first step of the pathway is inhibited by the end product, histidine (12). Considering that histidine metabolism utilizes as much as 2.5% of the cell's total metabolic energy, requiring 41 ATP equivalents per cycle (13), controlled regulation is critical, and in addition to being regulated by histidine, the first step is also mediated by concentrations of AMP, ADP (14), and a histidyl-tRNA synthetase-like protein (15). Since histidine is an essential amino acid for animals but not for plants and microorganisms, several of the enzymes within the pathway have been targeted as potential herbicides (16,17), and the ability of histidine to coordinate Ni2+ and possibly other metal contaminants, identifies histidine-rich plants as potential facilitators of phytoremediation (18). Of special interest is the fifth step, regulated by imidazole glycerol phosphate (IGP) synthase, which provides a direct link between amino acid and purine biosynthesis through two of its products.
IGP synthase belongs to the glutamine amidotransferase (GATase) family of enzymes, all of which catalyze the hydrolysis of glutamine to form ammonia, which is used in a subsequent reaction (19). Intermolecular channeling of the nascent ammonia between the disparate active sites seems to be a general feature within the family (20) and has been experimentally shown to occur in the GATase carbamoyl phosphate synthetase (21). For IGP synthase, although numerous crystal structures and mutational studies of have been reported (22,23,16,24–28), many aspects of the mechanisms of the two sequential, tightly coupled reactions remain unclear.
In eukaryotes, IGP synthase is a two-domain protein encoded on one polypeptide chain (gene: HIS7), whereas in bacteria and archaea, the two subunits must first dock before the reaction takes place (genes: hisH, hisF). The glutaminase subunit, hisH, is a triad GATase (Fig. 1), and its partner synthase domain, hisF, is a (β/α)8 barrel protein that completes a cyclase reaction to form the imidazole ring of histidine. Within the hisH active site, one molecule of glutamine binds to the cysteine of its catalytic triad to form a thioester intermediate (22); stabilization of this intermediate by several nearby conserved groups controls the hydrolysis of glutamine and release of ammonia (28). The nascent ammonia is released directly into chamber I, which is formed at the interface of the hisH and hisF subunits (Fig. 1). The crystal structures of the complex (16,25,26) all show chamber I positioned near the entrance of the (β/α)8 barrel of hisF (Fig. 1). At the mouth of the barrel is a quartet of strictly conserved residues (hereafter, yeast numbering is presented in italics immediately following the Thermotoga maritima numbering): R5 (R239), E46 (E293), K99 (K360), and E167 (E465) (Fig. 2 A). These four charged residues were previously thought to be instrumental in controlling, or “gating”, the entrance of ammonia into the barrel. In previous studies we considered possible gate-opening mechanisms and simulated the passage of ammonia through various open (and closed) gate conformations (29,30). It had been assumed that ammonia must pass through the center of these “gate” residues, although attempts to pull ammonia through them resulted in a free energy barrier in excess of 25 kcal/mol. Despite the attempts of crystallographers to catch IGP synthase in its functional form, to date, the only movement reported in these four residues was the slight bending of the last carbon-nitrogen group of K99 (25).
FIGURE 1.

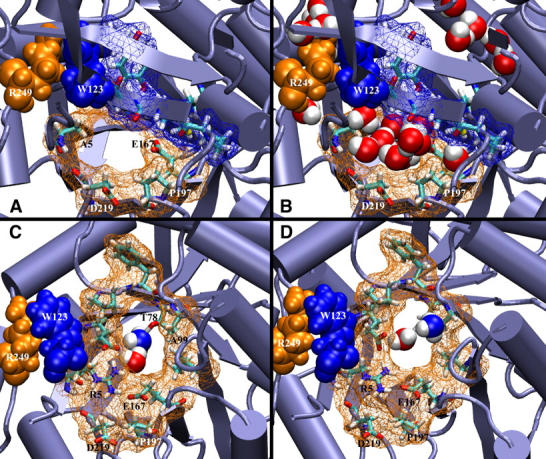
The interface and putative ammonia pathway between hisH and hisF. (A) Two conserved interdomain contacts in T. maritima are highlighted in space-filling: the cation-π pair (W123 of hisH in orange, R249 of hisF in blue) and the salt bridge between K181 of hisH (blue) and D98 of hisF (red). Conserved Y138, near the middle of the interface, demarks the exposed side of the interface from the intermolecular ammonia channel (shown in lavender spheres) that extends from the glutaminase active site histidine, H178, to the active site of hisF. (B) View of the entire ammonia channel, from the glutaminase active site to PRFAR. Conserved residues lining chamber I are depicted in gray surface representation, and the hisH active site histidine near the top of the chamber in licorice. Ammonia migrates into the hisF (β/α)8 barrel through a side opening near K99, chamber II, the constriction region, and the PRFAR cavity, where the PRFAR substrate (space-filling) is bound. Conserved residues are shown in licorice and the barrel strands in cartoon.
FIGURE 2.

(A) View of the synthase domain (blue) as seen from the glutaminase domain; interface residues shown in licorice. Conserved residues R5, E46, K99, and E167, lie in-plane and form a tight network of salt bridges throughout the simulations. (B) Same view as in A, but waters at the interface are now shown. The left side of the interface, lined by R5, E46, P197, and D219 is exposed to bulk solvent; the right side, lined by K99, E167, P76, and D98, forms part of a protected cavity, chamber I. (C) Side view of the interface between the two subunits: the glutaminase domain is shown in pink. The conserved interdomain salt bridge between K181 and D98 is shown. Bulky residues Y138 and W123 protrude into the interface to form a wall that prevents entry of bulk water.
Once ammonia crosses the interface, it enters directly into chamber II (Fig. 1). This chamber can accommodate up to three molecules of either water or ammonia (30). Though the channel is lined with predominantly hydrophobic residues, two conserved polar residues lining the (β/α)8 barrel, T78 (T328) and S101 (S362), demarcate the constriction region of the channel (Fig. 1). Both residues were shown to act as hydrogen bonding partners for ammonia during the conduction process, and previous studies indicate that the highest barrier is at T78. Within the constriction region, only one small molecule can be accommodated. At the end of the barrel is the PRFAR cavity. This final cavity contains the ribonucleotide substrate, N′-[(5′-phosphoribulosyl)-formino]-5′ aminoimidazole-carboxamide ribonucleotide (PRFAR) (Fig. 1), which is bound by its two phosphate moieties across the width of the C-terminal barrel end (26).
Directed-evolution studies (31) and phylogenies based on sequence (32) and structure (33, 34) provide complementary information into how structure, sequence, and function can be changed during the course of evolution. Although some aspects of evolution are still under debate, one underlying idea remains clear: regions of a protein's structure and sequence have evolved under specific constraints to retain and optimize function. Globular proteins by their very nature have an inherent relationship with the aqueous contents of the cell in which they reside. In light of this principle, the evolution and structural optimization of a given protein must account for the role of water molecules (or lack thereof) in the enzyme's function. In IGP synthase, whereas some water molecules are necessary for proper enzymatic function at both the glutaminase and synthase active sites (35,24), previous simulations indicated that too much water may hinder the transport of ammonia by increasing the energetic barriers to its passage (30). However, the presence of one water molecule near ammonia seems to facilitate the making and breaking of hydrogen bonds between ammonia and the side chains of key conserved polar residues lining the barrel wall, T78 (T395) and S101 (S362). With the assistance of a water molecule, these key conserved residues have been shown to act as an “ammonia relay” (29).
A survey of 11 bacterial and eukaryotic crystal structures of the heterodimeric enzyme complex (16,25,26), reveals insight into the possible hydration states of the interdomain chambers that ammonia uses to traverse the distance between the two active sites. Within chamber I, there are between four and six crystallographically resolved water molecules, most of which are near the glutaminase active site. Within chamber II, three of the structures have two water molecules present, seven structures have one water molecule present, and one structure has none. Molecular dynamics (MD) simulations of these various hydration states indicate that although the behavior of water within the channel is different in the various trajectories, there is almost always one water molecule present in chamber II, and its residence time lasts the length of any simulation (nanosecond) (30). In a typical trajectory, water molecule(s) from the PRFAR cavity diffuse up through the constriction region and form a hydrogen bond with T78 and the water molecule(s) in chamber II. On occasion, a single file of water molecules spanning the distance between chamber II and the PRFAR cavity forms (approximately once every 4 ns).
The present work suggests that the interface and (β/α)8 barrel of IGP synthase has evolved in order to maintain a delicate balance between hydrophobicity and complete solvation. Our results indicate that water plays various roles in the reaction scheme of IGP synthase, and that the enzyme has been structurally designed to accommodate these roles. The effects of key mutations on the enzymatic efficiency can be explained by monitoring the behavior and number of water molecules within the interface and channel in the MD simulations. Here, we perform MD simulations of several mutants for which there are kinetic and thermodynamic data and assess the behavior of these perturbed systems to determine the function of the mutated residues. We show that the interface of the two subunits is designed to accommodate a few select water molecules within the chamber I while simultaneously minimizing exchange with bulk solvent—thus providing ammonia with a protected route into the (β/α)8 barrel of hisF. We argue that a similar balance of water molecules, which is important for optimal ammonia conduction, is also maintained within the (β/α)8 barrel. Extended equilibrium MD simulations allow us to explore alternate entrances for ammonia into the channel, and finally, we use steered molecular dynamics (SMD) to demonstrate the preference of the hydrophobic barrel to conduct ammonia over water.
METHODS
Experimental
Materials
All chemicals, buffers, resins, and enzymes were purchased from commercial sources. The plasmid, pIGPS-T7, was prepared as previously described (36). PEP was synthesized according to a published procedure (27). PRFAR was synthesized according to a published procedure (37). Mutagenesis was performed as previously described (38). Custom oligonucleotides were synthesized commercially.
Site-directed mutagenesis
Oligonucleotides for site-directed mutagenesis were designed to include a restriction site to allow mutation verification by endonuclease digestion. All site-directed mutagenesis was carried out using Pfu Turbo DNA polymerase with direct mutation of the expressing plasmid (38). Confirmatory sequencing of the plasmids was performed by the Purdue Genomics Core Facility (Lafayette, IN).
Protein purification
Purification of His-tagged IGP synthase from Saccharomyces cerevisiae was performed as previously described (16).
IGP synthase assays
Glutamine-dependent synthase activity assays were performed as previously described (36). Steady-state kinetic assays of IGP synthase activity in the presence of ammonium were performed in a 96-well UV-transparent plate with a final volume of 250 μL, containing 50 mM PIPES, pH 7.0, 0.5 mM EDTA, 400 mM NH4Cl and varying concentrations of PRFAR. Eight separate readings for each concentration were analyzed and the plates were read with a UV-Vis/fluorescence spectrophotometric plate reader. Steady-state kinetic assays of the glutaminase half-reaction or stimulated glutaminase (in the presence of substrate analogs or products) were performed according to an established procedure (27). Basal glutaminase activity was assayed using the same conditions as above except the IGP synthase reaction incubation time was increased to 1 h and 200 μL aliquots were transferred to a 96-well untreated black flat-bottom plate. Glutamate concentrations were determined though the fluorescence of APADH (ex. 360 nm, em. 465 nm) (36) using standard curves prepared in parallel. Analyses of the reaction stoichiometry catalyzed by IGP synthases were performed as previously described (27).
Modeling
System setup
The crystal structure used in the simulations is the T. maritima structure (Protein DataBank code 1GPW). System setup was similar to that described in a recent study (30). Chains C and D of the hisH-hisF complex were chosen because the loop on the C-terminal end of hisF was resolved in a closed, active conformation. Active-site residues in both subunits were analyzed according to available biochemical information. For the glutaminase domain, hisH, H178 of the catalytic triad is protonated on its δ-nitrogen so as to be consistent with a covalently bound glutamine to the active site cysteine (20,35). For the synthase domain, hisF, the original crystal structure has an active-site mutation which was mutated back to its wild-type form (D11N). The hisH substrate was modeled as a covalently bound glutamyl thioester intermediate to C84 of the active site; according to the mechanism, this is consistent with a post-ammonia release state (20,35). Initially, ammonia was introduced into chamber I by placing it near the side entrance. Parameterization was necessary for the two substrates and ammonia, as they introduced nonstandard residues into the simulation. The parameterizations of the thioester linkage in hisH and the ribonucleotide substrate of hisF were performed following the established CHARMM protocol (39–41), and are briefly described in Refs. 30 and 42. For ammonia, a minimal parameterization was performed: Mulliken charges obtained from a Hartree-Fock 6-31G* quantum mechanical calculation were scaled so that the ratio of dipole moments of ammonia and TIP3 water in the simulations was the same as experimental gas phase values (experimental ratio water/ammonia is 1:26) (43). The partial charges of ammonia used in the simulations were 0.96 for the nitrogen and 0.32 for each of the hydrogens, an equilibrium bond length of 1.006 Å, and equilibrium angles of 107.5°. The resulting dipole moment of ammonia is 1.9 D, compared to 2.4 D for TIP3 water. The remaining parameters were assigned by analogy from the CHARMM27 force field. All crystal waters were kept and no additional water molecules were added to the interface. Hydrogens were added with PSFGEN and explicit TIP3 water molecules were added as solvent with SOLVATE (44) through VMD (45).
The pore visualization program HOLE (46) was used on the yeast isoform crystal structure 1OX5.pdb without hydrogens. Using Monte Carlo simulated annealing, HOLE maximizes the radii of spheres located along a specified vector. In this case, the (β/α)8 barrel of hisF was aligned in the z direction and the sample planes were uniformly spaced along this vector in 0.25 Å increments; the van der Waals radii were taken from AMBER (47). The program successfully identified the entire putative path for ammonia, leading from the glutaminase active site, through the side opening, and to the C-terminal end of the (β/α)8 barrel (the pore is depicted in lavender spheres of uniform radius equal to 2.0 Å in Fig. 1).
The composite 49,716 atom system was minimized for 10,000 steps and then equilibrated for 6 ns in the NPT ensemble, using periodic boundary conditions with a flexible cell and the hybrid Nosé-Hoover Langevin piston method (48) to control pressure at 1 atm. Particle-mesh Ewald was employed to efficiently treat electrostatics without a cutoff (49). Temperature was held constant at 298 K with Langevin dynamics. The timestep for integration was 1 fs and a multiple time-stepping algorithm was utilized, where bonded interactions were evaluated at every time step, short-range nonbonded interactions were evaluated every two time steps, and long-range electrostatics forces were evaluated every four time steps (50,51). The wild-type structure was equilibrated for over 6 ns to establish a baseline for comparative dynamics. All of the simulations including the SMD trajectories were performed with NAMD2 (52) using the CHARMM27 force field (39) and the TIP3 water model (53). Simulations were performed on Pittsburgh Supercomputing Center's LeMieux platform with 128 processors, the National Center for Supercomputing Application's Xeon Cluster (Tungsten) with 128 processors, and a local 127-processor SGI Origin 2000 cluster. Each nanosecond of equilibration of the system took ∼10 h on LeMieux, 12 h on Tungsten, or 40 h on the local machine.
Mutant systems
After the 6-ns equilibration of the wild-type system, specific point mutations were introduced manually. In this study, specific point mutations of hisF were made: R5A and K99A, as suggested by experimental data (Tables 1 and 2), and T78A. For the R5A and K99A mutants, the number of counterions was adjusted to maintain a neutral system. Each mutant system was minimized for 5000 steps and equilibrated under identical conditions; R5A mutant dynamics were observed for 2 ns and K99A dynamics for 6 ns. We also mutated the K99A mutant back to the wild-type system after ammonia had spontaneously entered chamber II, minimized the system for 5000 steps, and reequilibrated for an additional 4 ns. The T78A mutant was introduced to this equilibrated wild-type system with ammonia in chamber II. Again, the T78A mutant was first minimized for 5000 steps and then equilibrated for 2 ns to observe dynamics.
TABLE 1.
Cyclase kinetic parameters
| Mutation | Km, PRFAR* | kcat | kcat/Km |
|---|---|---|---|
| Wild-type | 5 ± 1 | 5.4 ± 0.5 | 1.2 ± 0.2 × 10⁶ |
| R5A (R239A) | 3.0 ± 0.6 | 4.3 ± 0.3 × 10⁻³ | 1.4 ± 0.3 × 10³ |
| K99A (K360A) | 1.8 ± 0.1 | 0.24 ± 0.01 | 1.3 ± 0.1 × 10⁵ |
| Y138F (Y144F) | 3.3 ± 0.3 | 1.41 ± 0.06 | 4.3 ± 0.4 × 10⁵ |
| Mutation | Km, PRFAR† | kcat | kcat/Km |
| Wild-type | 55 ± 8 | 0.845 ± 0.007 | 1.5 ± 0.2 × 10⁴ |
| R5A (R239A) | 53 ± 9 | 0.15 ± 0.01 | 2.8 ± 0.5 × 10³ |
| K99A (K360A) | 65 ± 10 | 0.70 ± 0.06 | 1.1 ± 0.1 × 10⁴ |
| Y138F (Y144F) | 14 ± 4 | 0.17 ± 0.03 | 12 ± 4 |
| Mutation | Km, Gln‡ | kcat | kcat/Km |
| Wild-type | 1.8 ± 0.2 | 6.9 ± 0.3 | 3.8 ± 0.4 × 10³ |
| R5A (R239A) | 6.5 ± 0.7 | 6.9 ± 0.8 × 10⁻³ | 1.06 ± 0.2 |
| K99A (K360A) | 1.96 ± 0.02 | 0.49 ± 0.01 | 2.47 ± 0.05 × 10² |
| Y138F (Y144F) | 2.0 ± 0.3 | 1.5 ± 0.1 | 7 ± 1 × 10² |
Data for wild-type, R5A, and K99A were published previously in Myers et al. (27).
PRFAR was the varied substrate and the concentration of glutamine was held constant at 40 mM.
PRFAR was the varied substrate and the concentration of  was held constant at 400 mM.
Glutamine was the varied substrate and the concentration of PRFAR was held constant at 100 μM.
TABLE 2.
Glutaminase kinetic parameters
| Mutation | Km, basal* | kcat | kcat/Km |
|---|---|---|---|
| Wild-type | 4.7 ± 0.2 | 5.5 ± 0.1 × 10⁻³ | 1.18 ± 0.06 |
| R5A (R239A) | 2.3 ± 0.6 | 1.4 ± 0.1 × 10⁻³ | 0.6 ± 0.03 |
| K99A (K360A) | 4.4 ± 0.1 | 0.24 ± 0.1 × 10⁻³ | 0.45 ± 0.06 |
| Mutation | Km, half-reaction† | kcat | kcat/Km |
| Wild-type | 1.2 ± 0.1 | 6.8 ± 0.2 | 5.8 ± 0.8 × 10³ |
| R5A (R239A) | 0.35 ± 0.02 | 0.180 ± 0.001 | 5.2 ± 0.5 × 10² |
| K99A (K360A) | 1.9 ± 0.3 | 7.8 ± 0.6 | 4.1 ± 0.8 × 10³ |
| Y138F (Y144F) | 2.0 ± 0.5 | 2.1 ± 0.1 | 1.0 ± 0.3 × 10³ |
Data for wild-type, R5A, and K99A were published previously in Myers et al. (27).
Glutamine hydrolysis in the absence of PRFAR.
Glutamine was the varied substrate and the concentration of PRFAR was held constant at 100 μM.
Steered molecular dynamics
We pulled water and ammonia through the side-opening and channel with constant-velocity SMD (54) at a speed of 5 Å/ns. Each pulling run took ∼3 ns. Ammonia was pulled through the channel 10 times, and a water molecule was pulled through the channel three times. The SMD simulations were performed using NAMD2 in the NVT ensemble. The choice of pulling velocity is consistent with a recent recommendation that fewer, slow trajectories give more accurate estimates for free energy profiles reconstructed with Jarzynski's identity (55). The time-dependent external force is added to the system's original Hamiltonian:
 |
where v is the velocity of the harmonic constraint used to pull the water, z0 is the initial position of the center of mass of the water molecule, and z(x) is the position of the center of mass of the water molecule at time t. For all simulations, we chose a harmonic constraint of k = 150 pN/Å, which is stiff enough to constrain the water molecule along the channel reaction path while simultaneously allowing it to interact with its environment. Jarzynski's identity,
 |
can be used to extract equilibrium free energy information from these repeated nonequilibrium pulling simulations, where the averaged work is actually the total work minus the instantaneous biasing potential
 |
(56,57). The free energy profile along the channel reaction coordinate can ultimately be reconstructed following the methods in Jensen et al. (58), which pioneered the use of the second-order cumulant expansion to approximate the exponential average (29). The use of the second-order cumulant in the reconstruction of free energy profiles and Jarzynski's identity has been the subject of several recent articles (59,60,55).
As the free energy calculations are computationally intensive, we do not seek to reconstruct the free energy profiles for each scenario considered. Instead, we use the force curves and barriers from the previously resolved free energy profile along the channel as a reference point, and compare representative force curves from each new scenario to them (30,29).
RESULTS
General features of the interface
One of the challenges of studying multidomain proteins is accurately visualizing and describing their interfaces. In the case of IGP synthase, a close inspection of the interface, coupled with a bioinformatics analysis, reveals that it is lined with conserved residues from both subunits. Conserved hisH residues lining the interface are M121 (I122), W123 (W124), and Y138 (Y144F) and K181 (K196); hisF residues are R5 (R239), E46 (E293), P76 (P326), D98 (D359), Q123 (Q397), E167 (E465), P197 (P495), and E219 (E518) (Fig. 2). The covalently bound substrate in hisH also helps to seal the interface and forms part of the lining of chamber I. Complementary electrostatically charged surfaces of the two domains on their respective docking sides ensures strong, favorable electrostatic interactions between the subunits, and the ruggedness of these surfaces indicates a strong “geometric fit” (Fig. 3). The geometric fit measured by van der Waals interaction energy and the electrostatic interaction energy between the two subunits are both funneled (unpublished results). Additionally, there are at least two strictly conserved interdomain contacts between the glutaminase and synthase domains: a cation-π interaction formed between residues W123 (W124) of hisH and R249 (R548) of hisF and a conserved salt bridge between K181 (K196) of hisH and D98 (D359) of hisF (Fig. 1). This salt bridge has recently been implicated as being a key signaling element between the two domains and may also serve as a paradigm for communication among the triad GATase subfamily of enzymes (28). To date, the system has been subject to over 100 ns of simulation, and never once in any of these simulations have either of these two conserved contacts been disrupted. It is also important to note that although many of the mutations allowed direct access of the putative ammonia channel to bulk solvent, no major structural rearrangements were seen in any of the mutant systems over the 100 ns.
FIGURE 3.

The electrostatic potential at the docking sides of the glutaminase domain (hisH, left) and the synthase domain (hisF, right) are shown. The electrostatic maps were determined with DelPhi v. 4 (69), with charges assigned from CHARMM27 using a dielectric constant of 2.0 in the interior of the protein and 78 outside. The pictures were created with GRASP (70) and the potential values are described in the colored bar at the top. The electrostatic surfaces are highly complementary, and the ruggedness of each surface indicates a tight geometric fit.
Water at the interface
MD simulations allow us to monitor the dynamic behavior of water (e.g., residence times, single molecule tracking) at various positions within the proteins and at the interface. Recently, several investigations have used MD to gain insight into various dynamic roles of water, including the behavior of water in and around acetylcholinesterase (61), water permeation through aquaporins (62), and the role of water molecules at the interface of cytochrome C and the reaction center (63). In the case of IGP synthase, by carefully monitoring the behavior of water at the interface during the equilibrium MD simulations, we have discovered that the interface has two very different moieties. The strictly conserved tyrosine, Y138 (Y144), protrudes into the interface and divides the interface into two sides, each of which has distinct character (Fig. 1). One side of the interface, nearest to R5 (R239) and adjacent to the interdomain hinge, is accessible to bulk solvent; the other side of the interface forms a protected cavity (chamber I) that leads from the glutaminase active site to the mouth of the (β/α)8 barrel (Fig. 2). Within the exposed side of the interface, bulk water molecules quickly exchange with crystallographic water molecules and bombard the conserved wall of residues throughout the equilibrium MD simulations. The residence times of the water molecules in the exposed region are ∼100–300 ps. Conversely, on the side of the interface where chamber I resides, there is virtually no exchange of the crystallographic water molecules with bulk solvent, thus providing ammonia a protected path leading from the glutaminase active site and into the (β/α)8 barrel. The exact number of water molecules within chamber I varies depending on the crystal structure, but typically there are between four and six crystallographically resolved water molecules, most of which are solvating residues near the glutaminase active site. In the equilibration of the wild-type system, the water molecules within chamber I, having residence times on the order of nanoseconds, are highly ordered and do not undergo major shifts in position. The experimental kinetic analyses and MD simulations present compelling evidence that key conserved residues at the interface are designed to form a wall which prevents the penetration of bulk water molecules into chambers I and II (Fig. 1). Our results conclusively indicate that mutating several key residues drastically affects the delicate balance of water within the protein and ammonia channel, thereby disrupting the passage of ammonia between the two active sites.
Interface mutation Y138F (Y144F)
Y138 (Y144) is a strictly conserved residue just above the plane of the gate, near the geometric center of the barrel opening. The conservation of this residue and its close proximity to the electrostatic quartet implicated the hydroxyl group of Y138 (Y144) as being involved in a gate-opening mechanism (16). Earlier simulations of the apo-complex (i.e., no bound substrates) with an open gate conformation that involved a fixed hydrogen bond between Y138 and a rotamer of K99, showed that it was indeed energetically feasible for ammonia to pass through the opening (29). More recently, however, simulations of the complex with bound substrates showed an increase in the barrier to ammonia entry through that open configuration (30). Electrostatic calculations indicated that the presence of PRFAR induces a large change in the electrostatic field within the channel and interface of IGP synthase. The reorientation of the ammonia dipole moment necessary for it to pass through the open gate is in opposition to the local PRFAR-induced electrostatic gradient, thus the barrier to ammonia entry through the partially open gate conformation was higher with substrates included. Within the barrel, however, the forces required to pull ammonia were actually lower, suggesting that the electrostatic field generated by PRFAR actually assists the conduction of ammonia (30).
Experimental kinetic analyses revealed that when Y138 was mutated to phenylalanine, the stoichiometry (Table 3) and kinetic constants (Tables 1,2) for both reactions remained nearly unchanged. This is a clear indication that the hydroxyl group of the tyrosine is not necessary for proper enzymatic function. It is unlikely, therefore, that this residue participates in any gate-opening mechanism. A close examination of the crystal structures and the wild-type MD simulations reveals that Y138 is a key residue lining the exposed side of the interface. The fact that no loss in protein function occurred with the Y138F mutation indicates that the main function of this residue is to prevent bulk water from entering the interface during the reaction and keep ammonia sequestered within the intermolecular channel.
TABLE 3.
Stoichiometry of reaction Glu/IGP turnover
| Mutation | Glu/IGP ratio |
|---|---|
| Wild-type | 1:1 |
| R5A (R239A) | 122:1 |
| K99A (K360A) | 3:1 |
| Y138F (Y144F) | 1:1 |
Measuring the ratio of glutamate produced to imidazole glycerol phosphate allows one to monitor the stoichiometry of the two reactions. Data for wild-type, R5A, and K99A were published previously in Myers et al. (27).
The mutagenic kinetic analyses and computational studies for three additional conserved residues lining the interface, K181 (K196), D98 (D359), and Q123 (Q387) are presented in Myers et al. (28). The results from that study indicate that their presence is important for proper function and reaction coupling. This corroborates the basic principle we assert here, that mutating any of the residues lining chamber I compromises the structural integrity of the ammonia channel and therefore decouples the two reactions.
Gate mutation R5A (R239A)
The R5A (R239A) mutation creates a large hole in the exposed side of the interface (Fig. 4). After only 100 ps, water molecules rush in to chamber II and the region remains solvated for the rest of the 2-ns equilibration. By comparison, in the wild-type simulations, R5 and its interactions with neighboring residues physically block water molecules from entering chamber II. Already previous simulations in which the gate was forced open allowed waters to access chamber II; these additional water molecules increased the energetic barrier to ammonia entry and passage through the channel by forming a tight hydrogen bonding network which occluded ammonia (30). These observations are consistent with experimental results indicating the R239A mutant results in a 103 decrease in kcat/Km values for the cyclase reaction (Table 1; see also Klem et al. (23). The R5A mutation allows bulk water molecules to penetrate chamber II, thereby disrupting the passage of ammonia and destroying the tightly coupled reaction kinetics. The 122:1 stoichiometric increase in Glu/IGP products suggests loss of ammonia through this new hole (Table 3). In a related GATase, carbamoyl phosphate synthetase, there is an arginine residue which appears to play a similar role in forming a single amino-acid layer between the protected ammonia tunnel and bulk solvent. Mutational studies of conserved R265 in the Escherichia coli organism created a “leaky mutant”, which was only 50% competent in the subsequent reactions (64). In the present study, the major disruption in the overall reaction stoichiometry presents strong evidence for loss of ammonia through the hole created by the R5A mutation. The combined results of the simulations and kinetic analyses further suggest that the role of R5 is not to be an actual gate residue, but rather to act as a wall to exclude water from chamber II.
FIGURE 4.
Dynamic effects of mutations at the interface. Conserved hisH residues are shown in blue, and hisF in orange, in wireframe and licorice representations. The interdomain hinge, a cation-π interaction between W123 of hisH and R249 of hisF, is shown in blue and orange space-filling, respectively. (A) The R5A mutation creates a large hole in the interface near the mouth of the channel. (B) Bulk water molecules now penetrate the channel through this hole. (C and D) Top view of channel gate with K99A mutation in hisF; hisH is present in the simulations but omitted for clarity. (C) During the equilibration, E167 changes rotamer states and ammonia spontaneously enters chamber II. (D) After 20 ps, ammonia escapes back out of the channel.
Gate mutation K99A (K360A)
A structural analysis of this mutant shows the formation of a larger opening between chamber I and chamber II, and simultaneously deprives E167 and E46 of a salt-bridge partner (Fig. 4, C and D). Interestingly, in the simulations, after 200 ps of equilibration, E167 flips into an alternate rotamer state that allows it to form a salt bridge with the nearby conserved R117 (R111) of hisH. This marked the first time in any simulation that one of the residues in the electrostatic quartet spontaneously entered a rotamer state that broke the tight network of salt bridges. Without the stabilizing presence of K99, it is energetically more feasible for E167 to change orientations. It is important to note that the new rotamer state of E167 does not allow entrance of any bulk water molecules through the new hole created by the K99A mutation. Once ammonia diffused to within 3 Å of this residue, it spontaneously entered chamber II. Ammonia remained in chamber II for ∼20 ps before it escaped back out of the channel and into chamber I, where it diffused for the remaining 1500 ps of the 6-ns simulation.
Experimental kinetic studies of the cyclase reaction kinetics show that the K99A mutation results in a threefold decrease in the overall reaction stoichiometry (Table 3). The simulations and kinetic analyses strongly suggest that this lysine (and corresponding glutamate) control the passage of ammonia into the barrel. Although the K99A mutation facilitates the passage of ammonia into the channel, without the lysine side chain the ammonia diffuses more easily around the interface. This extended diffusive period decouples the two reactions to a small, yet measurable extent and may explain the stoichiometric disruption. Additional experimental results of a K99R mutation also corroborate the importance of this side chain; the replacement of the lysine with an arginine decreases the efficiency of the cyclase reaction, although the stoichiometry is not altered (27). This result suggests that the arginine can behave similarly to the lysine, thus trapping ammonia within chamber II and ensuring the proper coupling of the two reactions.
To test the ability of the side chain of K99 to retain ammonia within the channel, we then replaced the alanine with a lysine (i.e., returned the protein to its wild-type state) after ammonia had spontaneously entered the channel. Initially, and after extensive minimization, K99 is in an alternate rotamer state that allows a salt bridge with E167; E167, however, is also an alternate rotamer state allowing a salt bridge with R117. After 10 ps of equilibration, K99 and E167 move back to their original rotamer positions, reforming the intact electrostatic quartet. The movement of K99 back to its original rotamer state is faster than ammonia can exit the channel, therefore ammonia is trapped in chamber II by the side chain of K99. The wild-type structure was equilibrated for an additional 4 ns and during this entire simulation ammonia remained trapped inside chamber II, often making close contacts with the side chain of K99. These simulations, coupled with the kinetic analysis, implicate the long side chain of K99 (and by extension, K99R) and its ability to contain ammonia within the channel, as being key features of the reaction coupling mechanism.
Ammonia spontaneously takes side route into the channel
We performed extended MD equilibration runs of the wild-type protein with ammonia in various locations. In one 6-ns simulation with ammonia initially inside chamber II, the ammonia remains there for 4.5 ns, diffuses up through the side-opening presented in Fig. 5, crosses the plane of the gate into the chamber I, and returns back to chamber II. Comparatively, in all other simulations to date, ammonia has never spontaneously crossed through the center of the putative gate residues. The small side-opening between chambers I and II, through which ammonia spontaneously enters the hisF barrel, is lined by the conserved residues E46 (E295), D98 (D359), K99 (K360), and P76 (P326), and is directly adjacent to the geometric center of the barrel mouth (Fig. 5).
FIGURE 5.

The mouth of the hisF barrel as seen from hisH; the strands lining the barrel and the electrostatic quartet are shown. (A) Ammonia freely diffuses in chamber I. (B) Ammonia spontaneously passes between chamber I and II, through a side-opening between residues K99 and E46. Only a small fluctuation in the side-chain dihedral of K99, as depicted, is necessary for ammonia to pass. (C) Ammonia passes into chamber II.
The free diffusion of ammonia between the interface and the channel eliminates the need for an energetically costly gate-opening mechanism, and strongly suggests that the four strictly conserved gate residues are not meant to act as a gate but rather to act as one of the walls of the interface. For ammonia to pass between the two regions of the protein interface, the only requisite is the slight bending of the side chain of K99 (K360), a movement which is accessible through thermal motion, as indicated by the equilibrium MD simulations (Fig. 5).
A discriminating preference for ammonia
As there are water molecules present in all available crystal structures of IGP synthase (16,25,26), and water molecules are necessary for the enzymatic reactions at both active sites (35,24), it is well established that the interface and barrel end are not completely hydrophobic environments. Yet, intermediates of the histidine metabolic pathway, including PRFAR, are subject to hydrolytic events which shorten their respective half-lives in the cell (65), and the presence of water molecules near the interface and within the channel may compete against ammonia for conduction through the channel (30). The enzyme appears to mitigate this contradictory behavior by maintaining a careful balance of the number of water molecules throughout the bifunctional complex. Does the channel also transport water molecules or is there some innate preference for the channel to transport ammonia? To answer this question we used SMD to probe the energetics of water conduction through the barrel.
A representative force curve shows the results of pulling a water molecule through the newly discovered side-opening and (β/α)8 barrel (Fig. 6). From a direct comparison of the force curves for water and ammonia, it is clear that there are noticeably higher barriers for pulling water through the channel versus ammonia. Although the major difference is found in the constriction region of the channel (i.e., as the water passes T78 (T328), Fig. 1 C), it is worth noting that there is a slight systematic increase in the force required to pull water through the entire (β/α)8 barrel. The higher partial charges on the TIP3 water hydrogens create a larger electrostatic interaction between water and the conserved polar residues lining the channel, thus making it energetically more costly to break the hydrogen bonds between them. The geometry of the water molecule is also more ideally suited for hydrogen bonding, particularly within the narrow channel. The higher force requirement for the channel to conduct water, as indicated by the SMD runs, indicates that the channel has been optimized to transport ammonia, and not water, and that the function of key conserved residues lining the channel is to provide and secure this preference. Considering it is energetically favorable to have one water molecule in chamber I, the preference to conduct ammonia may be a critical component of IGP synthase's overall reaction mechanism.
FIGURE 6.

Force versus position along the channel axis for the SMD pull of water (blue) versus ammonia (red) through the side opening and (β/α)8 barrel of hisF. The plane of the gate is at zero along the channel axis and denoted with a dotted vertical line; negative positions are located in chamber I. The solid horizontal line serves as reference for a force requirement of zero kcal/mol/Å. The barrier to entry through the side opening is similar for both small molecules; however, a larger barrier is experienced by water when it is pulled past the hydroxyl group of T78 (located at 3.4 Å along the channel axis; the other conserved polar residue, S101, is located at 7.4 Å). This plot indicates that water has a systematically higher force requirement to conduct through the constriction region of the barrel.
The forces required to pull ammonia through the side-opening are comparable to the forces required to pull ammonia through a putative open-gate configuration presented in Amaro and Luthey-Schulten (30), ∼2 kcal/mol/Å. Comparing the forces to the previously resolved free energy profile in Amaro et al. (29), we expect that the energetic barrier to ammonia entry through the side opening is also ∼2 kcal/mol. All previously considered open-gate conformations required a major reorganization of the electrostatic quartet residues, and the energy required to break the salt bridge network would have to be considered in addition to the energetic barrier of ammonia entry through the new conformation. The fact that the entry of ammonia through the side opening can occur without a significant reorganization of the electrostatic quartet residues, and that the simulations have shown that ammonia can access the side-opening between chambers I and II in equilibrium MD simulations, presents compelling evidence that there is no large-scale gate-opening mechanism.
Barrel mutation T78A
The free energy profile (29) and the described SMD simulations indicated that one of the largest barriers to ammonia conduction through the (β/α)8 barrel occurs at T78. This threonine is at the very top of the constriction region (Fig. 1 B). In all of the trajectories, ammonia interacts with T78 while it is in chamber II, and as ammonia passes through the constriction region, it must break the hydrogen bond it forms with T78. Typically, one or two water molecules diffuse up from the PRFAR cavity into the constriction region, and their presence helps ammonia break the hydrogen bond it has formed with T78; afterwards, ammonia continues through the barrel to the PRFAR cavity.
The results of the T78A mutation were sensitive to the number of water molecules within chamber II. With the T78A mutation and one water molecule in chamber II, ammonia spontaneously conducted through the channel. This marked the first time ammonia passed through the barrel without the application of any external force, and shows that in general, the conduction of ammonia through a hydrophobic channel will be faster than traversing through one that is even slightly polar. For the first 40 ps, ammonia remains within chamber II, and it interacts with the water molecule and the gate residues. At 40 ps, ammonia loses contact with the water molecule, enters the constriction region, and makes a hydrogen bond with S101 (S362), a strictly conserved residue at the top of the PRFAR cavity. From there, it quickly (within 10–20 ps) enters the PRFAR cavity and makes contact with PRFAR. The T78A mutation has two immediate energetic implications: it robs ammonia of its normal hydrogen bonding partner, thereby lowering the highest barrier present within the channel (29), and it also widens the constriction region, thus making the entry of ammonia into this region more favorable from an entropic standpoint. We expect that both of these factors are important aspects of the ammonia conduction process. In this mutant, the conduction of ammonia occurs on a timescale faster than any water molecule can diffuse up from the PRFAR cavity, so there are no additional water molecules (other than the single water molecule present in chamber II) assisting the conduction of ammonia in this mutant. (Trajectories of this mutant are available as Supplementary Material.) With no water in chamber II, ammonia remains trapped in chamber II for the entire 2-ns simulation. Without a water molecule to mediate the interactions, there are considerable favorable electrostatic interactions between ammonia and the four charged gate residues. In this sense, when there is a water molecule present in chamber II, it acts as a lubricant that promotes ammonia conduction through this region. Again, it is also of interest to note that during the 2-ns simulation of T78A, no water molecules diffuse up the (β/α)8 barrel. Therefore, regardless of the number of water molecules initially present in chamber II, the T78A mutation dramatically affects the behavior of water in the channel by preventing water molecules present in the PRFAR cavity from diffusing up the channel.
CONCLUSIONS
The interface of the two subdomains in IGP synthase has been optimized for one function: to pass ammonia from one remote active site to the other. Experimental and theoretical studies strongly suggest that ammonia, released within the active site of the glutaminase domain, can easily diffuse across the interface of the two proteins, enter the (β/α)8 barrel of the synthase domain, and diffuse to the subsequent substrate, PRFAR, where it acts as a nucleophile in the cyclase reaction. Experimental kinetic analyses and molecular dynamics simulations presented here reveal that key mutations along the interface destroy the carefully crafted architecture and allow bulk water to enter, consequently disrupting the overall reaction kinetics. The mutation of a conserved residue within the barrel (T78A), which previously presented the highest energetic barrier to ammonia passage through hisF, allowed a rapid and unhindered conduction of ammonia through the channel. Further mutagenic studies of key residues may be helpful; we posit that the mutation Y138A (Y144A) would allow water molecules to penetrate the channel, therefore causing a significant decrease in the efficiency of the synthase reaction. The stoichiometry of the tightly coupled reactions would also be disrupted, as ammonia would then be lost through the hole in the interface to the bulk solution.
Though much effort has gone into investigating possible gate-opening scenarios, extended MD simulations now indicate that ammonia can freely diffuse into the (β/α)8 barrel of the synthase domain via a small side opening between E46 (E293), K99 (K360), P76 (P326), and D98 (D359). As ammonia can access both cavities of the interface and channel without a major rearrangement of the salt-bridge network, the discovery of the side opening eliminates the need for an energetically costly gate-opening mechanism and simultaneously proposes a natural path for ammonia to traverse. Additional mutagenic studies could be performed to further test this model of ammonia transport, including the engineering of residues to block the ammonia conduction, such as T78F or P76F. The slightly higher forces needed to pull water through the channel, as compared to ammonia, observed in the MD simulations indicates that the hydrophobic nature of the constriction region has been optimized to preferentially conduct ammonia between the two active sites.
SUPPLEMENTARY MATERIAL
An online supplement to this article can be found by visiting BJ Online at http://www.biophysj.org.
Supplementary Material
Acknowledgments
We thank the Theoretical and Computational Biophysics Group at the Beckman Institute in Urbana, IL for many helpful discussions, especially: Emad Tajkhorshid for insight into the water behavior, Marcos Sotomayer for assistance with the HOLE program, and John Stone for help with the figures. Special thanks to Anurag Sethi for assistance with the hisF multiple sequence alignment. Molecular images were created with the graphics program VMD (45).
This work was funded by National Science Foundation grant No. MCB02-35144 and a National Resource Allocation Committee grant No. MCA03-50275, both to Z.L.S., as well as a National Institute of Health grant No. RO1 GM067195 to V.J.D.
APPENDIX
As the mutagenesis experiments were carried out on the eukaryotic yeast isoform and the MD simulations were performed on bacterial T. maritima, a sequence and structure alignment is provided in Figs. 7 and 8 and clearly shows the high degree of similarity between the two organisms. The sequence alignments were first performed by domain-of-life with ClustalW (66) and the final alignment by combining profiles. The provided alignments are sets selected by the QR method, which best represent the topology of the full phylogenetic tree for these proteins (67). The structural alignments were performed using STAMP (68) in VMD version 1.8.3 (45).
FIGURE 7.
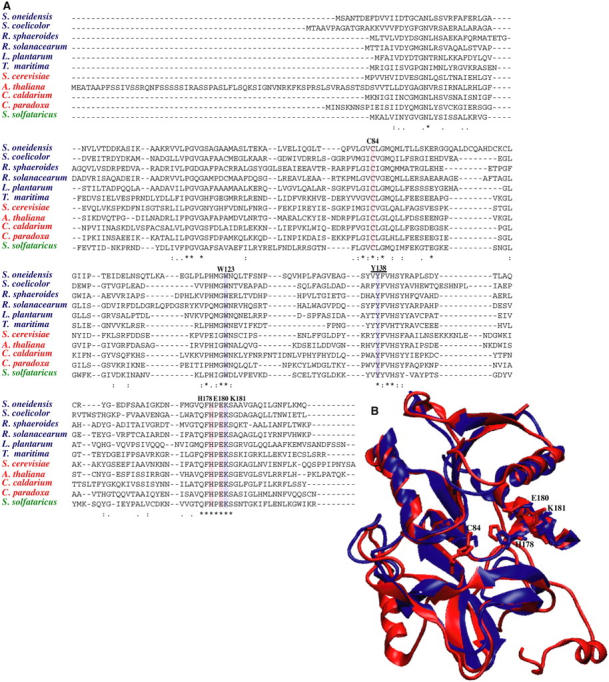
(A) HisH multiple sequence alignment. Strict conservation is denoted by an asterisk (*) and partial conservation by either a colon (:) or a dot (.). Active site residues are highlighted in red, other conserved residues of interest in lavender, and experimentally mutated Y138 is underlined. Numbering corresponds to T. maritima; sequences from eukarya are in red, bacteria are blue, and archaea in green. (B) Structural alignment of yeast (red) and T. maritima (blue) crystal structures indicates high structural homology between the two isoforms, despite insertions in yeast. Conserved residues are shown in licorice and overall RMSD is 1.86 Å.
FIGURE 8.
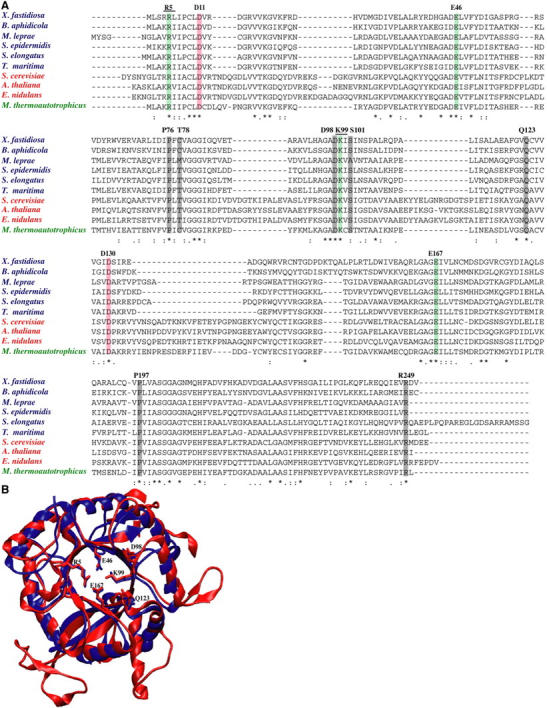
(A) HisF multiple sequence alignment. Strict conservation is denoted by an asterisk (*) and partial conservation by either a colon (:) or a dot (.). Active site residues are highlighted in red, the electrostatic quartet in green, other conserved residues of interest in shaded representation, and experimentally mutated residues are underlined. Numbering corresponds to T. maritima; sequences from eukarya are in red, bacteria are blue, and archaea in green. (B) Structural alignment of yeast (red) and T. maritima (blue) crystal structures indicates high structural homology between the two isoforms, despite insertions in yeast. Conserved residues are shown in licorice and overall RMSD is 1.57 Å.
Rommie E. Amaro and Rebecca S. Myers contributed equally to this work.
References
- 1.White, H. B. 1976. Coenzymes as fossils of an earlier metabolic state. J. Mol. Evol. 7:101–117. [DOI] [PubMed] [Google Scholar]
- 2.Fani, R., P. Lio, and A. Lazcano. 1995. Molecular evolution of the histidine biosynthetic pathway. J. Mol. Evol. 41:760–774. [DOI] [PubMed] [Google Scholar]
- 3.Ames, B. 1955. The biosynthesis of histidine. In Amino Acid Metabolism. W.D. McElroy and B. Glass, editors. Johns Hopkins Press, Baltimore, MD. 357–372.
- 4.Fani, R., E. Mori, E. Tamburini, and A. Lazcano. 1998. Evolution of the structure and chromosomal distribution of histidine biosynthetic genes. Orig. Life Evol. Biosph. 28:555–570. [DOI] [PubMed] [Google Scholar]
- 5.Ames, B. N., and B. Garry. 1959. Coordinate repression of the synthesis of four histidine biosynthetic enzymes by histidine. Proc. Natl. Acad. Sci. USA. 45:1453–1461. [DOI] [PMC free article] [PubMed] [Google Scholar]
- 6.Jacob, F., and J. Monod. 1961. Genetic regulatory mechanisms in the synthesis of proteins. Cold Spring Harb. Symp. Quant. Biol. 26:318–356. [Google Scholar]
- 7.Ames, B., P. Hartman, and F. Jacob. 1963. Chromosomal alterations affecting the regulation of histidine biosynthetic enzymes in Salmonella. J. Mol. Biol. 7:23–42. [DOI] [PubMed] [Google Scholar]
- 8.Kasai, T. 1976. Regulation of the expression of the histidine operon in Salmonella typhimurium. Nature. 249:523–527. [DOI] [PubMed] [Google Scholar]
- 9.Lazcano, A., and S. L. Miller. 1999. On the origin of metabolic pathways. J. Mol. Evol. 49:424–431. [PubMed] [Google Scholar]
- 10.Lang, D., R. Thoma, M. Henn-Sax, R. Sterner, and M. Wilmanns. 2000. Structural evidence for evolution of the (β/α)8 barrel scaffold by gene duplication and fusion. Science. 289:1546–1550. [DOI] [PubMed] [Google Scholar]
- 11.Höcker, B., J. Claren, and R. Sterner. 2004. Mimicking enzyme evolution by generating new (βα)8-barrels from (βα)4-half-barrels. Proc. Natl. Acad. Sci. USA. 101:16448–16453. [DOI] [PMC free article] [PubMed] [Google Scholar]
- 12.Ames, B., R. G. Martin, and B. Garry. 1961. The first step of histidine biosynthesis. J. Biol. Chem. 236:2019–2026. [PubMed] [Google Scholar]
- 13.Mandelstam, J., K. McQuillen, and I. Dawes. 1982. Biochemistry of Bacterial Growth. John Wiley & Sons, New York.
- 14.Atkinson, D. 1968. Energy charge of the adenylate pool as a regulatory parameter: interaction with feedback modifiers. Biochemistry. 7:4030–4034. [DOI] [PubMed] [Google Scholar]
- 15.Sissler, M., C. Delorme, J. Bond, S. D. Ehrlich, P. Renault, and C. Francklyn. 1999. An aminoacyl-tRNA synthetase paralog with a catalytic role in histidine biosynthesis. Proc. Natl. Acad. Sci. USA. 96:8985–8990. [DOI] [PMC free article] [PubMed] [Google Scholar]
- 16.Chaudhuri, B., S. Lange, R. Myers, S. Chittur, V. J. Davisson, and J. L. Smith. 2001. Crystal structure of imidazole glycerol phosphate synthase: a tunnel through a (β/α)8 barrel joins two active sites. Structure. 9:987–997. [PubMed] [Google Scholar]
- 17.Sinha, S. C., B. N. Chaudhuri, J. W. Burgner, G. Yakovleva, V. J. Davisson, and J. L. Smith. 2004. Crystal structure of imidazole glycerol-phosphate dehydratase: duplication of an unusual fold. J. Biol. Chem. 279:15491–15498. [DOI] [PubMed] [Google Scholar]
- 18.Wycisk, K., E. J. Kim, J. I. Schroeder, and U. Kramer. 2004. Enhancing the first step in the histidine biosynthesis pathway increases the free histidine pool and nickel tolerance in Arabidopsis thaliana. FEBS Lett. 578:128–134. [DOI] [PubMed] [Google Scholar]
- 19.Tesmer, J. J., T. J. Klem, M. L. Deras, V. J. Davisson, and J. L. Smith. 1996. The crystal structure of GMP synthetase reveals a novel catalytic triad and is a structural paradigm for two enzyme families. Nat. Struct. Biol. 3:74–86. [DOI] [PubMed] [Google Scholar]
- 20.Raushel, F. M., J. B. Thoden, and H. M. Holden. 1999. The amidotransferase family of enzymes: molecular machines for the production and delivery of ammonia. Biochemistry. 38:7891–7899. [DOI] [PubMed] [Google Scholar]
- 21.Mullins, L. S., and F. M. Raushel. 1999. Channeling of ammonia through the intermolecular tunnel contained within carbamoyl phosphate synthetase. J. Am. Chem. Soc. 121:3803–3804. [Google Scholar]
- 22.Klem, T., and V. Davisson. 1993. Imidazole glycerol phosphate synthase: the glutamine amidotransferase in histidine biosynthesis. Biochemistry. 32:5177–5186. [DOI] [PubMed] [Google Scholar]
- 23.Klem, T. J., Y. Chen, and V. J. Davisson. 2001. Subunit interactions and glutamine utilization by Escherichia coli imidazole glycerol phosphate synthase. J. Bacteriol. 183:989–996. [DOI] [PMC free article] [PubMed] [Google Scholar]
- 24.Beismann-Driemeyer, S., and R. Sterner. 2001. Imidazole glycerol phosphate synthase from Thermatoga maritima. J. Biol. Chem. 276:20387–20396. [DOI] [PubMed] [Google Scholar]
- 25.Douangamath, A., M. Walker, S. Beismann-Driemeyer, M. Vega-Fernandez, R. Sterner, and M. Wilmanns. 2002. Structural evidence for ammonia tunneling across the (β/α)8 barrel of imidazole glycerol phosphate synthase bienzyme complex. Structure. 10:185–193. [DOI] [PubMed] [Google Scholar]
- 26.Chaudhuri, B. N., S. C. Lange, R. S. Myers, V. J. Davisson, and J. L. Smith. 2003. Toward understanding the mechanism of the complex cyclization reaction catalyzed by imidazole glycerolphosphate synthase: crystal structures of a ternary complex and the free enzyme. Biochemistry. 42:7003–7012. [DOI] [PubMed] [Google Scholar]
- 27.Myers, R., J. Jensen, I. Deras, J. Smith, and V. J. Davisson. 2003. Substrate-induced changes in the ammonia channel for imidazole glycerol phosphate synthase. Biochemistry. 42:7013–7022. [DOI] [PubMed] [Google Scholar]
- 28.Myers, R., R. Amaro, Z. Luthey-Schulten, and V. J. Davisson. 2005. Reaction coupling through interdomain contacts in imidazole glycerol phosphate synthase. Biochemistry. Accepted, in revision. [DOI] [PubMed]
- 29.Amaro, R., E. Tajkhorshid, and Z. Luthey-Schulten. 2003. Developing an energy landscape for the novel function of a (β/α)8 barrel: ammonia conduction through hisF. Proc. Natl. Acad. Sci. USA. 100:7599–7604. [DOI] [PMC free article] [PubMed] [Google Scholar]
- 30.Amaro, R., and Z. Luthey-Schulten. 2004. Molecular dynamics simulations of substrate channeling though an alpha-beta barrel protein. Chem. Phys. 307:147–155. [Google Scholar]
- 31.Gerlt, J. A., and P. C. Babbitt. 2001. Divergent evolution of enzymatic function: mechanistically diverse superfamilies and distinct superfamilies. Annu. Rev. Biochem. 70:209–246. [DOI] [PubMed] [Google Scholar]
- 32.Woese, C. R. 1987. Bacterial evolution. Microbiol. Rev. 51:221–271. [DOI] [PMC free article] [PubMed] [Google Scholar]
- 33.O'Donoghue, P., and Z. Luthey-Schulten. 2003. On the evolution of structure in the aminoacyl-tRNA synthetases. Microbiol. Mol. Biol. Rev. 67:550–573. [DOI] [PMC free article] [PubMed] [Google Scholar]
- 34.O'Donoghue, P., and Z. Luthey-Schulten. 2005. Evolutionary profiles derived from the QR factorization of multiple structural alignments gives an economy of information. J. Mol. Biol. 346:875–894. [DOI] [PubMed] [Google Scholar]
- 35.Thoden, J. B., X. Huang, F. M. Raushel, and H. M. Holden. 1999. The small subunit of carbamoyl phosphate synthetase: snapshots along the reaction pathway. Biochemistry. 38:16158–16166. [DOI] [PubMed] [Google Scholar]
- 36.Chittur, S., Y. Chen, and V. Davisson. 2000. Expression and purification of imidazole glycerol phosphate synthase from Saccharomyces cerevisiae. Protein Expr. Purif. 18:366–377. [DOI] [PubMed] [Google Scholar]
- 37.Hirschbein, B., F. P. Mazenod, and G. Whitesides. 1982. Synthesis of phosphoenolpyruvate and its use in adenosine triphosphate cofactor regeneration. J. Org. Chem. 47:3765–3766. [Google Scholar]
- 38.Kunkel, T. A. 1985. Rapid and efficient site-specific mutagenesis without phenotypic selection. Proc. Natl. Acad. Sci. USA. 82:97–102. [DOI] [PMC free article] [PubMed] [Google Scholar]
- 39.MacKerell, A. D., D. Bashford, M. Bellott, R. L. Dunbrack, J. D. Evanseck, M. J. Field, S. Fischer, J. Gao, H. G. S. Ha, D. Joseph-McCarthy, L. Kuchnir, K. Kuczera, F. T. K. L. C. Mattos, S. Michnick, T. Ngo, D. T. N. Yen, W. E. B. Prodhom, III, B. Roux, M. Schlenkrich, J. C. Smith, R. Stote, J. Straub, M. Watanabe, J. Wiorkiewicz-Kuczera, D. Yin, and M. Karplus. 1998. All-atom empirical potential for molecular modeling and dynamics studies of proteins. J. Phys. Chem. B. 102:3586–3616. [DOI] [PubMed] [Google Scholar]
- 40.MacKerell. A. 2003. Workshop on methods and applications of molecular dynamics to biopolymers. Http://www.psc.edu/general/software/packages/charmm/tutorial/index.html.
- 41.MacKerell, A. 2003. Parameterization of molecules for use of CHARMM. Http://www.psc.edu/general/software/packages/charmm/tutorial/mackerell/parameters.html.
- 42.Amaro, R., B. Daliwal, and Z. Luthey-Schulten. 2004. Parameterizing a novel residue. Http://www.ks.uiuc.edu/training/tutorials/.
- 43.Lide, D. R. 1994. CRC Handbook of Chemistry and Physics. CRC Press, Boca Raton, FL.
- 44.Grubmüller, H. 1996. Solvate, V. 1.0. Theoretical Biophysics Group, Institute for Medical Optics, Ludwig-Maximilians University, Munich, Germany.
- 45.Humphrey, W., A. Dalke, and K. Schulten. 1996. VMD—visual molecular dynamics. J. Mol. Graph. 14:33–38. [DOI] [PubMed] [Google Scholar]
- 46.Smart, O., J. Goodfellow, and B. Wallace. 1993. The pore dimensions of gramicidin A. Biophys. J. 65:2455–2460. [DOI] [PMC free article] [PubMed] [Google Scholar]
- 47.Weiner, P. K., and P. Kollman. 1981. AMBER: assisted model building with energy refinement. a general program for modeling molecules and their interactions. J. Comput. Chem. 2:287–303. [Google Scholar]
- 48.Feller, S., Z. Zhang, R. Pastor, and B. Brooks. 1995. Constant pressure molecular dynamics simulation: the Langevin piston method. J. Chem. Phys. 103:4613–4621. [Google Scholar]
- 49.Darden, T., D. York, and L. Pedersen. 1993. Particle mesh Ewald: an N·log(N) method for Ewald sums in large systems. J. Chem. Phys. 98:10089–10092. [Google Scholar]
- 50.Grubmüller, H., H. Heller, A. Windemuth, and K. Schulten. 1991. Generalized Verlet algorithm for efficient molecular dynamics simulations with long-range interactions. Mol. Sim. 6:121–142. [Google Scholar]
- 51.Schlick, T., R. Skeel, A. Brunger, L. Kale, J. A. Board, J. Hermans, and K. Schulten. 1999. Algorithmic challenges in computational molecular biophysics. J. Comput. Phys. 151:9–48. [Google Scholar]
- 52.Kale, L., R. Skeel, M. Bhandarkar, R. Brunner, A. Gursoy, N. Krawetz, J. Phillips, A. Shinozaki, K. Varadarajan, and K. Schulten. 1999. NAMD2: greater scalability for parallel molecular dynamics. J. Comput. Phys. 151:283–312. [Google Scholar]
- 53.Jorgensen, W. L., J. Chandrasekhar, J. D. Madura, R. W. Impey, and M. L. Klein. 1983. Comparison of simple potential functions for simulating liquid water. J. Chem. Phys. 79:926–935. [Google Scholar]
- 54.Isralewitz, B., J. Baudry, J. Gullingsrud, and D. K. Schulten. 2001. Steered molecular dynamics investigations of protein function. J. Mol. Graph. Model. 19:13–25. [DOI] [PubMed] [Google Scholar]
- 55.Park, S., and K. Schulten. 2004. Calculating potentials of mean force from molecular dynamics simulations. J. Chem. Phys. 120:5946–5961. [DOI] [PubMed] [Google Scholar]
- 56.Jarzynski, C. 1997. Equilibrium free-energy differences from nonequilibrium measurements: a master-equation approach. Phys. Rev. E. 56:5018–5035. [Google Scholar]
- 57.Jarzynski, C. 1997. Nonequilibrium equality for free energy differences. Phys. Rev. Lett. 78:2690–2693. [Google Scholar]
- 58.Jensen, M. O., S. Park, E. Tajkhorshid, and K. Schulten. 2002. Energetics of glycerol conduction through aquaglyceroporin GlpF. Proc. Natl. Acad. Sci. USA. 99:11175–11180. [DOI] [PMC free article] [PubMed] [Google Scholar]
- 59.Park, S., F. Khalili-Araghi, E. Tajkhorshid, and K. Schulten. 2003. Free energy calculation from steered molecular dynamics simulations using Jarzynski's identity. J. Chem. Phys. 119:3559–3566. [Google Scholar]
- 60.Gore, J., F. Ritort, and C. Bustamante. 2003. Bias and error in estimates of equilibrium free-energy differences from nonequilibrium measurements. Proc. Natl. Acad. Sci. USA. 100:12564–12569. [DOI] [PMC free article] [PubMed] [Google Scholar]
- 61.Henchman, R., and A. J. McCammon. 2002. Structural and dynamic properties of water around acetylcholinesterase. Protein Sci. 11:2080–2090. [DOI] [PMC free article] [PubMed] [Google Scholar]
- 62.Jensen, M. O., E. Tajkhorshid, and K. Schulten. 2003. Electrostatic tuning of permeation and selectivity in aquaporin water channels. Biophys. J. 85:2884–2899. [DOI] [PMC free article] [PubMed] [Google Scholar]
- 63.Autenrieth, F., E. Tajkhorshid, K. Schulten, and Z. Luthey-Schulten. 2004. Role of water in transient cytochrome c2 docking. J. Phys. Chem. B. 105:905–918. [Google Scholar]
- 64.Kim, J., and F. M. Raushel. 2004. Perforation of the tunnel wall in carbamoyl phosphate synthetase derails the passage of ammonia between sequential active sites. Biochemistry. 43:5334–5340. [DOI] [PubMed] [Google Scholar]
- 65.Davisson, V. J., I. L. Deras, S. E. Hamilton, and L. L. Moore. 1994. A plasmid-based approach for the synthesis of a histidine biosynthetic intermediate. J. Org. Chem. 59:137–143. [Google Scholar]
- 66.Thompson, J., D. Higgins, and T. Gibson. 1994. ClustalW: improving the sensitivity of progressive multiple sequence alignment through sequence weighting, position-specific gap penalties and weight matrix choice. Nucleic Acids Res. 22:4673–4680. [DOI] [PMC free article] [PubMed] [Google Scholar]
- 67.Sethi, A., P. O'Donoghue, and Z. Luthey-Schulten. 2005. Evolutionary profiles from the QR factorization of multiple sequence alignments. Proc. Natl. Acad. Sci. USA. 102:4045–4050. [DOI] [PMC free article] [PubMed] [Google Scholar]
- 68.Russel, R. B., and G. J. Barton. 1992. Multiple protein sequence alignment from tertiary structure comparison: assignment of global and residue confidence levels. Proteins Struct. Funct. Gen. 14:309–323. [DOI] [PubMed] [Google Scholar]
- 69.Rocchia, W., E. Alexov, and B. Honig. 2001. Extending the applicability of the nonlinear Poisson-Boltzmann equation: multiple dielectric constants and multivalent ions. J. Phys. Chem. B. 105:6507–6514. [Google Scholar]
- 70.Nicholls, A., K. Sharp, and B. Honig. 1991. Protein folding and association: insights from the interfacial and thermodynamic properties of hydrocarbons. Proteins. 11:281–296. [DOI] [PubMed] [Google Scholar]
Associated Data
This section collects any data citations, data availability statements, or supplementary materials included in this article.