Abstract
The behavior of freestanding lipid bilayer membranes under the influence of dielectric force potentials was studied by trapping, holding, and rotating individual giant unilamellar vesicles (GUVs) inside dielectrophoretic microfield cages. Using laser scanning confocal microscopy and three-dimensional image reconstructions of GUVs labeled with fluorescent membrane probes, field strength and frequency-dependent vesicle deformations were observed which are explained by calculations of the dielectric force potentials inside the cage. Dynamical membrane properties under the influence of the field cage were studied by fluorescence correlation spectroscopy, circumventing potential artifacts associated with measurements involving GUV immobilization on support surfaces. Lipid transport could be accelerated markedly by the applied fields, aided by hydrodynamic fluid streaming which was also studied by fluorescence correlation spectroscopy.
INTRODUCTION
Spatial heterogeneities in eukaryotic cell membranes have been implicated in many important biological functions, such as protein sorting, protein aggregation, signaling, and membrane fusion (1–3). Studies on model membranes have been essential in characterizing the phase behavior and diffusion dynamics of these sphingolipid/cholesterol-rich lipid domains (reviewed in London (4)), employing diverse biophysical techniques, including optical and atomic force microscopy, nuclear magnetic resonance, scanning calorimetry, x-ray diffraction, fluorescence quenching, fluorescence resonance energy transfer, fluorescence correlation spectroscopy (FCS), and others. FCS is a relatively nonperturbing spectroscopic technique that analyzes concentration fluctuations of fluorescent probes in an optical observation volume, thereby directly reporting on the diffusion behavior using only minimal fluorescent probe concentrations (5,6). It has been used to characterize the diffusion dynamics and lipid phase behavior of several cell and model membrane systems (7–11).
Dielectrophoretic microfield cages are useful tools for studying electrokinetic properties of membranes, and for manipulating individual cells and bioparticles (12,13). Deformation of liposomes in homogeneous ac electric fields was studied using a two-electrode arrangement (14), allowing an estimation of elastic membrane properties (15,16). Field-induced electrorotation of uni- to multilamellar liposomes has been demonstrated to obtain dielectric membrane parameters and to confirm single- and multishell dielectric models describing the ac electrokinetic behavior (17).
More recently, octode field cages were described for simultaneous caging and electrorotation, allowing for ligand-receptor interaction measurements on the single cell level (18). In combination with optical tweezers, contact-free and independent manipulation of two objects was demonstrated and applied to measurements of binding forces and three-dimensional calibration of the laser tweezer forces (18–20).
The comparatively high electric fields used in these studies are accompanied by strong field gradients across the membrane (MV/m) (21), raising questions whether the mobilities of lipids and other integral or membrane-bound molecules are affected, possibly even leading to lipid phase separation. FCS constitutes one potential tool to address these questions, provided the membrane is stabilized in space and the electric field across the membrane can be controlled. Because dielectric objects like liposomes experience ponderomotive (dielectrophoretic) forces in inhomogeneous electric fields, dielectrophoretic field cages with three-dimensional electrode arrangements can be used to produce closed potential walls, enabling the required defined particle confinement and simultaneous induction of transmembrane potentials (22,23).
In this study, confocal laser scanning microscopy and FCS of fluorescent lipid probes was performed on individual giant unilamellar vesicles (GUVs) while trapped and held inside an octode dielectrophoretic microfield cage, thereby allowing measurements on lipid diffusion under the influence of transmembrane potentials and circumventing potential artifacts associated with the immobilization of GUVs on support surfaces. Field strength and frequency-dependent vesicle deformations were observed which are explained by calculations of the dielectric force potential inside the cage. Lipid transport could be accelerated markedly by the applied fields, aided by hydrodynamic fluid streaming which was also studied by FCS.
MATERIALS AND METHODS
Dielectrophoretic microfield cages (Evotec Technologies, Hamburg, Germany), controller components, fluid lines, and valves have been described in detail elsewhere (18). Briefly, the height of the fluidic chamber was 40 μm, with focusing electrodes upstream which allow for delivery of GUVs to the field cage. A 10-μl syringe (Hamilton, Bonaduz, Switzerland) was used in combination with a syringe pump (Harvard Apparatus, Holliston, MA) to provide the vesicle supply. A pump speed of 10 μl/h was found suitable for this purpose. The distance between opposing electrodes was also 40 μm. Schemes of the field cage with electrode assignments for the two operating modes (24), referred to as “ac” for object trapping and “rot” for rotation, are shown in Fig. 1, B and C. GUVs were stably trapped for several seconds before initiation of imaging or FCS measurements.
FIGURE 1.
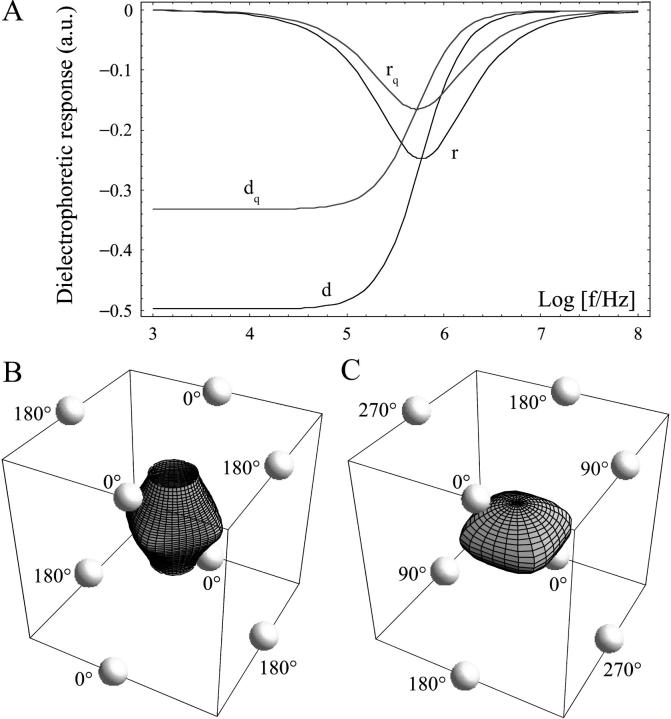
Dielectrophoretic responses and electrode phase assignments in microfield cages. (A) Real (d) and imaginary (r) part of the normalized complex polarizability (Clausius-Mossotti-factor) for GUVs. Since GUVs are not small compared to cage dimensions, quadrupole contributions are also shown (index q). GUVs were modeled as shelled spheres with the following parameters: diameter, 20 μm; shell thickness, 6 nm; shell permittivity, 8; shell conductivity, 1 μS/m; medium (internal) conductivity, 0.69 S/m (50 mM KCl); and medium permittivity, 78. A typical surface of constant mean-square electric field is shown for (B) ac and (C) rot electrode assignment modes.
Preparations of fluorescently labeled GUVs, confocal imaging, and three-dimensional image reconstructions were performed at room temperature (25°C) as described (8), using 10−4 mol % 1,1′-dieicosanyl-3,3,3′,3′-tetramethylindocarbocyanine perchlorate (diI-C20:0) as the fluorescent label. The GUV buffer was 5 mM PIPES (1,4-piperazinediethanesulfonic acid), pH 7.0, 50 mM KCl, and 1 mM EDTA. Unless noted otherwise, the lipid composition was 19.9 mol % dilauroyl phosphatidylcholine, 59.6% dipalmitoyl phosphatidylcholine (DPPC), and 20.5 mol % cholesterol, expected to yield GUVs of predominantly liquid-ordered (Lo) phase character (25). Metamorph 5.0 Software (Visitron, Puchheim, Germany) was used to calculate fluorescence intensities of the membrane from confocal images.
FCS was performed using the 488-nm line of an argon ion laser, overfilling a 60×, 1.2 NA water immersion microscope objective (Olympus UPlanApo, Melville, NY) on an upright microscope (BX50WI, Olympus) with combined widefield imaging and FCS capabilities described in detail elsewhere (26). All experiments were carried out at room temperature (25°C). An appropriate GUV (∼5–25 μm diameter) was first trapped by widefield illumination using a lens to provide a larger field of view. The lens was then removed to switch to the FCS mode, and the laser focus was positioned onto the top central membrane region of the GUV using an intensified CCD camera (Stanford Photonics, Palo Alto, CA). Excitation intensities at the sample were kept low at ∼500 W/cm2 to avoid a significant population of the triplet state. Fluorescence was collected by the same objective and passed through a dichroic mirror and emission filter (DCLP 488/NIR5 and HQ580/150, Chroma Technology, Bellows Falls, VT) to block reflected laser light before coupling into a 100-μm-core diameter fiber (OZ Optics, Carp, Ontario, Canada) connected to an avalanche photodiode (APDs, PE Optoelectronics, Fremont, CA) for autocorrelation recordings (Flex410R, Correlator.com, Bridgewater, NJ). FCS curves were fit to a model of two-dimensional diffusion using a least-square fit algorithm (Origin 6.1, Originlab, Northampton, MA) (8). For FCS studies involving electrohydrodynamic streaming, a model of three-dimensional diffusion and unidirectional translational flow was used (27,28).
The field cage was tested using 540/560 Fluosphere beads (4 μm, Molecular Probes, Eugene, OR). One-to-10 microliters of the stock suspension were sonicated in 1 ml of Cytocon buffer IV (Evotec, conductivity 1.4 S/m) for 5′ using a bath sonicator. The solution was diluted fourfold in 0.2 μm syringe-filtered Cytocon buffer I (Evotec, conductivity 0.03 S/m). For FCS measurements investigating hydrodynamic streaming, 100-nm beads (Molecular Probes 505/515), diluted 1:100 in GUV buffer, were used.
Theoretical
The time-averaged dielectrophoretic force,  acting on a spherical dielectric particle of radius, R, in a temporally periodic electric field with radian frequency ω,
  can be expressed using the dipole approximation as
 |
(1) |
where ɛl and fCM represent absolute permittivity of the liquid and Clausius-Mossotti-factor for the particle, respectively (for review, see Hughes (29)). For a homogeneous sphere (index p) suspended in a liquid (index l), it has been found to be
 |
(2) |
where σ represents the conductivity and ɛ the absolute permittivity (29). The torque is given by
 |
(3) |
Fig. 1, B and C, show typical surfaces of equal dielectric force potentials (E2) for ac and rotating octode dielectric field cages. Whereas for rotating mode the cage is closed, ac is open in the above dipole approximation.
Higher moments have to be considered if the induced dipole vanishes, e.g., due to electrode symmetry. For the quadrupole part (index q) of the dielectrophoretic force, Jones and Washizu found (30)
 |
(4) |
with
 |
(5) |
and Cartesian unity vectors eγ. In the ac electrode assignment mode (Fig. 1 B) and/or at sufficiently low or high frequencies, the nonpotential force part (proportional to the imaginary part of fCM) vanishes (Eqs. 1 and 4, Fig. 1 A). This results in movement and aggregation of small particles to clusters with a shape according to the E2 dependence (Fig. 2, C and F). Ideally (dipole approximation), no rotation is induced for particles trapped in the cage center. Larger objects surrounded by a membrane, such as cells and GUVs, are moved and centered inside the cage with an effective complex admittance, 
 |
(6) |
with  and shell (membrane) thickness h. The indices i and m refer to particle interior and membrane, respectively. Forces are higher at lower frequencies due to the low conducting membrane (Fig. 1 A). The dielectric spectra shift to higher frequencies as conductivities rise (not shown). Higher multipoles show a similar frequency dependency. GUVs are additionally deformed by the Maxwell tension acting on the membrane that is also proportional to E2,
 |
(7) |
FIGURE 2.
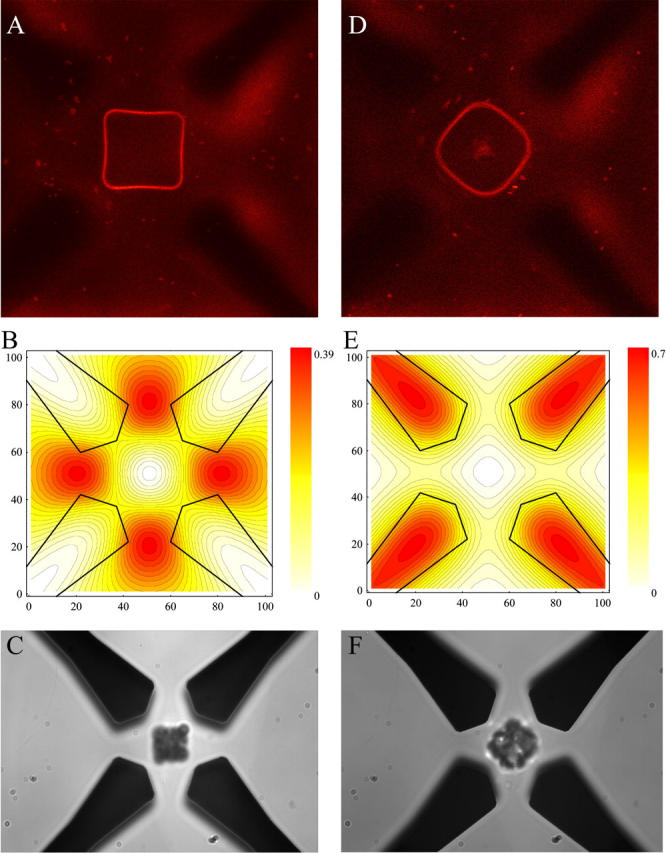
Trapping and electrorotation of GUVs and particles in the dielectric microfield cage. (A) Confocal image of the equatorial plane of a single trapped GUV, labeled with diI-C20:0. (B) Corresponding electrode outline and dielectric field potential in the central horizontal plane in units of the applied mean-square electric field. The difference between two contour lines corresponds to 2%. The dielectrophoretic response of latex particles is shown in C. The second column (D–F) shows images for rotating mode. The electrode voltage and frequency assignments were 4.4 Vrms and 0.75 MHz, respectively. The distance between opposing electrodes is 40 μm.
Resulting deformations can be calculated analytically, e.g., by minimizing the total energy (elastic plus electric) only in the simplest cases of homogeneous external fields and small deformations of spherical objects (31,32). For small forces, a linear dependency of deformation (elongation) on the square of Maxwell tension (square electric field) is to be expected, followed by a nonlinear regime at higher values (33).
Due to the complex electrode geometry and boundary conditions, there is no generic analytical solution for the electric field distribution of the dielectrophoretic field cages used here. Neglecting for simplicity nonpotential force contributions, the time-averaged dielectrophoretic force can be written as sum over the multipole force contributions (n),
 |
(8) |
with voltage V given as root mean-square value, coordinate x, and dimension of cage, d. The vector functions αn reflecting the geometric properties of the electrode configurations were determined using a finite difference method (Fig. 2, B and E), as described (34).
RESULTS
The octode dielectrophoretic field cage allowed for trapping, holding, and rotating of individual GUVs for long time-periods (up to several hours). Depending on the electrode assignments of electric field polarity, frequency, and phase shift, changes in the shape of the trapped GUV could be induced (Fig. 2). With a phase shift of 0° between the upper and lower electrode planes (ac-mode), the GUVs were forced into acquiring a stationary square-shaped equatorial region. With increasing GUV size, the observed membrane deformation was more pronounced (compare, e.g., the lower middle image of Fig. 4 A with the middle image of Fig. 4 B obtained under the same trapping conditions), correlating well with the corresponding calculated mean-square electric field-strength profile (dielectric pressure) (Fig. 2 B, Eq. 1). The profile was also confirmed by caging of latex beads (Fig. 2 C).
FIGURE 4.
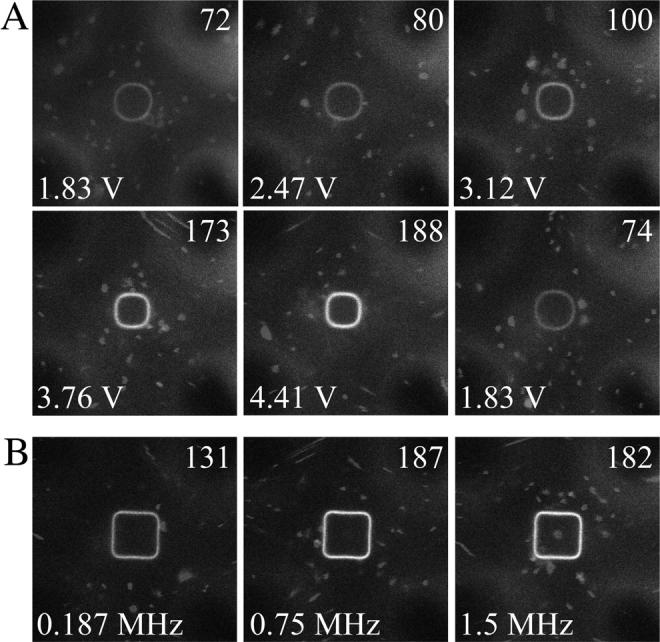
Voltage- and frequency-dependence on vesicle shape and brightness of diI-C20:0 in octopole field-cage trapped GUVs (ac-mode). (A) Voltage series at constant frequency of 0.75 MHz. The value of 1.8 Vrms is shown twice to demonstrate the reversibility of the fluorescence brightness change. (B) Frequency dependence at a constant voltage of 4.4 Vrms. The average membrane fluorescence intensity per pixel, measured across the entire membrane circumference, is given on the top right of each image as an 8-bit gray value.
A phase shift of 180° between both electrode planes (rot-mode) induced the rotation of the caged GUV around the optical axis of up to several Hz (Fig. 2 D). Ideally, no rotation is induced in field cages in rotation mode for objects trapped in the central horizontal plane (20). However, GUVs are not small compared to the electrode distance, leading to higher order multipole contributions (Fig. 1 A), resulting in similar electrorotational behavior as dipoles (17). The corresponding model calculation and bead experiment is shown for comparison in Fig. 2, E and F, demonstrating similar agreement with the theoretical understanding of the field cage in this regime.
Three-dimensional image reconstructions from confocal z-sections were generated to visualize the overall shape of the deformed trapped GUVs (Fig. 3). For the same field conditions, some heterogeneity in the degree of deformation was observed, most likely reflecting effects related to the size of the vesicle being exposed to different electric force potential shells, and compositional heterogeneities of individual GUVs in a given sample (35). For most GUVs, the pronounced square shape extended throughout most of the axial direction of the vesicle, ending with a relatively flat top and bottom membrane (Fig. 3 A, side view). These three-dimensional shapes correlate well with the calculated mean-square electric field (Fig. 1 B), with its open top and bottom surfaces closed by the stretched membrane. In some cases, the field-induced elongation of larger GUVs enhanced the flat top and bottom by contact with the upper and lower channel walls onto which the membrane was pressing. This was observed for ac-driving mode of the cage in accordance with numerical calculations shown Fig. 1 B. These cases were excluded from diffusion analysis (see below) to avoid potential artifacts from membrane/channel wall interactions. In some vesicles where the square was less pronounced, a more or less elliptical overall shape was observed throughout the axial direction (Fig. 3 B). By increasing the frequency (Fig. 1 A), forces could be reduced to allow trapping of GUVs inside the cage without inducing any perceptible shape change (see Fig. 3 C; the same can be obtained at low enough voltages).
FIGURE 3.
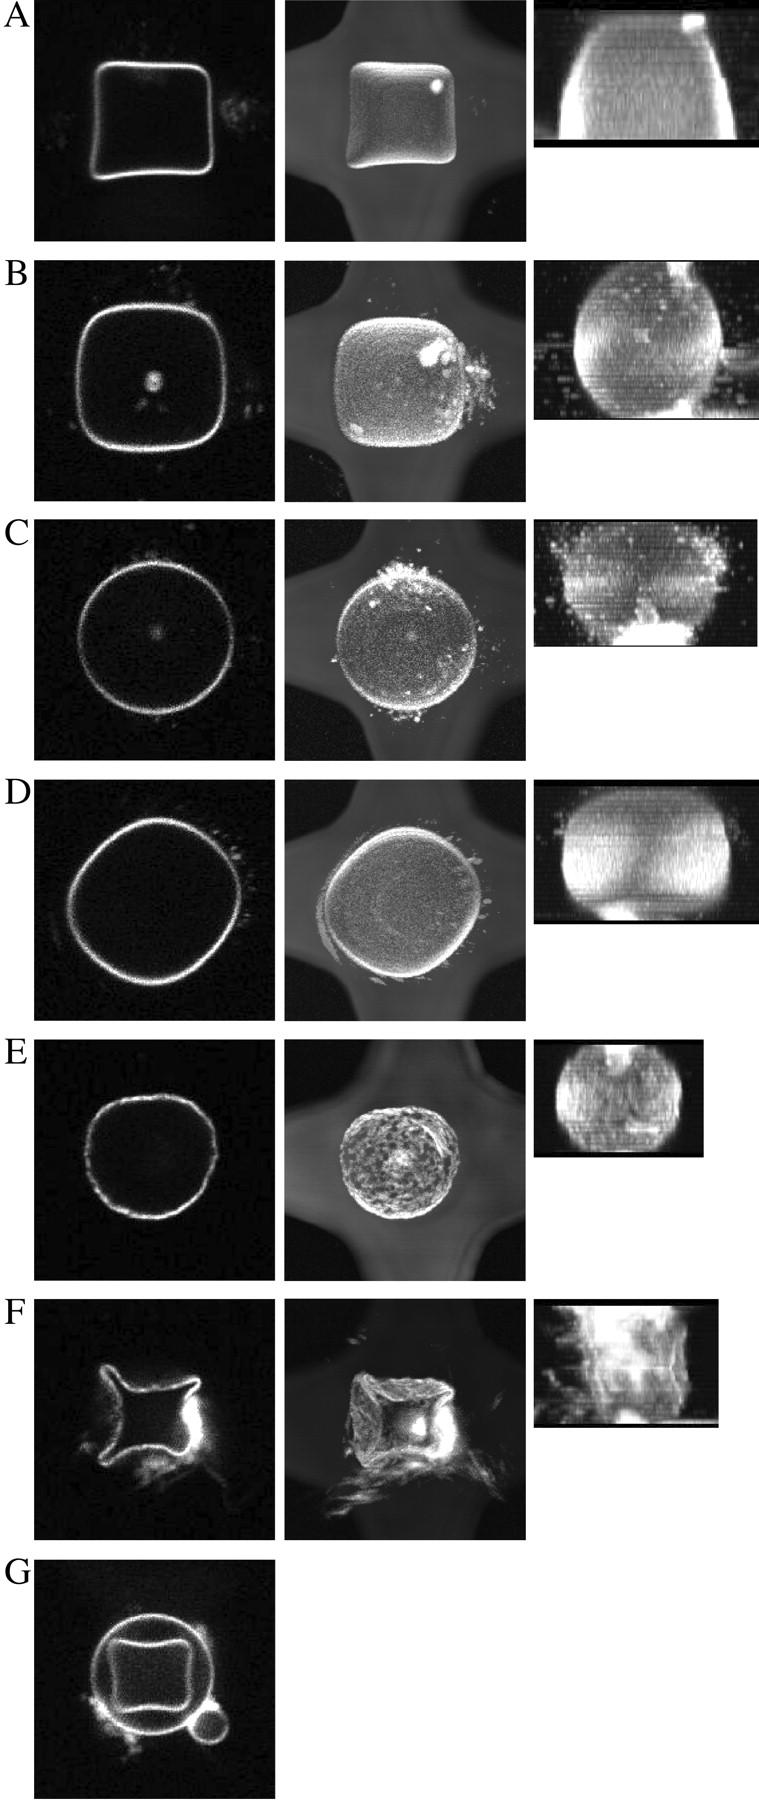
Three-dimensional image reconstructions of GUVs trapped and deformed in octode field cages. In each panel, the left image shows a confocal micrograph of the equatorial region, the central image shows the top-view projection of the upper half of the GUV, and the right image a side-view projection. GUVs shown in E and F were made from DPPC only. Field conditions were (A, B, E, and G) 1.8 Vrms, 0.187 MHz; (C) 2.5 Vrms, 0.75 MHz; (F) 4.4 Vrms, 0.187 MHz, all ac-mode; and (D) 2.5 Vrms, 0.187 MHz, rot-mode.
A compression of the vesicle in the axial direction is induced in the rotation mode (Fig. 3 D, side view), as expected from the simulation results (Fig. 1 C) (24). Although the overall GUV shape remained relatively constant during rotation, movement of membrane-associated small particulate material, visible as streaks in the confocal image, revealed the rotation of the entire vesicle around its axis.
GUVs with a high DPPC content required stronger fields for the same degree of deformation, consistent with a much higher membrane stiffness of the spatially ordered phase (36) (Fig. 3 E). Upon increasing the electric field strength, lipid material could not flow quickly enough to accommodate the shape of the dielectric force potential, so that rippling, and even breakage, of the vesicle occurred (Fig. 3 F)—reflecting a preference of this phase to bend into shapes with zero Gauss curvature (37).
A surprising example of the dependence of membrane deformation on composition is shown in Fig. 3 G, showing large differences in field-induced deformations for two concentric GUVs simultaneously present inside the cage. Because the dielectric field potentials predict a stronger deformation for larger vesicles, a compositional variability and higher membrane stiffness of the outer GUV could explain this observation.
A significant variation in the brightness of diI-C20:0 can be discerned by comparing Fig. 2, A and D. The dye response to different field cage conditions was studied on individual GUVs while trapped inside the cage. The brightness of diI increased markedly (up to ∼2.5-fold above 3 V) with increasing electric field strength (Fig. 4 A), but only slightly with frequency (Fig. 4 B). It was fully reversible (Fig. 4 A, last image) and essentially instantaneous relative to the acquisition rate of the confocal microscope (∼1 s).
Confocal images of caged GUVs (Figs. 2 and 4) display streaming of small particulate material which appears as streaks because of the laser scanning image acquisition. Although fluid velocity information can be obtained from these streaks, FCS measurements were carried out because they allow determinations of both bulk fluid flow (see below) and whether fluid transport influences diffusion properties in the membrane. FCS measurements were carried out on the top membrane surface, analogous to previously described FCS measurements of lipid probes in GUVs resting on a coverslip (8,9). A pronounced acceleration of molecular transport of diI-C20:0 was observed upon application of the electric field to trap the GUV (Fig. 5 A). Lipid transport was approximately twofold larger at voltages of 0.6–3 Vrms and remained fairly constant over this range (Fig. 5 B). Higher fields increased lipid transport more steeply, so that the translational velocities were over two orders-of-magnitude higher at ∼4.4 Vrms compared to the absence of a field.
FIGURE 5.
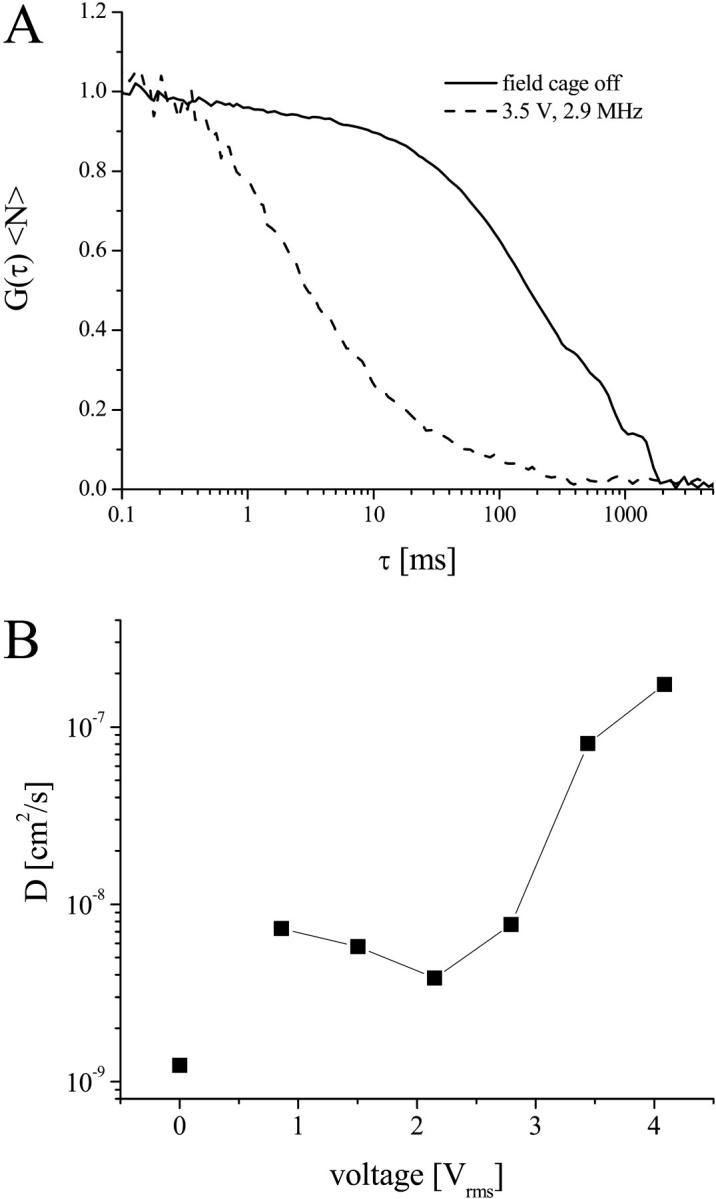
FCS on GUVs trapped in octode field cages. (A) FCS curves of diI-C20:0 in the absence (solid line) and presence (dashed line) of an electric field in the cage (3.5 Vrms, 2.9 MHz, ac-mode). (B) Diffusion coefficients as a function of electric field, determined from fits to FCS curves as shown in A to a model of two-dimensional translational diffusion. The 0 V data point was measured on the GUV after it had settled to the bottom wall of the chamber. The error on the determined diffusion coefficients was ∼20%.
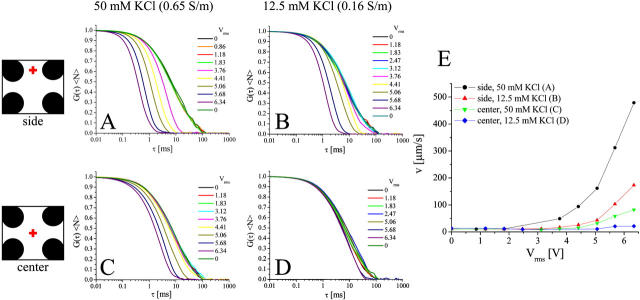
Electrohydrodynamically induced streaming as a function of position in the octode field cage was studied further by carrying out FCS measurements using fluorescent latex beads (Fig. 6). A timelapse microscopy video series of this effect is provided in the Supplementary Material. Both the position and the ionic strength had a large effect on the magnitude of hydrodynamic streaming. The effect was more pronounced between electrodes, compared with the center of the device, with maximum streaming velocities reaching ∼0.5 mm/s. Reduction in the ionic strength (∼fourfold) resulted in significantly weaker streaming so that cage-induced fluid transport in the center was minor under these conditions, up to 7 Vrms (Fig. 6 D). The field dependencies (Fig. 6 E) are qualitatively similar to the observed lipid probe transport dependence in the membrane (Fig. 5 B), suggesting that fluid flow provides the main contribution to the increased membrane mobilities.
FIGURE 6.
Hydrodynamic streaming as a function of electric field inside the octode cage, measured by FCS of 100-nm latex beads. The relative position of the focal volume with respect to the electrodes is indicated schematically: between the upper electrodes for A and B, cage center for C and D. The concentration of KCl was 50 mM (0.65 S/m) in A and C, and 12.5 mM (0.16 S/m) in B and D. In all cases, the frequency was 0.75 MHz, ac-mode. E shows fluid velocities determined from fitting the FCS curves for the four conditions.
DISCUSSION
The demonstration of trapping, deformation, and rotation of individual GUVs using octode dielectrophoretic microfield cages provides a valuable tool to study membranes under the controlled influence of an external electric field. The forces induced by the dielectric field cage are well-known and can be used for contact-free measurements of important parameters, such as membrane fluidity, bending moduli, and lipid phase dynamics (35). We show that the induced deformations correspond well with calculated electric field profiles in the cage, and that they depend on the size and composition of the GUVs. The study of field-induced changes in lipid diffusion relaxation rates (analogous to laser trap effects; see Kunst et al. (38)), possibly leading to phase separations, or dielectric characterization of membrane-bound molecules (39), is therefore possible.
A functional dependence of indocarbocyanine dye fluorescence on the transmembrane potential has been observed previously (40,41). It has also been reported that diI can respond rapidly (microsecond range) to pulsed electric fields (42,43). We present data in support of similar responses using high frequency oscillating electric fields. Because all measurements can be carried out on a single vesicle, dye concentration variations in different vesicles can be excluded to explain this dependence. Further studies are required to elucidate the mechanism of this brightness change. Toward this end, signals other than fluorescence could be utilized; for example, second harmonic generation for the deduction of membrane potentials or probe tilting angles in the membrane as a function of electric field strength (44).
The combination with simultaneous imaging and FCS is attractive for measurements of field-induced membrane morphology and diffusion dynamics of vesicles and cells suspended in solution, thereby ruling out potential artifacts arising from contact with detection probes or support surfaces. It should also be amenable to temperature control integration for the analysis of field-dependent temperature effects on membrane fluidity and phase behavior (45,46). As conductive media were used in these experiments, the temperature rise caused by electric heating has to be considered. The temperature increase in these dielectric field cages has been found to be approximately (47)
 |
(9) |
Here, σ and Vrms represent liquid conductivity and applied voltage, respectively. Due to the small cage dimensions thermal relaxation time is ≪1 s (47). FCS measurements were done under thermal steady state conditions exceeding these timescales (see Materials and Methods). According to Fig. 4, higher voltages yield higher fluorescence intensities. Since quantum yield is expected to decrease with rising temperature (48), an indirect temperature effect is more likely. For a typical voltage of 2.5 Vrms and a conductivity of 0.65 S/m (50 mM) used in the experiments described above, Eq. 7 predicts a temperature increase of ∼10 K, large enough to trigger phase transitions depending on the lipid composition. Temperature effects could therefore contribute to the observed brightness dependence of diI, a probe that is sensitive to the lipid phase type (G. Feigenson, Cornell University, personal communication), on the electric field conditions.
Lipid transport was accelerated drastically in the dielectrophoretic field cage, in this study by almost two orders of magnitude depending on the field and frequency conditions. Therefore, care has to be taken when working with cells or studying membrane properties which would be negatively affected by such changes. Conversely, it could advantageously be used to study effects of increased diffusional mixing of membrane compartments, or even to trigger cellular events.
Field-cage-induced fluid flow is the likely reason for lipid transport acceleration, which was found to be a function of field strength, frequency, position inside the cage, and buffer composition. Thus, hydrodynamic streaming has to be investigated in more detail to minimize its effects if undesired, and to increase vesicle stability for long-term FCS measurements. The dominant factor for streaming is caused by electrohydrodynamic pumping (49). As a function of field frequency, ideally no electrohydrodynamic pumping occurs at (50)
 |
(10) |
For aqueous solutions, f0 is ∼0.5σ/ɛ, resulting in much higher frequencies than experimentally accessible with the setup used (230 MHz at a conductivity of 0.16 S/m and 930 MHz for 0.65 S/m, respectively). Even if such high frequencies could be obtained, trapping would be hampered by the small dielectrophoretic responses under these conditions (Fig. 1 A). Lower conductivities should therefore be utilized in applications where electrohydrodynamic streaming is undesired (Fig. 6).
CONCLUSIONS
We present the use of dielectrophoretic field cages for the contact-free characterization of lipid bilayer membrane properties under the influence of high-frequency electric fields. Using individual GUVs trapped inside the cage, we observe size- and lipid composition-dependent membrane deformations which are in agreement with calculated electric field profiles. Changes in membrane shapes, phase behavior, or membrane potential could be measured using GUVs as a model system for cellular applications. The system is amenable to automation, and would therefore be compatible with medium- to high-throughput screening of compounds that alter membrane properties (51).
SUPPLEMENTARY MATERIAL
An online supplement to this article can be found by visiting BJ Online at http://www.biophysj.org.
Supplementary Material
Acknowledgments
We thank Dr. T. Baumgart for helpful discussions.
This research was performed in the Developmental Resource for Biophysical Imaging Opto-Electronics and was made possible by grant No. 9 P41 EB001976-16 from the National Institute of Biomedical Imaging and Bioengineering and the National Center for Research Resources, National Institutes of Health. C.R. is grateful to support from Dr. G. Fuhr, and SFB (SCHN 317/6-3) for funding.
J. Korlach's present address is Nanofluidics Inc., 1505 Adams Drive, Menlo Park, CA 94025.
C. Reichle's present address is Bundesministerium für Wirtschaft und Arbeit, Referat LP1-Presse, Scharnhorststr. 34-37, 10115 Berlin, Germany.
References
- 1.Simons, K., and D. Toomre. 2000. Lipid rafts and signal transduction. Nat. Rev. Mol. Cell Biol. 1:31–39. [DOI] [PubMed] [Google Scholar]
- 2.Simons, K., and E. Ikonen. 1997. Functional rafts in cell membranes. Nature. 387:569–572. [DOI] [PubMed] [Google Scholar]
- 3.Edidin, M. 1997. Lipid microdomains in cell surface membranes. Curr. Opin. Struct. Biol. 7:528–532. [DOI] [PubMed] [Google Scholar]
- 4.London, E. 2002. Insights into lipid raft structure and formation from experiments in model membranes. Curr. Opin. Struct. Biol. 12:480–486. [DOI] [PubMed] [Google Scholar]
- 5.Magde, D., E. L. Elson, and W. W. Webb. 1974. Fluorescence correlation spectroscopy. II. Experimental realization. Biopolymers. 13:29–61. [DOI] [PubMed] [Google Scholar]
- 6.Magde, D., W. W. Webb, and E. Elson. 1972. Thermodynamic fluctuations in a reacting system–measurement by fluorescence correlation spectroscopy. Phys. Rev. Lett. 29:705–708. [Google Scholar]
- 7.Larson, D. R., Y. M. Ma, V. M. Vogt, and W. W. Webb. 2003. Direct measurement of Gag-Gag interaction during retrovirus assembly with FRET and fluorescence correlation spectroscopy. J. Cell Biol. 162:1233–1244. [DOI] [PMC free article] [PubMed] [Google Scholar]
- 8.Korlach, J., P. Schwille, W. W. Webb, and G. W. Feigenson. 1999. Characterization of lipid bilayer phases by confocal microscopy and fluorescence correlation spectroscopy. Proc. Natl. Acad. Sci. USA. 96:8461–8466. [DOI] [PMC free article] [PubMed] [Google Scholar]
- 9.Schwille, P., J. Korlach, and W. W. Webb. 1999. Fluorescence correlation spectroscopy with single-molecule sensitivity on cell and model membranes. Cytometry. 36:176–182. [DOI] [PubMed] [Google Scholar]
- 10.Kahya, N., D. A. Wiersma, B. Poolman, and D. Hoekstra. 2002. Spatial organization of bacteriorhodopsin in model membranes. Light-induced mobility changes. J. Biol. Chem. 277:39304–39311. [DOI] [PubMed] [Google Scholar]
- 11.Kahya, N., D. Scherfeld, K. Bacia, B. Poolman, and P. Schwille. 2003. Probing lipid mobility of raft-exhibiting model membranes by fluorescence correlation spectroscopy. J. Biol. Chem. 278:28109–28115. [DOI] [PubMed] [Google Scholar]
- 12.Fuhr, G., T. Müller, T. Schnelle, R. Hagedorn, A. Voigt, S. Fiedler, W. M. Arnold, U. Zimmermann, B. Wagner, and A. Heuberger. 1994. Radiofrequency microtools for particle and live cell manipulation. Naturwissenschaften. 81:528–535. [DOI] [PubMed] [Google Scholar]
- 13.Zimmermann, U., and G. A. Neil. 1996. Electromanipulation of Cells. CRC Press, Boca Raton, FL.
- 14.Marszalek, P., and T. Y. Tsong. 1995. Cell fission and formation of mini cell-bodies by high-frequency alternating electric field. Biophys. J. 68:1218–1221. [DOI] [PMC free article] [PubMed] [Google Scholar]
- 15.Sukhorukov, V. L., H. Mussauer, and U. Zimmermann. 1998. The effect of electrical deformation forces on the electropermeabilization of erythrocyte membranes in low- and high-conductivity media. J. Membr. Biol. 163:235–245. [DOI] [PubMed] [Google Scholar]
- 16.Engelhardt, H., H. Gaub, and E. Sackmann. 1984. Viscoelastic properties of erythrocyte membranes in high-frequency electric fields. Nature. 307:378–380. [DOI] [PubMed] [Google Scholar]
- 17.Chan, K. L., P. R. C. Gascoyne, F. F. Becker, and R. Pethig. 1997. Electrorotation of liposomes: verification of dielectric multi-shell model for cells. Biochim. Biophys. Acta Lipids Lipid Metab. 1349:182–196. [DOI] [PMC free article] [PubMed] [Google Scholar]
- 18.Reichle, C., K. Sparbier, T. Müller, T. Schnelle, P. Walden, and G. Fuhr. 2001. Combined laser tweezers and dielectric field cage for the analysis of receptor-ligand interactions on single cells. Electrophoresis. 22:272–282. [DOI] [PubMed] [Google Scholar]
- 19.Reichle, C., T. Müller, T. Schnelle, and G. Fuhr. 1999. Electro-rotation in octopole micro cages. J. Phys. D Appl. Phys. 32:2128–2135. [Google Scholar]
- 20.Schnelle, T., T. Müller, C. Reichle, and G. Fuhr. 2000. Combined dielectrophoretic field cages and laser tweezers for electrorotation. Appl. Phys. B Lasers Opt. 70:267–274. [Google Scholar]
- 21.Zimmermann, U. 1982. Electric field-mediated fusion and related electrical phenomena. Biochim. Biophys. Acta. 694:227–277. [DOI] [PubMed] [Google Scholar]
- 22.Müller, T., G. Gradl, S. Howitz, S. Shirley, T. Schnelle, and G. Fuhr. 1999. A 3-D microelectrode system for handling and caging single cells and particles. Biosens. Bioelectron. 14:247–256. [Google Scholar]
- 23.Schnelle, T., R. Hagedorn, G. Fuhr, S. Fiedler, and T. Müller. 1993. Three-dimensional electric-field traps for manipulation of cells—calculation and experimental verification. Biochim. Biophys. Acta. 1157:127–140. [DOI] [PubMed] [Google Scholar]
- 24.Schnelle, T., T. Müller, and G. Fuhr. 2000. Trapping in AC octode field cages. J. Electrostat. 50:17–29. [Google Scholar]
- 25.Feigenson, G. W., and J. T. Buboltz. 2001. Ternary phase diagram of dipalmitoyl-PC/dilauroyl-PC/cholesterol: nanoscopic domain formation driven by cholesterol. Biophys. J. 80:2775–2788. [DOI] [PMC free article] [PubMed] [Google Scholar]
- 26.Foquet, M., J. Korlach, W. Zipfel, W. W. Webb, and H. G. Craighead. 2002. DNA fragment sizing by single molecule detection in submicrometer-sized closed fluidic channels. Anal. Chem. 74:1415–1422. [DOI] [PubMed] [Google Scholar]
- 27.Magde, D., and E. L. Elson. 1978. Fluorescence correlation spectroscopy. III. Uniform translation and laminar flow. Biopolymers. 17:361–376. [Google Scholar]
- 28.Foquet, M., J. Korlach, W. R. Zipfel, W. W. Webb, and H. G. Craighead. 2004. Focal volume confinement by submicrometer-sized fluidic channels. Anal. Chem. 76:1618–1626. [DOI] [PubMed] [Google Scholar]
- 29.Hughes, M. P. 2003. Nanoelectromechanics in Engineering and Biology. CRC Press, Boca Raton, FL.
- 30.Jones, T. B., and M. Washizu. 1994. Equilibria and dynamics of deep-levitated particles—multipolar theory. J. Electrostat. 33:199–212. [Google Scholar]
- 31.Winterhalter, M., and W. Helfrich. 1988. Deformation of spherical vesicles by electric fields. J. Colloid Interface Sci. 122:583–586. [Google Scholar]
- 32.Kummrow, M., and W. Helfrich. 1991. Deformation of giant lipid vesicles by electric fields. Phys. Rev. A. 44:8356–8360. [DOI] [PubMed] [Google Scholar]
- 33.Engelhardt, H., and E. Sackmann. 1988. On the measurement of shear elastic moduli and viscosities of erythrocyte plasma membranes by transient deformation in high frequency electric fields. Biophys. J. 54:495–508. [DOI] [PMC free article] [PubMed] [Google Scholar]
- 34.Schnelle, T., T. Müller, G. Gradl, S. G. Shirley, and G. Fuhr. 1999. Paired microelectrode system: dielectrophoretic particle sorting and force calibration. J. Electrostat. 47:121–132. [Google Scholar]
- 35.Baumgart, T., S. T. Hess, and W. W. Webb. 2003. Imaging coexisting fluid domains in biomembrane models coupling curvature and line tension. Nature. 425:821–824. [DOI] [PubMed] [Google Scholar]
- 36.Evans, E., and W. Rawicz. 1990. Entropy-driven tension and bending elasticity in condensed-fluid membranes. Phys. Rev. Lett. 64:2094–2097. [DOI] [PubMed] [Google Scholar]
- 37.Lipowsky, R., and R. Dimova. 2003. Domains in membranes and vesicles. J. Phys. Cond. Matter. 15:S31–S45. [Google Scholar]
- 38.Kunst, B. H., A. Schots, and A. J. Visser. 2002. Detection of flowing fluorescent particles in a microcapillary using fluorescence correlation spectroscopy. Anal. Chem. 74:5350–5357. [DOI] [PubMed] [Google Scholar]
- 39.Schnelle, T., T. Müller, and G. Fuhr. 1999. Dielectric single particle spectroscopy for measurement of dispersion. Med. Biol. Eng. Comput. 37:264–271. [DOI] [PubMed] [Google Scholar]
- 40.Freedman, J. C., and J. F. Hoffman. 1979. Relation between dicarbocyanine dye fluorescence and the membrane potential of human red blood cells set at varying Donnan equilibria. J. Gen. Physiol. 74:187–212. [DOI] [PMC free article] [PubMed] [Google Scholar]
- 41.Plasek, J., R. E. Dale, K. Sigler, and G. Laskay. 1994. Transmembrane potentials in cells: a diS-C3(3) assay for relative potentials as an indicator of real changes. Biochim. Biophys. Acta. 1196:181–190. [DOI] [PubMed] [Google Scholar]
- 42.Kakorin, S. A., T. Liese, and E. Neumann. 2003. Kinetics of optical membrane probes for lipid vesicle elongation and electroporation in high electric fields. Abstr. Papers Am. Chem. Soc. 225:U681. [Google Scholar]
- 43.Liese, T. 2002. The effect of the membrane curvature on the electroporative deformation of probe-marked lipid vesicles. Dissertation, Universität Bielefeldt, Germany.
- 44.Moreaux, L., O. Sandre, and J. Mertz. 2000. Membrane imaging by second-harmonic generation microscopy. J. Opt. Soc. Am. B Opt. Phys. 17:1685–1694. [Google Scholar]
- 45.Meleard, P., C. Gerbeaud, T. Pott, L. Fernandez-Puente, I. Bivas, M. D. Mitov, J. Dufourcq, and P. Bothorel. 1997. Bending elasticities of model membranes: influences of temperature and sterol content. Biophys. J. 72:2616–2629. [DOI] [PMC free article] [PubMed] [Google Scholar]
- 46.Mietchen, D., T. Schnelle, T. Müller, R. Hagedorn, and G. Fuhr. 2002. Automated dielectric single cell spectroscopy—temperature dependence of electrorotation. J. Phys. D Appl. Phys. 35:1258–1270. [Google Scholar]
- 47.Müller, T., A. Pfennig, P. Klein, G. Gradl, M. Jäger, and T. Schnelle. 2003. The potential of dielectrophoresis for single cell experiments. IEEE Eng. Med. Bio. 6:51–61. [DOI] [PubMed] [Google Scholar]
- 48.Lou, J. F., T. M. Finegan, P. Mohsen, T. A. Hatton, and P. E. Laibinis. 1999. Fluorescence-based thermometry: principles and applications. Rev. Anal. Chem. 18:235–284. [Google Scholar]
- 49.Melcher, J. R., and M. S. Firebaugh. 1967. Traveling-wave bulk electroconvection induced across a temperature gradient. Phys. Fluids. 10:1178–1185. [Google Scholar]
- 50.Ramos, A., H. Morgan, N. G. Green, and A. Castellanos. 1998. AC electrokinetics: a review of forces in microelectrode structures. J. Phys. D Appl. Phys. 31:2338–2353. [Google Scholar]
- 51.Reichle, C., T. Schnelle, T. Müller, T. Leya, and G. Fuhr. 2000. A new microsystem for automated electrorotation measurements using laser tweezers. Biochim. Biophys. Acta Bioenerg. 1459:218–229. [DOI] [PubMed] [Google Scholar]
Associated Data
This section collects any data citations, data availability statements, or supplementary materials included in this article.


