

Abstract
During the actin polymerization-based movement of Listeria monocytogenes, individual bacteria are rapidly propelled through the host cell cytoplasm by the growth of a filamentous actin tail. The rate of propulsion varies significantly among individuals and over time. To study this variation, we used a high-throughput tracking technique to record the movement of a large number (∼7900) of bacteria in Xenopus frog egg extract. Most bacteria (70%) appeared to maintain an individual characteristic speed over several minutes, suggesting that the major source of variation in average speed is intrinsic to the bacterium. Thirty percent of bacteria had significant changes in speed over time spans of a few minutes, including 17% that appeared to collide with obstacles and 13% that moved with a significant periodic component. For the latter, the peak frequency was proportional to speed, suggesting a mechanism with a fixed spatial scale of ∼0.6 bacterial length. Near the rear of the bacterium, temporal fluctuations in actin density were positively correlated with fluctuations in speed, whereas near the front the correlation was negative. A comparison of the performance of linear models that predict motion given actin density suggests that the mechanism has a history of 5–10 s, and that fluctuations in actin density near the front of the bacteria contain more predictive information than the rear. Our results are consistent with physical models where bacterial speed is governed by the rate of dissociation of bonds between the bacterial surface and the actin tail, and individual variation is determined by long-lived intrinsic variability in bacterial surface properties.
INTRODUCTION
In this work, we examine how the intracellular bacterial pathogen Listeria monocytogenes moves during actin polymerization-based motility, in which bacteria are propelled through the host cell cytoplasm by the assembly of densely cross-linked comet tails made of host cell actin (reviewed in Refs. 1–3). Within living host cells, the clonal descendants of a single infecting bacterium may display a broad range of behaviors, moving quickly, slowly or with varying speed and orientation over time (4–6). Bacterial actin-based motility can be reconstituted in cytoplasmic extracts from Xenopus laevis eggs, human platelets, mouse brain tissue (7–9) or even in an appropriate mixture of purified proteins (10), and the heterogeneity in bacterial speed and trajectory remain comparable to that observed in living cells. In vitro, the average movement speed of a population of bacteria can be altered by changing the concentration of several of the host protein components involved in actin-based motility (10) or by changing the effective viscosity by the addition of agents such as methylcellulose (11). However, these effects on the population average speed cannot address the sources of persistent, intrinsic variation around the average among a population of genetically identical bacteria moving in a consistent biochemical environment.
The source of variability among individual bacteria has not been identified, and has been neglected in biochemical analyses and theoretical models. In existing measurements it is difficult to distinguish between biological sources of variation, and variation due to limited experimental sampling. To solve this sampling problem, we developed a method of making high-resolution measurements of the movements of many (>103) individual bacteria undergoing actin polymerization-based movement under controlled experimental conditions. This technique also allows us to simultaneously record the dynamics of the actin cloud surrounding each bacterium as it moves, making possible direct correlation between actin dynamics and bacterial movement.
We use this method to resolve whether variation in bacterial movement has biological, rather than experimental origins. We examine whether small differences in surface geometry among bacteria (12,13) could account for the natural variation in bacterial speed in a population. We track individual bacteria over long periods of time, and examine whether variations in measured average speed arise from undersampling of a slowly but randomly varying ensemble, a genuine difference in the characteristic speed of individual bacteria (6,14), or systematic sampling bias introduced by slow changes in the state of the extract over time (15). We also systematically examine how the shape and density of the actin cloud surrounding the bacterium varies among bacteria and over time, measuring the strength of the correlation between fluctuations in actin cloud density and bacterial speed over time.
In addition to testing specific hypotheses, our measurements form an important empirical basis for future theories of actin polymerization-based movement. Brownian ratchet models (16,17), elastic gel models (18), and biochemical models (3) describe the steady-state behavior of a canonical individual bacterium in terms of average biochemical and physical properties. Although the elastic gel model does propose a mechanism for periodic variations in speed over time (18), and molecular models such as the Brownian ratchet model include a stochastic component which could explain nanometer steplike motion of individual bacteria (11,19), the accounting of variability in these models is restricted to specific situations and does not in general explain the intrinsic variability seen among wild-type bacteria. We present here a unified description of the experimental variability in bacterial motion and the actin tail. Future models will have to account for not only the average rate of bacterial movement, but the observed distribution of bacterial speeds, the measured stochastic and periodic variations in individual bacterial speed over time, dynamic fluctuations in actin tail shape over time, and how these variables change with experimental perturbations such as genetic mutations or biochemical manipulations.
MATERIALS AND METHODS
Bacterial culture and slide preparation
Listeria monocytogenes in vitro motility assays were performed as described in Theriot and Fung (20). Bacteria were grown overnight at 37°C in brain-heart infusion medium or Luria broth, centrifuged and resuspended in Xenopus extract buffer (21), and added to Xenopus laevis egg cytoplasmic extract containing trace amounts of tetramethylrhodamine-labeled actin and an enzymatic ATP regenerating system (20). All experiments were performed with a hyperhemolytic isolate of L. monocytogenes, strain SLCC-5764 (22). In some cases, bacteria were transformed with a plasmid expressing green fluorescent protein under a constitutive promoter and selected under chloramphenicol resistance (23). A small amount (0.75–2 μl) of extract suspension containing bacteria was sandwiched between a glass slide and a coverslip (22 × 22 mm, No. 1) and sealed with a 1:1:1 mixture of Vaseline, lanolin, and paraffin and placed on the microscope stage for imaging. For some experiments, 0.9-μm diameter silica beads were added to the extract and the slide preparation was compressed by a 1.6-kg weight for 2 min to establish an even spacing between slide and coverslip. In some cases, untreated glass coverslips and slides were used, whereas in others glass slides and coverslips were precleaned or coated with bovine serum albumin (BSA). There were no major changes in bacterial movement associated with either treatment. To preclean slides, slides were immersed in a freshly mixed, hot solution of 80% sulfuric acid and 20% hydrogen peroxide (Piranha) for 15 min, washed, dried at 60°C for 1 h, and stored in dust-free containers. Stainless steel slide carriers and ceramic coverslip holders were used during cleaning. For experiments using BSA-coated coverslips and slides, glass was cleaned in Piranha solution, washed, and then immersed for 15 min in a freshly made, filter-sterilized solution of 2 mg/ml BSA. The glass was then washed, dried, and stored for later use.
Epifluorescence video microscopy
All imaging was performed on an inverted Nikon TE 300 microscope (Nikon, Tokyo, Japan) equipped with standard phase-contrast and epifluorescence optics using a 60× oil immersion objective (N.A. 1.3). For GFP-expressing bacteria, a dual-wavelength filter set was used to visualize the GFP and rhodamine-actin signals (Chroma Technology, Brattleboro, VT). Filter wheels and illumination shutters were controlled by MetaMorph software (Universal Imaging, Downingtown, PA). Bacteria not expressing GFP were visualized by phase-contrast. A single wavelength tetramethylrhodamine filter set was used for the actin channel. As there appeared to be no significant difference between GFP fluorescence or transmitted light techniques in visualizing the bacterial position, we refer to the GFP and phase-contrast channels in all cases as the tracking channel.
Images were captured by a 12-bit cooled CCD camera (Princeton Instruments, Princeton, NJ). Pairs (tracking channel and image channel) of 512 × 512 pixel images were taken at 2-s intervals, at 200 ms of exposure per frame; the order of exposure did not appear to affect any subsequent analysis. The imaging area was 40 μm across and was chosen to include 7–12 bacteria on average. Dark noise and camera offset were subtracted from every movie. Movies were typically 256 frames long, and were saved to hard disk for offline analysis. Each movie required on the order of 0.5 GB of raw storage space. Dedicated workstations, each with several large hard disk drives (40–120 GB each), were used for image processing and analysis.
Automated tracking
Custom software written in the C++ programming language (Visual C++, Microsoft, Seattle, WA) was used to track bacteria in the image files. Standard thresholding, centroid tracking, and axis of symmetry algorithms (24) were applied to the tracking channel to define the position and heading of candidate objects in each frame. Objects too close to the edge of the frame (typically 32 pixels) were rejected, to prevent edge artifacts in later analysis which calculate values in a 64 × 64 region around the bacterium. A frame-to-frame nearest-neighbor rule was used to construct tracks of bacteria moving over several frames. Tracks under 64 frames in length were automatically rejected. Tracking data for each bacterium were saved, along with image data and experimental parameters, in custom-written data files.
Data analysis
Tracking files and ancillary information were entered into a relational database (Microsoft Access, Microsoft). Every tracked bacterium was identified by a unique serial number, and associated with original image data and experimental parameters such as date and time of acquisition. Several statistics were automatically calculated and entered into the database, including average speed, velocity power spectra, fluorescence intensity time series, and average path curvature. Numerical calculations used algorithms and source code from standard texts (24); public domain numerical libraries were used for fast-Fourier transform calculations. All algorithms were implemented in the C++ programming language.
Speed fluctuations were analyzed using standard power spectral techniques (24). Because samples were approximately but not exactly evenly spaced, a Lomb normalized periodogram algorithm (24) was used to calculate the estimated power spectral content. Probability values for peaks in the observed power spectra were calculated from the null hypothesis that velocity variations are independent in time and thus generate white noise power spectra. As derived in Press et al. (24), in such a case, p ∼ Ne−z where N is the number of independent samples and z is the power of the peak normalized by the total variance.
Linear models of the relationship between actin density fluctuations and speed fluctuations were compared by calculating the least-squares error of a prediction generated by an optimized linear kernel. The values of the kernel were calculated from fluorescence and instantaneous speed time series using a modified singular value decomposition algorithm (24). Given actin density data dactin and velocity data vactual(1…N) for N frames, the algorithm calculates the coefficients rj of the function  , that minimize the least-squares error between vpredicted and vactual. Typically a fraction (0.5) of the data set was used to calculate the kernel, and the remaining fraction was used to measure the error in prediction, but the results did not strongly depend upon the fraction used. The least-squares error
  was divided by the number of data points to generate a raw normalized least-squares error. To account for a decrease in the least-squares error due to the increased number of free parameters, the normalized least-squares error for points far in front of the bacterium were subtracted. The typical magnitude of this correction was <0.25 of the total drop in normalized least-squares error, and does not significantly affect the interpretation.
RESULTS
Performance of the tracking system
In previous reports, experimental sources of variability are co-mingled with true biological variation. Sampling error, the age of the preparation, variation within a preparation, daily variation, and variations in the choice of threshold for movement all contribute to the total measured variability in speed of movement among bacteria. Sample sizes in ∼30 existing reports range from n = 3 (25) to n = 276 (26) with most measurements per condition averaging speeds of 10–30 individuals, enough to estimate mean speeds but not higher order moments or to reliably compare differences among populations. Average speeds of wild-type L. monocytogenes in Xenopus frog egg cytoplasmic extracts of 80–100 nm/s have been reported (7,27) with a typical population standard deviation of 10–15 nm/s, but it is unclear whether the differences in average speeds are due to experimental or biological differences among preparations. Objects were tracked sequentially in a single preparation as the preparation aged (15) or at a fixed time-point relative to the preparation of a sample (28), but the distinction was not always made, and the daily variation between preparations was not generally reported. Bacteria were tracked manually or semi-automatically at varying sampling intervals (usually 5–20 s per interval, for a total elapsed time of 3–10 min), and nonmoving bacteria were visually excluded from the analysis either because they were below the threshold of tracking accuracy, or to simplify later analysis; the choice of threshold affects estimates of the population mean by eliminating stationary bacteria, which often comprise a significant fraction of the population.
We sought to separate experimental sources of variation from genuine biological variation by standardizing the recording procedure so that it could be repeated many times, standardizing the sampling interval to remove sample-interval dependent variation, and tracking all bacteria in the field of view, including stationary bacteria to remove biases due to choice of movement threshold. Under these conditions we were able to track several bacteria in a single microscope field for several minutes at a time, to record for up to 3 h from individual slides, and to record from three to four slides in one day, reliably generating >500 trajectories per day. There was some daily variation in the average speed (data not shown) but this variation appeared to be random. Within each day average speeds on each slide also appeared to vary randomly. In general bacteria slowed down when the age of the slide exceeded 3 h, as detailed below.
Using this method we were able to compile a population of ∼7900 bacteria recorded over the course of two years, representing ∼30 days of actual recording. This represents an increase in number of two-to-three orders of magnitude over other published reports and an increase in temporal resolution of approximately fivefold, as all trajectories were sampled at 2-s intervals, versus 10–30 s for typical recordings in the literature. More importantly, this method is largely automatic, requiring little operator intervention besides the initial setup of the bacterial suspension and activation of the acquisition software. Separate measurements of bacteria nonspecifically adsorbed to cover glasses showed that the positional noise in these measurements was normally distributed with standard deviation between 0.1 and 1 camera pixel, or 10–100 nm, and that the microscope field drift over an entire recording (typically 512 s) was uncorrelated, and had the same order of magnitude (data not shown).
Typical data generated using the automated tracking technique
In existing reports, the number of actin tails and trajectories which could be examined are limited by the labor-intensive nature of the manual or semi-automated tracking and image analysis techniques used (12,29–31). Typically, the actin density is measured as a function of time at a single point on the object surface (12) and the cross-correlation with the instantaneous velocity is calculated, minimizing the amount of additional tracking needed but also limiting the measurement to one area of the bacterial surface. Alternatively, a derived parameter, such as the overall length of the actin tail, is compared to a movement parameter, such as the average speed of the bacterium. Parametric measurements of this type (29) provide a more in-depth accounting of actin tail dynamics, but are also correspondingly more labor intensive, as multiple points in the actin tail profile must be located and tracked by hand over many frames.
To overcome these limitations, we developed custom tracking software to automatically track bacteria, store trajectory and image data, and immediately calculate several quantities, including speed, average actin density, and average path curvature. A typical bacterial trajectory tracked using this system is shown in Fig. 1 A. The centroid position of the bacterium for every frame in the movie (Movie 1 in Supplementary Material), is superimposed on a single pseudo-colored fluorescence image of the GFP-expressing bacterium and the rhodamine-actin-containing comet tail. The actin comet-tail behind the bacterium lies along the previously traversed path, and fluorescence intensity decreases with distance from the end of the bacterium. Because the elapsed time interval between frames is approximately constant, the distance between tracked points is proportional to the speed of the bacterium.
FIGURE 1.

A representative example of bacterial movement in Xenopus egg cytoplasmic extract. (A) False-color map of GFP (blue) and rhodamine-actin (red) fluorescence signals in the 100th frame of a 250-frame movie, with derived bacterial path over all frames in the movie superimposed with hash marks positioned at 2-s intervals (black). Inset shows entire frame visible to microscope with several tracked paths. Each point indicates position of bacterial centroid (dot) and orientation of long axis of the bacterium (perpendicular line). (B) Instantaneous fluorescence cross-sections along the path of the bacterium, for the 100th frame. Each cross-section is centered on the bacterium and oriented perpendicular to the direction of motion at that point, generating a computationally straightened actin comet tail. (C) Integrated fluorescence across GFP (blue) and rhodamine-actin (red) cross-sections, for the image shown in B. (D) Point-by-point estimated instantaneous speed as a function of time throughout the recording.
To compare the actin distribution in tails with different amounts of curvature, we used the previous trajectory of the bacterium to define the central axis of the comet tail for a series of cross-sections (Fig. 1 B) along the tail to mathematically straighten the tail. The two-dimensional tail cross-section data were reduced to a one-dimensional, extended longitudinal tail profile by integrating the fluorescence signal across each cross-section (Fig. 1 C). This approach may slightly overestimate the cross-sectional area if the section is not perfectly normal to the axis of the tail, but it provides an estimate for actin fluorescence intensity as a function of position in the tail that is independent of lateral movement or buckling of the tail with respect to the bacterial path.
The estimated instantaneous speed of the bacterium (Fig. 1 D) was calculated by dividing the observed distance traveled between two frames by the time between frames. For critical estimates of average velocity, we used a linear regression method detailed below to ameliorate the effects of high-frequency positional noise.
Variation in the two-dimensional trajectories of bacterial movement
One of the most striking features of bacterial trajectories is the wide variation in curvature over time and among bacteria. In both wild-type bacteria (5,29,32) and bacteria expressing various mutated forms of ActA (26,33,34) bacteria move in circles, weaving S-curves, straight lines, crooked random walks, and in the case of some mutants, seemingly random “dances” punctuated by frequent, sharp changes in direction. This is also true for bacteria moving in a reconstituted system of purified proteins (10) and for ActA-coated latex beads in a cytoplasmic extract (28).
Our system allows us to record a large number of bacterial trajectories and systematically search for patterns in movement among bacteria. The trajectories of 100 randomly chosen bacteria out of the total population of 7900 bacteria are shown in Fig. 2 A, with six representative trajectories highlighted in color. The great variation in trajectories among bacteria can clearly be seen, as well as variations in individual trajectories over time. Table 1 describes the characteristics of each representative bacterium. The typical persistence length, which is the path-length over which the autocorrelation of the angular velocity decreases to zero, varied between 2 and 5 μm. Some individual trajectories curved with nearly constant angular velocity for considerably longer distances, resulting in nearly circular paths with varying radii. Other paths were nearly straight or approximated a persistent random walk.
FIGURE 2.
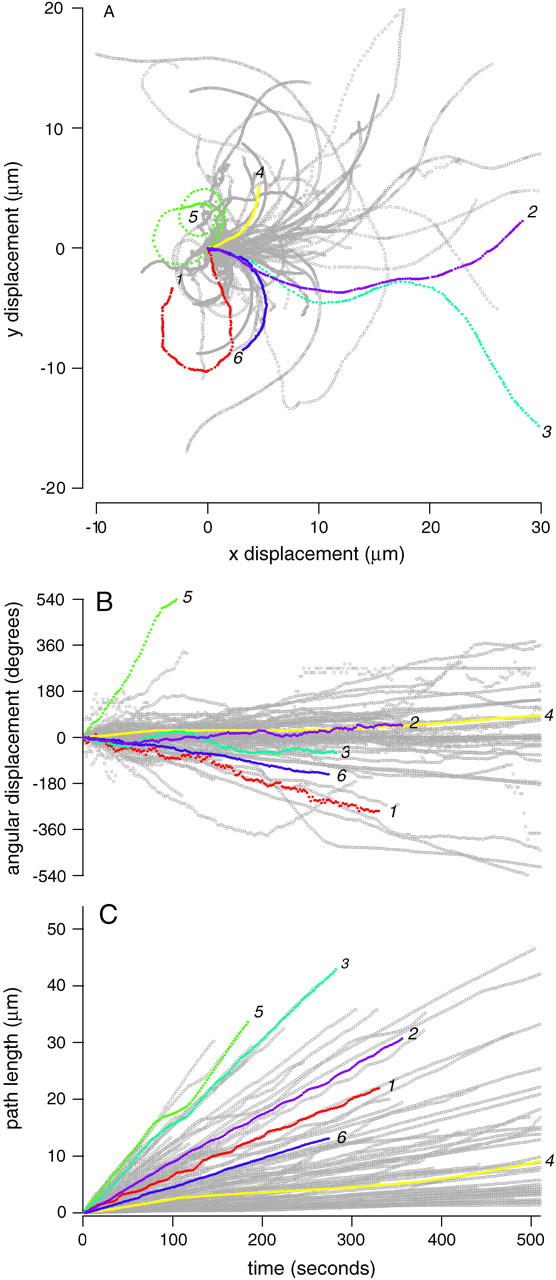
Bacterial trajectories vary in space and time. (A) Two-dimensional trajectories of six typical bacteria (colored and numbered 1–6) and 100 randomly selected bacteria (gray) out of the total experimental population of 7901 bacteria are plotted. Individual trajectories are translated to the origin, and rotated so the bacterium is initially pointed to the right (θ = 0). (B) Angular displacement the same trajectories as a function of time. Positive θ is in the counterclockwise direction, angular velocity is measured in degrees/s. (C) Cumulative path-length as a function of time. Path-length is defined as the sum of the lengths of the line segments connecting individual points in the trajectory and is measured in microns.
TABLE 1.
Selected characteristics of representative bacteria
| # | Color | Description | Linear speed (nm/s) | Angular speed (deg/s) | 1/f (s) | K (cycles) | ppeak | rrear | rfront | χ2 |
|---|---|---|---|---|---|---|---|---|---|---|
| 1 | Red | Periodic motion | 61.5 | −1.75 | 32.0 | 10.3 | 1.1E-06 | 0.40 | 0.13 | 0.93 |
| 2 | Purple | Periodic motion | 84.8 | 0.26 | 27.8 | 12.8 | 1.6E-08 | 0.28 | −0.07 | 0.90 |
| 3 | Aqua | No periodicity | 146.9 | −0.44 | 86.2 | 3.3 | 4.5E-03 | −0.05 | 0.00 | 0.98 |
| 4 | Yellow | Slow, collision | 13.2 | 0.33 | 507.9 | 1.0 | 4.0E-13 | 0.16 | −0.41 | 0.86 |
| 5 | Green | Circular, collision | 118.9 | 8.84 | 121.3 | 1.5 | 2.4E-08 | −0.69 | −0.63 | 0.56 |
| 6 | Blue | No periodicity | 44.7 | −1.05 | 43.5 | 6.3 | 3.7E-01 | −0.06 | −0.20 | 0.98 |
We cannot tell what causes an individual bacterium to move in a particular trajectory, but can make inferences about how the actin tail might be growing to cause path curvature. If the actin tail is fixed in space and actin filament growth only occurs near the bacterial surface (29,32), curvature in the bacterial trajectory arises from the differential actin growth rates on the inside and outside of the curve (35). According to this model, the radius of curvature is therefore a measure of the difference in growth rates between the inside and outside of the curve. The angular displacement as a function of time for the 100 bacterial trajectories is shown in Fig. 2 B, and cumulative path-length is plotted as a function of time in Fig. 2 C. Given the radius of curvature implied by these curves and a bacterial diameter of ∼0.7 μm, the typical difference in growth rate between the inside and outside of the curved trajectories is on the order of a few percent. In many cases, this slight implied difference in growth rate is maintained over a minimum of several minutes.
Persistent differences in forward speed among bacteria also appear to be maintained over time and were not correlated with differences in bacterial geometry or position. Individual average speeds were roughly constant, as demonstrated by the linear increase in cumulative path-length with time. Speed variation within each track was generally smaller than speed variation in the whole population (i.e., the cumulative path-length curves tended not to overlap) on the timescale of the recording (tens of seconds to several minutes). Some bacteria exhibited regular periodic fluctuations in speed of varying frequency and magnitude (Fig. 2, traces 1 and 2), which are analyzed in more detail later. Average speed was not strongly correlated with bacterial length (Fig. 4 E) or width (Fig. 4 F) or position in the frame (data not shown).
FIGURE 4.

Average linear speed distributions evolve over time, whereas angular speed distributions remain constant. (A) Average angular speeds of individual bacteria are plotted as a function of time after the slide was prepared. The population is divided into early (0–60 min, gray), middle (60–120 min, red), and late (120–180 min, blue) subpopulations according to time after slide creation. Bacteria recorded >180 min after slide creation were not included. Large dots are colored and numbered as in Fig 2. Dark line is average angular speed taken in sequential bins of 100 bacteria. Average angular speed for each bacterium is calculated by taking the average of the instantaneous changes in orientation of the bacterial centroid over time. The time at which the bacterium was tracked is defined as the average value of the times of points in the bacterial trajectory. (B) The bacterial linear speed as a function of time after the slide preparation was made. Linear speed for each bacterium is defined as the slope of the best fit line as defined in Fig. 3. Dark line is linear speed taken in sequential bins of 100 bacteria. (C) Histogram of bacterial linear speeds for early, middle and late subpopulations. The fraction of bacteria in each bin is plotted as a function of linear speed. Total number of bacteria in each population n are indicated in the figure legend. (D) Distribution of angular speeds for early, middle and late subpopulations. Color-codes are the same as in other panels. (E) Bacterial width as a function of linear speed. Color-codes are the same as in other panels. Dark line is average width taken in sequential bins of 50 bacteria. (F) Bacterial length as a function of linear speed. Dark line is average length taken in sequential bins of 50 bacteria.
Estimation of the forward component of bacterial speed
To make a precise measurement of the growth rate of the actin comet tail, the forward component of motion must be separated from motion induced by lateral bending of the comet tail, differential growth, path curvature, and instrumental noise. The point-to-point instantaneous speed of a bacterium, used in most existing reports, includes components due to bending of the actin tail and instrumental noise. In our own data, instantaneous speed estimates obtained by dividing the distance between centroid positions in neighboring frames by the time interval for slowly moving bacteria were much higher than the speed estimated by taking the distance between the endpoints of the trajectory and dividing by the total elapsed time, and measured average instantaneous speeds did not reach zero even for bacteria with zero net displacement (data not shown).
To extract the forward component of motion, we fitted individual bacterial trajectories with a model of linear motion. For pure forward motion, the increase in average displacement between points in the trajectory is exactly proportional to the time interval between samples. The degree to which actual movement can be approximated by this linear model can be tested with a simple procedure. Each trajectory is resampled at a time interval Δt greater than the original sampling interval. Then the average displacement d traveled between points in the resampled trajectory is calculated. For linear movement, d should increase exactly proportionally to Δt where the slope is the average speed (36).
Our data are well described by a linear motion model. In Fig. 3 A, average displacement as a function of time interval is plotted for each of the 100 bacterial trajectories. Lines indicate linear fits to the data. As expected, there is some deviation from linearity at both high and low limits, but for a wide range of intermediate sampling intervals, the straight line approximation is quite close (Fig. 3 B), and so the slope of the best-fit line to the regression of average displacement versus time interval, or average linear speed, is a reasonable estimate of the forward component of motion. For rapidly moving bacteria with straight and curved trajectories, the average linear speed was found to be close to the average of the instantaneous speeds. For slowly moving bacteria, the average linear speed was lower than the average of the instantaneous speeds, and unlike the average of the instantaneous speeds, approached zero for bacteria that showed no net displacement over the entire course of the movie.
FIGURE 3.
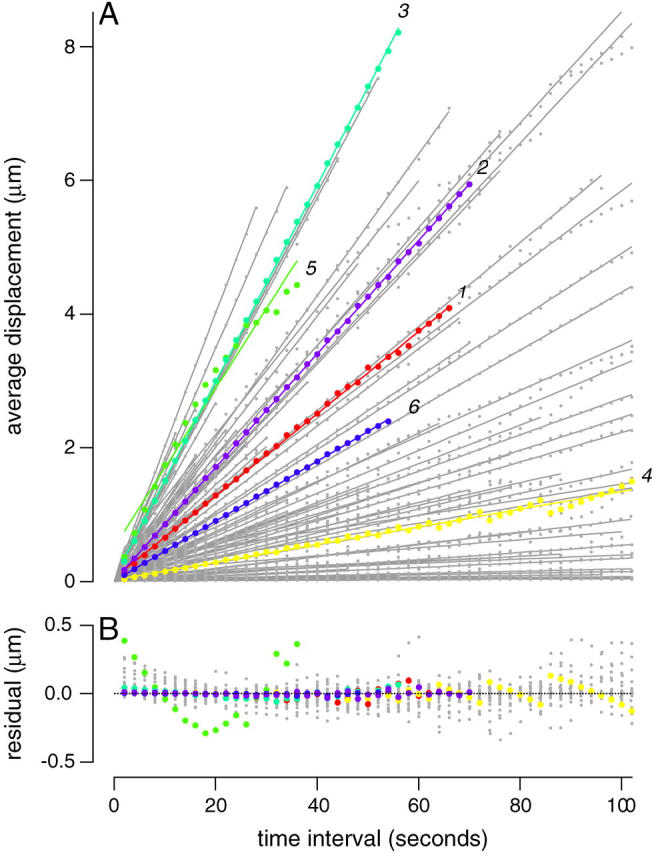
The linear component of bacterial speed can be estimated using a linear regression technique. (A) The average straight-line displacement of individual bacteria is plotted as a function of time between measurements (small circles) and the corresponding best fit line y = a x + b (lines). Each trajectory represents the measurements for one bacterium, colored and numbered as in Fig. 2. If the bacterial path is curved, the straight-line displacement between two points of the curve will be shorter than the path-length along the curve between the two points, resulting in deviations from linearity at longer time intervals. Non-overlapping time intervals are used; e.g., for a bacterium which was recorded for 500 s, there are 50 non-overlapping intervals of 10 s. The longest time interval was one-fifth of the total length of the recording, to ensure that each average contains at least five measurements. (B) The residual of the fit (actual value minus fit) for the same bacteria as a function of time interval.
Breadth and time dependence of bacterial speed distribution
Using a linear speed measurement, the bacterial population could be clearly divided into moving and stationary subpopulations. Bacterial average linear speeds ranged from 0 up to a maximum of 0.25 μm/s (Fig. 4 C). As bacteria average close to 2 μm in length, the maximum rate corresponds to nearly 7.5 lengths/min. The average rate of∼75 nm/s corresponds to a normalized rate of ∼2.5 lengths/min. Common to all samples was a subpopulation (9–12% of total) of bacteria that were essentially stationary, with average linear speed between 0 and 3 nm/s.
One proposed source of variation in population average speed is gradual ATP depletion in the cytoplasmic extract. In the absence of an ATP regenerating system, actin-based movement eventually slows to a halt over a period of several hours (15). In addition, other processes, such as nonspecific binding of proteins to the glass substrate, might also occur during this time (37). In addition it is not known whether a decrease in average speed comes from a decrease in the average speed of the moving population, or a decrease in the number of moving bacteria.
To test whether gradual ATP depletion could account for the variability in average speed and curvature distributions, we plotted the average angular velocity and average linear speed of bacteria as a function of time since sample preparation (Fig. 4, A and B). Included in this figure are data from 41 slides and 6761 bacteria. Because not all slides were recorded from for a full 180 min, there are fewer bacteria recorded later than earlier. The distribution of bacterial speeds on an individual slide was comparable in variability to that of the entire population; there were no fast or slow slides. To assess how the population distributions changed over time, the entire population was divided into early, middle, and late subpopulations, corresponding to bacteria tracked in the first, second, or third hour after a slide was created. Histograms of early, middle, and late average linear speed and angular velocity distributions are shown in Fig. 4, C and D. Population average speeds were 70, 51, and 49 nm/s, for early, middle, and late populations, respectively. Although in the first hour there was a distinct bimodal distribution of speeds, in the second and third hours speeds were slower and more smoothly distributed. For times >180 min many bacteria were slowed or nearly stopped, and these late time-points were excluded from further analysis. Because the speed distribution is constant between 60 min and 180 min, it is unlikely that the loss of the faster subpopulation after 60 min is due to ATP depletion; instead, this observation reflects the tendency of bacteria to move with anomalously rapid bursts of speed immediately after movement initiation (38).
The angular velocity distribution, in contrast, did not appear to differ between early, middle, and late populations. Bacterial average angular velocities in the different groups appeared to be symmetrically distributed, with the majority of the population having average angular velocities between −3 and 3°/s (Fig. 4 D). The separability of angular and forward speed suggests that they are dependent on different biochemical or biophysical processes.
Periodic, stochastic, and singular variations in speed
Several sources contribute to variations in the speed of bacteria over time, as can be seen in the individual examples in Fig. 5 A. In some cases (bacteria #1 and #2) the variation is apparently periodic, whereas in other cases (bacteria #4 and #5) the motion of the bacterium over time is punctuated by a single pause or interruption. On inspection these events corresponded to collisions of the tracked bacterium with the actin tail of a nearby individual. In addition, a smaller, random component to the speed fluctuations is superimposed on the larger periodic or singular fluctuations. This appears to originate from variations in the growth rate of the actin tail, with only a small contribution from side-to-side thermal motion and positional measurement error.
FIGURE 5.
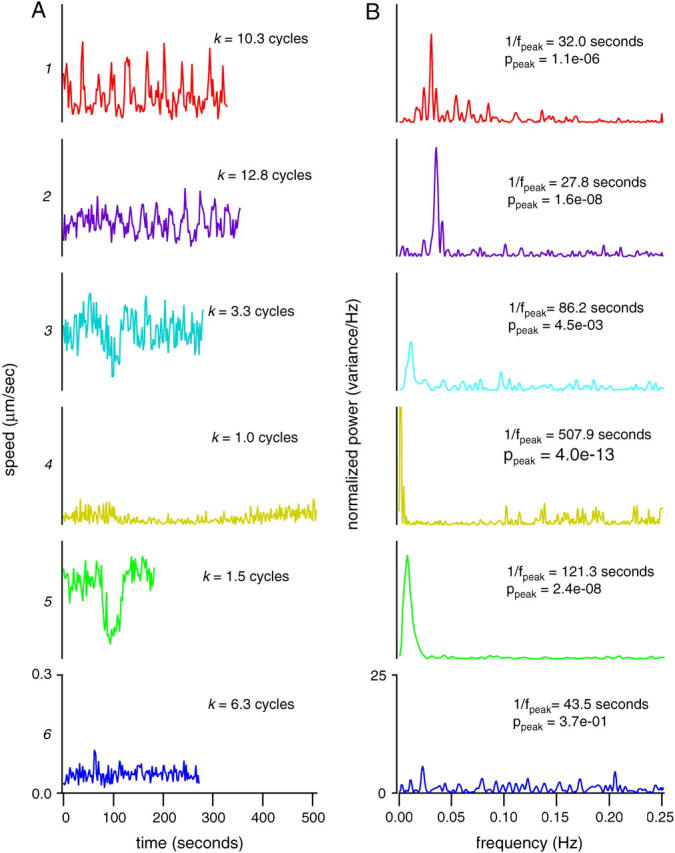
Bacterial instantaneous speeds fluctuate over time. (A) Instantaneous velocity for the six typical bacteria are plotted as a function of time. Traces are numbered and colored as in previous figures. Instantaneous velocity is defined as the linear distance traveled by the bacterial centroid between two frames divided by the time elapsed between the two frames. For each time bacterium, the number of cycles of the peak frequency fpeak contained in the duration tduration of the recording k = fpeak tduration is indicated. All scales are identical. (B) Corresponding power spectra. Normalized power (power/total variance) is plotted as a function of frequency. For each spectrum, the period 1/fpeak and the probability ppeak of seeing that peak against the white-noise null hypothesis, as described in the text, are indicated. All scales are identical.
Besides the stochastic fluctuations due to collisions and thermal noise, periodic oscillations in speed can also be seen. To systematically measure the contribution of the periodic component to motion, we calculated the normalized Fourier power spectrum of the speed as a function of time as described in Materials and Methods. In this analysis, motion is decomposed into the sum of pure periodic signals of varying strength and relative phase. The relative strength of each periodic signal as a function of the frequency of that signal, or power spectrum, is shown in Fig. 5 B for the six representative individuals from Fig. 5 A. The peaks in the power spectra of bacteria #1 and #2 were isolated and narrow, indicating that fluctuation in speed was highly regular and largely composed of a single frequency. The peaks were located in the low-frequency range of the power spectrum with period 1/fpeak of ∼30 s. This is slow compared to the sampling interval (2 s), and so the peaks cannot be attributed to aliasing effects. In general, velocity power spectra tended have only one major peak, and the width of the peaks was largely accounted for by sideband leakage due to the limited length of the time series (data not shown).
Collisions, thermal noise, and periodic motion can be distinguished by their characteristic signatures in the velocity power spectrum. Bacteria #4 and #5, which collided with existing actin tails, had strong peaks in the power spectrum, but the period of these peaks (1/fpeak = 508 and 121 s, respectively) was on the same order as the length of the recording (510 and 184 s, respectively), indicating that the events happened only once during the cycle. For bacteria #3 and #6, power was distributed uniformly across the spectrum with no peaks, as would be expected from thermal motion or frame-to-frame jitter.
Many of the observed peaks in velocity power spectra appear to be significantly stronger than would be expected from a stationary random process. To test whether power spectrum peaks could have occurred by chance, we calculated the probability ppeak that a given peak in the frequency spectrum was to be generated by a stationary random process with the same measured total variance. In this hypothetical case, the probability of such a peak occurring is linearly dependent on the length of the sample and inversely exponentially dependent upon the normalized height (see Materials and Methods). This method of gauging peak heights takes into account the length of the recording, which varies from a minimum of 32 frames to a maximum of 256 frames. For the six bacteria shown in Fig. 5, the calculated values of ppeak are shown, ranging between 0.4 and 1 × 10⁻¹³. Four of the six peaks have ppeak < 0.001, meaning that the probability that they were generated by chance is <1:1000. Using a conservative significance threshold of ppeak < 0.001, 30% of the entire population had peaks not expected from chance.
We used the collision signature in the velocity power spectrum to estimate the fraction of bacteria which collided with objects while under observation. Because an individual bacterium usually collides only once with an object during a recording, the number of cycles k at the peak frequency in these cases is <2, and values of k > 2 tend to be trajectories with regular periodic motions. According to this criterion, bacteria which collided with obstacles during the observation period (ppeak < 0.001, k < 2) comprised ∼17% of the entire population, and bacteria which showed significant, noncollision periodic oscillations (ppeak < 0.001, k > 2) comprised 13% of the entire population. Nearly all significant peaks in this latter population occurred at low frequencies (<0.06 Hz).
Existing models of bacterial motion predict a general relationship between the frequency of large peaks in the velocity power spectrum and average bacterial speed. Previous reports indicate that mutant bacterial strains carrying certain variants of ActA (30) and wild-type bacteria trapped tightly between two parallel glass coverslips (39) show strong periodic fluctuations in speed. It has been proposed that periodic motion arises from catastrophic failure of bonds on the bacterial surface (18), in which case distance traveled during the rapid phase of movement may be related to the length of the bacterium. According to this hypothesis, the temporal frequency of significant periodic fluctuations and the average speed of the bacterium should be correlated. Furthermore, the frequency of nonsignificant peaks, and peaks due to collisions should not be correlated with the average speed of the bacteria, as they arise from independent sources.
We found a linear correlation between the frequency of periodic motion and average bacterial speed among bacteria with significant peaks in their power spectrum, supporting the catastrophic failure hypothesis. Peak frequency as a function of bacterial speed is shown in Fig. 6. For the bacteria whose spectra did not include significant peaks (ppeak > 0.001), the highest observed peak was often at high frequency (0.15–0.25 Hz), consistent with frame-to-frame jitter from positional noise or Brownian motion. The peak frequencies of bacteria with singular events (ppeak < 0.001, k < 2) showed no obvious correlation between peak frequency and speed. However, the peak frequency of bacteria with significant periodic speed fluctuations with several repetitions (ppeak < 0.001, k > 2) was strongly correlated with the average normalized (to bacterial length) linear speed of the bacterium. This correlation suggests that the length constant corresponding to the periodic temporal fluctuation has a fixed spatial frequency of 0.6 bacterial lengths (1.2 μm) independent of the average bacterial speed.
FIGURE 6.

Peak frequency is correlated with bacterial speed for bacteria with periodic speed oscillations. The frequency of the maximum peak fpeak is plotted as a function of bacterial speed normalized to bacterial length (lengths/s). Each point represents one bacterium, categorized into one of three categories. Bacteria for which the peak strength is weak ppeak > 0.001 are plotted in gray. Bacteria which have significant peaks ppeak < 0.001 but have two or fewer cycles at fpeak (k < 2) are plotted in red. Bacteria with significant peaks and more than two cycles at fpeak are plotted in blue. Representative bacteria are also shown (large dots), with colors and numbers as in previous figures.
Relationship between speed and average actin filament density distribution
Experimental evidence suggests that bacterial movement and the dynamics of the actin tail are closely coupled. Actin polymerization is required for movement (32) and movement is always accompanied by the formation of an actin tail. On encountering objects, actin tail density increases briefly before movement continues (see movie in Supplementary Material) and large fluctuations in velocity are correlated with changes in surface actin density for both bacteria and beads (12,18,30,39). Finally, in the presence of methylcellulose, bacterial movement is slowed and actin tail density increases (11). Several models have been proposed in which change in the actin gel density (18) and actin filament density (17) have varying effects on bacterial movement. Although we cannot measure absolute actin density, we are able to accurately measure relative actin density in our high-throughput system as a function of location using fluorescence intensity.
To measure average actin density relative to background on the surface of the bacterium, we divided the fluorescence values in the frame by the average fluorescence of points in the background away from the bacterium and other actin tails. We then computationally translated and rotated the frame so that the bacterium was always centered and oriented in the same direction. By averaging together frames with movement information subtracted, we were able to construct, for each individual bacterium, a map of the average relative actin density over time with respect to the bacterial surface.
The relative density maps for the six representative bacteria (Fig. 7 A) have the comet-tail profile expected from visual inspection of the raw movies. In all six cases, actin tail density is oriented along the long axis of the bacterium, rises along the bacterial surface, peaks near the rear end of the bacterium, and falls off rapidly with distance behind the bacterium. The fall-off is largely due to actin depolymerization (29), but also is influenced by variations in curvature of the bacterial trajectory over time. With the exception of stationary bacteria and laterally moving bacteria, the majority of actin tails for moving bacteria appear similar to the six examples. These results are consistent with qualitative observations that actin density is highest near the rear of the bacterial surface.
FIGURE 7.

Bacterial average fluorescence distributions are stereotyped and vary systematically as a function of bacterial speed. (A) Typical maps in the bacterial frame of reference of the time-averaged rhodamine-actin (red) and tracking channel (blue) signals are plotted. Darker sections represents higher density. Each plot represents one bacterium, numbered as in previous figures. Bacteria are aligned so that they are always moving toward the right. Intensities are normalized by bacterium. (B) Average actin tail density. The map was generated by averaging together centroid-aligned maps of 7902 bacteria, with no normalization among bacteria. The position of the longitudinal section along the long axis of the bacterium and tail is indicated by dark lines. (C) Average longitudinal profiles of actin density vary systematically with average speed. Bacteria were divided into six subpopulations according to average speed and the average longitudinal profile for each subpopulation calculated and plotted with corresponding color and line pattern. Actin density relative to background is plotted as a function of position along the long axis. (D) Average longitudinal profiles of the tracking channel for the same subpopulations. In this case profiles are normalized to unit height.
The same comet-tail structure, with minor differences, is present in the average of the actin maps across the entire population, including both stationary and nonmoving bacteria (Fig. 7 B). Unlike the individual actin density maps, however, there is no average curvature in the actin density, as expected because there is no net average curvature in the averaged trajectories of the entire population. In addition, the actin tail is shorter behind the bacterium than in any individual case, as the density is, on average, spread over a larger area due to the varying curvatures of individual bacteria.
By dividing the large population into subsets of bacteria moving with similar average speeds, we have discovered that the shape of the comet tail depends systematically upon bacterial speed, with a discontinuous transition at a low speed threshold. To quantify the shape of actin tail near the bacterial surface, we measured the actin tail density along a straight line through the long axis of the bacterium (Fig. 7 B) generating an average density profile for each bacterium. We sorted bacteria into groups by their average linear speeds and calculated the average profile of each group, shown in Fig. 7 C. In the case of essentially stationary bacteria (moving more slowly than 10 nm/s), the average profile closely mirrored the bacterial profile (Fig. 7 D), and fell off rapidly with distance from the bacterium. For bacteria moving more rapidly than 10 nm/s, the average profile became sharply asymmetric, with lowered density near the front of the bacterium and a peak in density near the rear of the bacterium. As speeds increased, the peak density systematically decreased and stretched further behind the bacterium. This result is surprising since simple physical models tend to predict that bacterial speed should increase with increasing actin density, contrary to our experimental observation (17). These results also suggest that there is a highly discontinuous transition in actin tail profile near a speed threshold of 10 nm/s, consistent with previous observations that actin-associated bacteria exist in a bimodal population, where each bacterium is either stationary in a nearly uniform actin cloud or motile with an elongated actin tail (40).
Parameterization of the longitudinal actin tail profile
Although the above measurement is sufficient to capture variations near the bacterial surface, the comet tail extends several micrometers behind the bacterium; how the tail is shaped is not easily captured without taking into account the curvature of the actin tail. Several observations suggest that most of the variation in the actin is captured in how its average density varies as a function of distance along its central axis regardless of curvature, the longitudinal actin tail profile. The tail does not appear to compress or expand significantly during its decay (29), or move laterally except as a whole (unpublished observations), suggesting that points in the actin tail remain fixed both relative to one another and relative to the background over time. In fluorescence and electron micrographs, the actin tail appears bilaterally symmetric (29,32,40) with width comparable to the width of the bacterium along the entire length of the tail. Cross-sections of actin density taken perpendicular to the previous trajectory of the bacterium (Fig. 1 B) are approximately Gaussian in cross-section behind the bacterium, with little variation in width or lateral position, with most variation occurring in overall density (fits are not shown).
Longitudinal actin tail profiles qualitatively match what is expected from classical descriptions of the actin tail. The classical description of the tail derived from static immunofluorescence and electron micrographic techniques (4,29,32, 40–42) is of a cometlike structure, with highest actin density near the bacterium and a gradual exponential decay with distance. As expected from these observations, in the longitudinal actin tail profiles of the individual bacteria we examined, the intensity of the actin fluorescence in the tail increased rapidly along the length of the bacterium, peaking in the region 0.1–0.5 μm past the rear end of the bacterium (Fig. 8 B). The intensity of the tail then decays approximately exponentially with distance from the bacterium.
FIGURE 8.

Extended bacterial tail profiles are well described by a simple mathematical function. (A) Schematic of blurred exponential function described in text, with σ, k, offset (d), and scaling (a). (B) Representative fits of blurred exponential (black) to measured average actin tail profiles (red) for four bacteria, different than previous examples. Individual bacterial average speeds are indicated in the legend. (C) Corresponding longitudinal cross-sections from the tracking channel, indicating the relative position of the bacterium.
The extended longitudinal profile of the actin tail of moving (average speed > 10 nm/s) bacteria without collisions from other bacteria or with other actin tails were closely fit by a sharp exponential step function convolved with a normalized Gaussian kernel (i.e., the blurred exponential; see Fig. 8 A). On inspection, poor fits were due to collisions of bacteria with existing actin tails. In addition, bacteria with average speeds below 10 nm/s, in which the actin profile closely mirrored the bacterial profile, were generally poorly fitted by this function.
The shape of the longitudinal actin tail profile is strongly dependent upon how quickly the bacterium is moving and suggests several physical interpretations of the shape of the tail. For the bacteria with good fits, the profile of the tail could be fully described by four parameters: the spatial decay constant k of the exponential, the width σ2 of the blurring Gaussian, the offset d of the exponential anchor point from the bacterial end, and the overall magnitude scaling factor a. Representative fits to four representative traces are shown in Fig. 8 B, and how the four parameters change as a function of average speed for a subset of 250 representative bacteria are plotted in Fig. 9. The spatial decay constant k of the underlying exponential was directly proportional to speed, consistent with previous findings indicating that tail decay rates are constant in time with decay time on the order of 30 s (7,29). This was confirmed by direct measurement of decay time constants of points of the path of the bacterium (data not shown). The typical width σ2 of the Gaussian kernel was 0.8–1.1 μM, only twofold greater than the width of the expected optical diffraction kernel at the emission wavelength of the rhodamine dye (590 nm), suggesting that many features of the tail profile, such as the rising phase and the rearward location of the peak, can be partially explained as optical blurring of a sharper underlying distribution. The anchor position of the exponential d was, on average, 0.5 μm from the bacterial end and was slightly negatively correlated with bacterial speed, suggesting that some part of the underlying structure of the tail slips rearward with increasing speed, consistent with the observations of average actin profiles shown in Fig. 7 C. The overall scaling factor a was slightly negatively correlated with speed, again consistent with the observations of lower average actin density for tails associated with faster-moving bacteria as shown in Fig. 7 C.
FIGURE 9.

Longitudinal tail profile parameters as a function of speed for a subset of 250 representative bacteria. (A) Fitted values for k, σ, d, and a as a function of speed. Each point represents parameter for one bacterium. Linear regression and regression parameters are shown. Representative examples shown in Fig. 8 are labeled. (B) Histogram of speed distribution for this subset of 250 bacteria, with fit to normal distribution.
Correlations between speed fluctuations and changes in actin density
Existing observations suggest that fluctuations in actin density at the bacterial surface are negatively correlated with fluctuations in speed, and it has been proposed that this cross-correlation is related to force generation by the actin tail. When bacteria encounter an obstacle in their path, they slow down and the actin density behind the bacterium increases (see Movies 2–4 in Supplementary Material). For saltatory bacteria (18) and large latex beads (12), the phase density of the actin tail on the rear surface is correlated with speed for those periodic speed changes. In the watermelon-seed model, it has been proposed that energy generated by polymerization is stored by the elastic compression of the actin tail behind the bacterium, and released by catastrophic breakage of frictional bonds between the actin tail and bacterial surface (18). This model predicts that the density of the actin gel near the front of the bacterium will be negatively correlated with speed, and that the density near the rear of the bacterium will be positively correlated with speed.
To quantify the relationship between bacterial speed and actin tail dynamics, we calculated the linear cross-correlation between fluctuations in actin density on the bacterial surface and fluctuations in bacterial velocity over time. For initial cross-correlation analysis, we chose two points on the bacterial surface, one near the front and one near the rear, schematically shown in Fig. 10 A. For each of the six typical bacteria, Fig. 10 B shows the actin density for those two points and instantaneous bacterial speed as a function of time. We calculated the linear cross-correlation coefficient between the actin density and instantaneous speed  , where x and y are defined as the actin density and instantaneous speed at a point in frame i;
  and
and  are the mean values of x and y over the entire time series; σx and σy are the standard deviations of x and y over the entire time series; and N is the number of frames in the movie. The calculated values of r, which must range between −1 and 1, are shown for each set of traces in Fig. 10. A positive value of r indicates that fluctuations in actin density and speed at their respective means were, on average, in the same direction at the same time. A negative value of r indicates that, on average, the fluctuations were in opposite directions, e.g., high actin density and low speed.
FIGURE 10.

Calculation of the cross-correlation between actin density and bacterial speed as a function of time. (A) Schematic diagram of bacterium (blue), actin tail (red), and representative regions (white squares) in the front and rear of the bacterium. (B) Representative examples of how actin density in the front and rear of the bacterium (thick lines) vary as a function of time. Since the actin tail is denser near the rear of the bacterium, traces corresponding to actin density from the rear of the bacterium are the higher of the two traces. Scale bars indicate density normalized to background. All scales are identical. Normalized instantaneous speed is shown for comparison (gray traces). Numbers and colors representing individual bacteria are as in Figs. 2–6. The correlation coefficient r between the density and speed traces in each graph is calculated as described in the text, where rfront indicates correlation coefficient for front trace and rrear is coefficient for rear trace.
The coefficient r is strongly influenced by singular events, such as the collision of the bacterium with an existing actin tail. For instance, bacterium #5 encountered its own actin tail approximately midway through its recording. This collision is visible as a sudden, large increase in actin density for the point near the front of the bacterium. The bacterium slowed nearly to a stop, seen as a corresponding decrease in bacterial instantaneous speed. As the bacterium passed through the obstacle, the actin density at the front point decreased, and the bacterium returned to its characteristic speed. The sequence of events for the rear point is similar, except for a delay in time, and a much higher increase in density than expected from just passing through the obstacle. In this series of events the actin density and instantaneous speed were inversely related; r was negative for both front and rear points.
The pattern of positive and negative r along the length of the bacterium can be accounted for by a combination of latency in the density fluctuations of the actin tail and forward movement of the bacterium over time, as proposed by the elastic gel model (18). For bacteria #1 and #2, the periodic variations in speed were positively and negatively correlated with fluctuations in actin density near the rear and the front of the bacterium, respectively. This is visible in the individual movies as fluorescence intensity pulsations in the actin tail as the bacterium moved more quickly or slowly. Because the bacterium moved forward in space over time, and assuming that the tail remained stationary, the change in sign is consistent with a phase shift of one-half cycle. Whether the phase is advanced or lagging is indicated by the cross correlation between the time derivative of the actin density fluctuations and bacterial speed (data not shown). In these cases, the bacteria was moving faster when actin density was decreasing, corresponding to a phase lag. This is consistent with the watermelon-seed model (18), in which the buildup of actin density along the sides of the bacterium causes the slippage of the bacterium forward. In this case, the density of the actin gel behind the bacterium would increase as the bacterium slips forward, leaving the region of high density, and the density of the actin gel near the front surface would decrease as it escapes the surrounding gel.
A systematic map of the cross-correlation coefficient r for all positions on the bacterial surface and surrounding area show similar patterns both in individuals and across the entire bacterial population. In Fig. 11 A, the colors in the pseudo-colored maps indicate the value of r at that position relative to the bacterium for the six typical bacteria. Near the bacterial surface, the actin tail density fluctuations were negatively correlated with the rate of movement. Behind the bacterium the correlation was positive. Far from the bacterium, the correlation tended toward zero, as expected for random noise. The same pattern is seen in the average cross-correlation r as a function of position for the entire population (Fig. 11 B).
FIGURE 11.

The correlation between bacterial movement and actin tail dynamics varies widely, but on average is negative on the bacterial surface and positive behind the bacterium. (A) Maps of the correlation between local fluorescence and speed fluctuations for represented, are plotted, with numbers as in previous figures. Each map represents one bacterium. (B) Average cross-correlation map for entire population of 7902 bacteria. Map is generated by averaging together centroid-centered individual cross-correlation maps, without normalization. The position of the longitudinal cross-section is indicated by dark lines. (C) Longitudinal profiles of cross-correlation maps for three subpopulations of bacteria defined in Fig. 6. Subpopulation with nonsignificant (ppeak > 0.001) peaks in velocity power spectra are plotted in gray, those with significant peaks (ppeak < 0.001) with few recorded cycles (k < 2) are in red, and those with significant peaks and several cycles (k > 2) are in blue. (D) Corresponding actin (dotted lines) and tracking channel (solid lines) longitudinal profiles, normalized to unit height.
The shape of the pattern was maintained even if different subgroups of bacteria exhibiting different average speeds, lengths, or degree of periodic movement were used in the calculation, but the strength of the correlation varied among subpopulations. The strength of the cross-correlation is strongest for bacteria that show significant peaks in their power spectra (Fig. 11 C), despite relatively small differences in the average actin profile for these bacteria relative to the bacteria without significant peaks (Fig. 11 D). The strong negative correlation near the front of the bacterium is surprising because there is relatively little average actin density in the front of the bacterium compared to the rear, yet the fluctuations are nearly as strongly correlated with fluctuations in speed, indicating that the number of actin filaments located near the front of the bacterium exerts a disproportionately larger influence on speed than the number filaments at the rear.
Comparison of the accuracy of linear models of the coupling between movement and actin tail dynamics
We next compared the accuracy with which simple models of the coupling between actin tail dynamics and movement described the movement of the bacterium over time. The elastic gel model, unfortunately, does not make exact predictions about the movement of the bacterium so we were not able to include it in this comparison, but we were able to ask how a simpler and more general linear model, in which the speed of the bacterium depends upon the actin density at a single point with coefficient r, performs compared to models which take into account varying amounts of the past history of actin tail dynamics.
As a measure of the accuracy of a given model, we used the mean-square error χ2. In this case we calculate  , and divide by the number of frames N, where νactual(i) is the actual measured speed of the bacterium in the ith frame, νpredicted(i) is the speed of the bacterium predicted by the model, and
  is the variance of νactual. This normalized error ranges in value from 0 to 1, with 0 being a perfectly accurate guess, and 1 being a random guess. This is a special case of the more general characterization of P(v|[actin]), applicable to relatively small data sets.
Linear models which include varying past history convolve the actin density dactin(i) with a fixed causal linear kernel rj of nr terms to produce a predicted velocity  , where nr is the number of frames in the past used to make the prediction. The simple linear model is the case where nr = 1. Although in general the kernel can have any set of coefficients rj, we are interested in the optimal model, i.e., the values of rj which minimize the speed prediction error. These values could be different for each bacterium, and we used each individual's own history as a best guide to estimating these values. To calculate this kernel we used linear estimation techniques (24) as described in Materials and Methods from a portion of the motion and fluorescence data from each bacterium. This is mathematically equivalent to calculating the causal transfer function between dactin(i) and νactual(i), or calculating the general linear least-squares fit between νactual(i) and a linear combination of dactin(i) and its time derivatives.
Examples of actual and predicted velocities for the six typical bacteria, calculated using varying amounts of past history nr are shown in Fig. 12, A and B. The quality of the predictions generally increased as a function of increasing past history Fig. 12 C as seen by the falling value of normalized χ2, but plateaued with more than three or four terms, indicating that the time frame over which speed changes couple to changes in actin density was on the order of 6–8 s. On inspection of typical kernel values, we found that the optimal model effectively uses the time derivative in addition to the instantaneous actin density in predicting speed.
FIGURE 12.

Calculation of the accuracy with which a linear model predicts bacterial speed given actin density. (A) Example predicted (colored traces) and actual (gray traces) instantaneous velocities for the six representative bacteria, with colors and numbers as in previous figures. Predicted velocities are calculated as described in the text for nr = 1, for a location 1 μm behind the bacterial centroid on the long axis of the bacterium. Normalized χ2 scores are calculated as described in the text and shown next to each trace. (B) Scatter-plot of predicted versus actual instantaneous velocities. Dark crosses represent the standard deviations of actual and predicted speed distributions for each individual bacterium, and gray line is unit regression line. Coloration of individual points is as in previous figures, each point represents one pair of predicted/actual instantaneous velocities, as calculated in A. (C) Accuracy of predictions increases as a function of past history included in the calculation. Average χ2 values for the entire population at x = 1 μm behind centroid are shown as a function of increasing number of terms nr used to make the prediction. Because each time additional time-point is 2 s into the past, nr of 1–6 correspond to 2–12 s of history included in making the prediction.
The relatively low absolute values of normalized χ2 suggests that the model is only partially successful in predicting the movement of the bacterium. Although adding more free parameters to the model (as shown below), including information from different parts of the bacterial surface, or including nonlinearities in the model would both increase the predictive power, a certain degree of unpredictability is due to the inherent randomness in both the movement of the bacterium and fluctuations in actin density. Our approach is primarily useful for comparing the relative performance of models, and setting lower limits on the information about speed carried in actin density fluctuations.
Using the same techniques, we asked how different positions on the surface of the bacterium compare in terms of the information they carry about bacterial speed. We calculated how an optimal linear model with a past history nr = 5 (10 s) performed, given information about actin density at different positions on the bacterial surface. How χ2 varied as a function of position is shown for individual examples in Fig. 13 A. Like the maps of cross-correlation, several bacteria showed regions of high information density, but in general the maps varied considerably in shape and size. On average, there was more information for regions near the surface of the bacterium than in the actin tail region, as seen in the average over the entire population shown in Fig. 13 B. The longitudinal cross-sections for the average map showed the same trend of increasing accuracy with increased history, with significant improvement for including terms covering 2–8 s in the past and little improvement between 8 and 10 s. The shape of the longitudinal cross-section also suggests that density fluctuations near the front of the bacterium were more strongly predictive of bacterial motion, despite a much higher concentration of actin near the rear of the bacterium, qualitatively consistent with the results of our earlier cross-correlation analysis.
FIGURE 13.

Actin density near the surface of the bacterium is a better predictor of bacterial speed than density in the tail region. (A) Maps of normalized χ2 error from a linear estimator are plotted for representative bacteria, with numbers as in previous figures. White represents χ2 = 1, and black represents χ2 = 0.93. In this calculation 10 s of previous history were included (nr = 5). Bacteria are centered and oriented as in previous figures. (B) Population average map of χ2 values for 7902 bacteria. Longitudinal cross-section is indicated by black lines. (C) χ2 values along longitudinal cross-section, for nr = 1 to nr = 5 indicated by the darkness of the traces. (D) Corresponding normalized actin (dotted line) and tracking channel (solid line) profile.
DISCUSSION
Variation in average bacterial speed
Our observations suggest that the broad population variation in the average speed of the bacterium is largely determined by factors unique to individual bacteria. Like previous studies of bacterial motility we find that bacteria in Xenopus frog egg cytoplasmic extract move with average speeds typically between 40 and 150 nm/s, and that these speeds are broadly and randomly distributed throughout the population. Previous studies have been unable to distinguish whether the broad distribution of average speeds is due to undersampling, or is a genuine reflection of long-term differences in individual bacterial speeds. Within the limits of our measurements, it appears that the spread of average speeds in the population is in fact due to significant differences among individual bacteria maintained over time. Individual bacteria maintain their characteristic speeds over minutes or longer, even after encounters with obstacles, and there is no evidence for large, slow variations in speed over time. When we resample our population using sample sizes comparable to existing reports and exclude nonmoving bacteria, our measured-population average speeds and standard deviations are comparable to the findings published from smaller sample sizes in the literature (data not shown).
Several previous studies have identified biochemical and physical parameters that can be altered to change the population average speed for actin-based motility, but these potential sources of variation cannot account for our observations. For ActA-coated beads with large variations in size and therefore surface curvature, from 0.2 to 10 μm in diameter (12,28,43), average speed is strongly affected by surface curvature. However, the natural range of shape variation in our bacterial population (10% variation width and 20% variation in length) is insufficient to account for the large degree of speed variation among individuals.
The speed of bacteria in cytoplasmic extract with added methylcellulose is correlated with the thermal motion of nearby latex spheres (11), suggesting that local variations in viscosity may contribute to determining bacterial speed. Contrary to this hypothesis, we did not observe any correlation between bacterial speed and position within the microscope slide, or proximity to faster or slower moving bacteria. On several occasions, rapidly and slowly moving bacteria traveled through the same region of the slide without changing speed, suggesting that the differences in speed that we observed were not due to variations in the local composition of the extract. Although the overall extract viscosity may indeed affect the population average speed, it does not seem that local variations in viscosity could be responsible for the differences among individual bacteria.
One of the requirements for sustained bacterial movement is the regeneration of free actin monomer through ATP hydrolysis. It is therefore possible that slow changes in the free ATP concentration in the extract affect the speed of bacteria over time, or that variations in speed among individuals may be affected by spatial variations in ATP or actin monomer availability. As noted above, however, rapidly and slowly moving bacteria were frequently seen to be very close to one another, indicating that the latter explanation is unlikely. We did observe a decrease in the population average speed as a function of age of the extract on the slide. Speeds decreased at very early times (<30 min) and at late times (>180 min) where secondary processes such as movement initiation (38), or ATP depletion (15), would be expected, and on a much slower timescale than our observations of individual bacteria. Nonetheless, even during early, middle, and late phases, the distribution of characteristic speeds remained broadly distributed and there was no indication from our measurements of systematic changes occurring on the 5–10 min timescale. Without being able to track individual bacteria for longer periods (>30 min), we cannot yet distinguish whether the gradual shift in the characteristic speed distribution is due to a very slow shift in individual bacterial speeds, or to a decrease in the fraction of faster moving bacteria with a concomitant increase in the number of slower moving bacteria.
Our results most strongly support the hypothesis that differences in average speed among individual bacteria are due to long-lasting biochemical or physical differences among bacteria. For example, the amount and distribution of the ActA protein varies among different bacterial cells depending on their stage in the cell cycle (44). Although the average surface density of ActA does not appear to significantly affect speed (28), the distribution of ActA does, such that bacteria with relatively greater amounts of ActA along the sides or near the leading pole tend to have slower speeds (38). Consistent with this hypothesis, we have observed that high actin densities along the sides or near the front of moving bacteria are negatively correlated with speed, both at the level of population averages and for temporal fluctuations in speed for individuals. Another possible source of long-lived variation comes from the autocatalytic nature of actin polymerization; because the Arp2/3 complex activated by ActA nucleates a new actin filament most effectively when it is also bound to the side of a preexisting actin filament (9,45), the growth and density of an actin gel can depend strongly on its previous structure. We propose that ActA distribution and other persistent variations in the structure of the bacterium-comet tail system may be primarily responsible for the large amount of individual-to-individual variation in average speed that we have documented here.
Variations in bacterial motion over time
We have shown that variation in the speed of movement of an individual bacterium over time can be attributed to three sources: singular collisions with obstacles, uniform stochastic noise, and regular periodic fluctuations. The rate of collisions is determined by the density and average speed of bacteria in the extract. Positional noise in tracking, thermal noise in the form of lateral bending of the actin tail, and genuine variations in the forward rate of movement contribute, to varying degrees, to stochastic and periodic variation. Significant periodic motion is characteristic of a subset (13%) of wild-type bacteria under normal conditions.
Steplike motion and periodic motion are both thought to be closely related to the mechanism of force production and regulation of movement. In high-resolution measurements, bacteria move with small, nanometer-scale steps (11,19) attributed to discrete bond breakage events at the bacterial surface (17,46). Under certain conditions, both bacteria and beads also move with large, regular micrometer-scale steps (12,30,39), which have been modeled as the catastrophic breakage of the adhesive bond between the bacterium and surrounding actin gel (18).
One of the important questions raised is whether the size or frequency of steplike motion is, like average speed, a characteristic of individual bacteria. Existing data and models are equivocal. For instance, nanometer-scale steps appear to be on the order of the spatial periodicity of the actin filament (19), leading to the hypothesis that step size may be closely related to the actin filament periodicity, regardless of bacterial geometry. On the other hand, the size and frequency of micrometer-scale variations in elastic gel models appears to depend upon the geometry and surface characteristics of individual particles (12,18), leading to the hypothesis that the geometry of the bacterium critically determines step size for these large-scale periodic variations. Supporting this hypothesis, large beads in purified extract appear to move with fixed temporal period with a spatial period inversely dependent upon bead size (12). Individual recordings for mutant bacteria suggested a spatial period that varies between 1 and 4 μm (30), approximately the same order as the bacterial length (1 μm); however, this sample consisted of just three bacteria.
Our technique cannot currently resolve nanometer-scale steps and so we cannot directly answer the question of whether the size or frequency of nanometer-scale steps are correlated with average bacterial speed. We did find, however, that the time constant of the strongest large-scale periodic oscillations appeared to be linearly correlated with average speed with a period slightly under one bacterial length. This period is on the same scale as the size of the bacterium, supporting the hypothesis that a relatively simple geometric mechanism may determine the size of large steps. One prediction of this hypothesis is that the spatial period of the motion of smaller and larger objects, such as latex beads, or strains of bacteria of different sizes, should vary with the length of the object.
Our finding that periodic oscillations are widespread and quite strong, compared to the stochastic component in a large fraction of the wild-type bacterial population, is quite surprising. Although the prevailing view had been that periodic oscillations were an isolated property of particular mutants (18,30) or a secondary phenomenon related to the characteristics of the enclosing chamber or the physical properties of the propelled object (12,39), our data suggest that this phenomenon is fairly common even for wild-type bacteria moving under normal conditions, with statistically significant regular periodicity in the movement of >∼13% (as compared with a 0.1% predicted fraction). That the periodicity is slow (on the order of 10–30 s for bacteria moving at typical speeds) compared to typical time constants for the biochemical reaction in the system (microseconds for actin diffusion and binding) suggests that this timescale may be more a reflection of the typical speeds and lengths of the system than of a slow biochemical process, but without further experimental evidence, both mechanisms are possible.
Co-variation between actin tail density and speed
We found that the actin tail generally increased in length with increasing speed, as expected from previous studies. We also show strong evidence for a distinct transition in actin tail shape between nonmoving and moving bacteria that occurs near 10 nm/s, corresponding to the transition from an actin cloud to an actin tail as originally described morphologically (40). Strikingly, we have found that the actin tail shape of moving bacteria can be closely described by a simply parameterized blurred exponential function which changes systematically with average speed. As expected, the exponential spatial constant increased linearly with speed, corresponding to a fixed temporal decay time constant of ∼30 s. The width of the blurring function was on the order predicted from optical effects and is independent of speed, as might be expected from a combined optical and diffusion effect. The shift in the tail anchor position could reflect a change in the underlying tail profile near the rear of the bacterium. This simple parameterization may be useful in future quantitative studies of actin tail formation and function.
Our observations of actin tail density as bacteria collide with objects and our cross-correlation analysis contradict specific aspects of existing theories of actin polymerization-based motility, and suggest that changes in actin gel density may be important to account for in future models. In Brownian ratchet models, forward motion is the product of a continuous balance between thermally driven, polymerization-rectified forward motion and resistive forces (16,17). A common characteristic of this class of models is that the density of the actin tail does not influence the speed of the bacterium. Our observations show the contrary; for example, on encountering obstacles such as bacterial tails, bacteria slow, and the density of actin on the back surface and some distance behind the bacterium increases. This behavior is consistent with previous observations of variations in actin tail density in static immunofluorescence micrographs, and variations in the density of actin tails behind ActA mutant bacteria undergoing saltatory motion (30), and is quantitatively and systematically captured in the cross-correlation map between actin density and instantaneous speed for individual bacteria, where there is a positive correlation between speed and actin density behind the bacterium, and a negative correlation along the sides and near the front of the bacterium. In the elastic gel models proposed to explain periodic speed variations (18) the gel itself is assumed to be incompressible, so actin density variations due to compression are not predicted. The only current biophysical models which predict changes in actin density with speed or load are computational models of growing branched actin networks near barriers (47,48). These simulations suggest that the density of a growing branched actin gel should become higher as the resistive force increases, such that net velocity remains nearly constant. Our results demonstrate that the compensation of increased force generated by increased actin density is not quite sufficient to maintain constant speed, such that, in reality, both net speed and actin gel density vary periodically.
Our measurements do indicate that the actin density near the front of the bacterium is inversely correlated with bacterial velocity; this is qualitatively consistent with the elastic gel model in that the retarding force is roughly proportional to the thickness of the elastic gel surrounding the bacterial surface and that in certain regimes, the bacterium may be pushed forward rapidly enough to escape the retarding layer, which then grows back slowly. Our finding that there is no correlation between the dimensions of the bacterium (either length or width or the ratio of the two) and the average rate of motion suggests, however, that this model, which is highly dependent upon the radius of curvature of the back end of the bacterium, may not determine the characteristic rate of forward movement.
Our comparison of the performance of several linear models suggests that movement depends on both the past history and position of fluctuations in actin density near the bacterial surface. During the 5–10 s history, the bacterium travels approximately one-quarter to one-half length. This is on the same order as the spatial period observed for periodic fluctuations. The fluctuations near the front of the bacterium are more predictive of speed, despite the lower average actin density near the front. Although the performance of models that have more free parameters, or that include nonlinearities may be higher, it is also correspondingly more difficult to test and interpret the physical basis for these models; we believe that more experiments, rather than more modeling, are required to elucidate the relationship between actin tail density and the rate of bacterial movement.
From our observations, we speculate that a stochastic, density-dependent frictional reaction acting along the surface of the bacterium may regulate the movement of the bacterium, a frictional mechanism similar to that proposed in the elastic gel model (18). Sudden rupture of the frictional bonds could result in movement forward of approximately one-bacterial-length, resulting in periodic speed oscillations with the correct cross-correlation between the actin gel density and the rate of movement. Variations in surface bond density could influence the rupture threshold and the relaxation distance, such that most parameters will give essentially smooth and constant movement as observed for ∼70% of our large population. In this model, bacterial motion is regulated primarily by the rate of rupture of frictional surface bonds. One difference between this model and existing models is that, although the energy for rupture ultimately comes from the polymerization reaction, the release of this energy and thus variability in movement is regulated by the rate of dissociation of bonds between the bacterial surface and the actin tail.
SUPPLEMENTARY MATERIAL
An online supplement to this article can be found by visiting BJ Online at http://www.biophysj.org.
Supplementary Material
References
- 1.Cameron, L. A., P. A. Giardini, F. S. Soo, and J. A. Theriot. 2000. Secrets of actin-based motility revealed by a bacterial pathogen. Nat. Rev. Mol. Cell Biol. 1:110–119. [DOI] [PubMed] [Google Scholar]
- 2.Goldberg, M. B. 2001. Actin-based motility of intracellular microbial pathogens. Microbiol. Mol. Biol. Rev. 65:595–626. [DOI] [PMC free article] [PubMed] [Google Scholar]
- 3.Pantaloni, D., C. Le Clainche, and M. F. Carlier. 2001. Mechanism of actin-based motility. Science. 292:1502–1506. [DOI] [PubMed] [Google Scholar]
- 4.Dabiri, G. A., J. M. Sanger, D. A. Portnoy, and F. S. Southwick. 1990. Listeria monocytogenes moves rapidly through the host-cell cytoplasm by inducing directional actin assembly. Proc. Natl. Acad. Sci. USA. 87:6068–6072. [DOI] [PMC free article] [PubMed] [Google Scholar]
- 5.Nanavati, D., F. T. Ashton, J. M. Sanger, and J. W. Sanger. 1994. Dynamics of actin and α-actinin in the tails of Listeria monocytogenes in infected PtK2 cells. Cell Motil. Cytoskeleton. 28:346–358. [DOI] [PubMed] [Google Scholar]
- 6.Lacayo, C. I., and J. A. Theriot. 2004. Listeria monocytogenes actin-based motility varies depending on subcellular location: a kinematic probe for cytoarchitecture. Mol. Biol. Cell. 15:2164–2175. [DOI] [PMC free article] [PubMed] [Google Scholar]
- 7.Theriot, J. A., J. Rosenblatt, D. A. Portnoy, P. J. Goldschmidt-Clermont, and T. J. Mitchison. 1994. Involvement of profilin in the actin-based motility of L. monocytogenes in cells and in cell-free extracts. Cell. 76:505–517. [DOI] [PubMed] [Google Scholar]
- 8.Welch, M. D., A. Iwamatsu, and T. J. Mitchison. 1997. Actin polymerization is induced by Arp2/3 protein complex at the surface of Listeria monocytogenes. Nature. 385:265–269. [DOI] [PubMed] [Google Scholar]
- 9.May, R. C., M. E. Hall, H. N. Higgs, T. D. Pollard, T. Chakraborty, J. Wehland, L. M. Machesky, and A. S. Sechi. 1999. The Arp2/3 complex is essential for the actin-based motility of Listeria monocytogenes. Curr. Biol. 9:759–762. [DOI] [PubMed] [Google Scholar]
- 10.Loisel, T. P., R. Boujemaa, D. Pantaloni, and M. F. Carlier. 1999. Reconstitution of actin-based motility of Listeria and Shigella using pure proteins. Nature. 401:613–616. [DOI] [PubMed] [Google Scholar]
- 11.McGrath, J. L., N. J. Eungdamrong, C. I. Fisher, F. Peng, L. Mahadevan, T. J. Mitchison, and S. C. Kuo. 2003. The force-velocity relationship for the actin-based motility of Listeria monocytogenes. Curr. Biol. 13:329–332. [DOI] [PubMed] [Google Scholar]
- 12.Bernheim-Groswasser, A., S. Wiesner, R. M. Golsteyn, M. F. Carlier, and C. Sykes. 2002. The dynamics of actin-based motility depend on surface parameters. Nature. 417:308–311. [DOI] [PubMed] [Google Scholar]
- 13.Schwartz, I. M., M. Ehrenberg, M. Bindschadler, and J. L. McGrath. 2004. The role of substrate curvature in actin-based pushing forces. Curr. Biol. 14:1094–1098. [DOI] [PubMed] [Google Scholar]
- 14.Giardini, P. A., and J. A. Theriot. 2001. Effects of intermediate filaments on actin-based motility of Listeria monocytogenes. Biophys. J. 81:3193–3203. [DOI] [PMC free article] [PubMed] [Google Scholar]
- 15.Marchand, J. B., P. Moreau, A. Paoletti, P. Cossart, M. F. Carlier, and D. Pantaloni. 1995. Actin-based movement of Listeria monocytogenes: actin assembly results from the local maintenance of uncapped filament barbed ends at the bacterium surface. J. Cell Biol. 130:331–343. [DOI] [PMC free article] [PubMed] [Google Scholar]
- 16.Mogilner, A., and G. Oster. 1996. Cell motility driven by actin polymerization. Biophys. J. 71:3030–3045. [DOI] [PMC free article] [PubMed] [Google Scholar]
- 17.Mogilner, A., and G. Oster. 2003. Force generation by actin polymerization II: the elastic ratchet and tethered filaments. Biophys. J. 84:1591–1605. [DOI] [PMC free article] [PubMed] [Google Scholar]
- 18.Gerbal, F., P. Chaikin, Y. Rabin, and J. Prost. 2000. An elastic analysis of Listeria monocytogenes propulsion. Biophys. J. 79:2259–2275. [DOI] [PMC free article] [PubMed] [Google Scholar]
- 19.Kuo, S. C., and J. L. McGrath. 2000. Steps and fluctuations of Listeria monocytogenes during actin-based motility. Nature. 407:1026–1029. [DOI] [PubMed] [Google Scholar]
- 20.Theriot, J., and D. C. Fung. 1997. Use of Xenopus egg extracts for studies of actin-based motility. In Cell Biology: A Laboratory Handbook, 2nd Ed. J.E. Celis, editor. Academic Press, NY. 157–175.
- 21.Murray, M. T., G. Krohne, and W. W. Franke. 1991. Different forms of soluble cytoplasmic mRNA binding proteins and particles in Xenopus laevis oocytes and embryos. J. Cell Biol. 112:1–11. [DOI] [PMC free article] [PubMed] [Google Scholar]
- 22.Leimeister-Wachter, M., and T. Chakraborty. 1989. Detection of listeriolysin, the thiol-dependent hemolysin in Listeria monocytogenes, Listeria ivanovii, and Listeria seeligeri. Infect. Immun. 57:2350–2357. [DOI] [PMC free article] [PubMed] [Google Scholar]
- 23.Wilson, R. L., A. R. Tvinnereim, B. D. Jones, and J. T. Harty. 2001. Identification of Listeria monocytogenes in in-vivo induced genes by fluorescence-activated cell sorting. Infect. Immun. 69:5016–5024. [DOI] [PMC free article] [PubMed] [Google Scholar]
- 24.Press, W. H., S. A. Teukolsky, W. T. Vetterling, and B. P. Flannery. 1992. Numerical Recipes in C. Cambridge University Press, New York.
- 25.Wiesner, S., E. Helfer, D. Didry, G. Ducouret, F. Lafuma, M. F. Carlier, and D. Pantaloni. 2003. A biomimetic motility assay provides insight into the mechanism of actin-based motility. J. Cell Biol. 160:387–398. [DOI] [PMC free article] [PubMed] [Google Scholar]
- 26.Smith, G. A., J. A. Theriot, and D. A. Portnoy. 1996. The tandem repeat domain in the Listeria monocytogenes ActA protein controls the rate of actin-based motility, the percentage of moving bacteria, and the localization of vasodilator-stimulated phosphoprotein and profilin. J. Cell Biol. 135:647–660. [DOI] [PMC free article] [PubMed] [Google Scholar]
- 27.Rosenblatt, J., B. J. Agnew, H. Abe, J. R. Bamburg, and T. J. Mitchison. 1997. Xenopus actin depolymerizing factor/cofilin (XAC) is responsible for the turnover of actin filaments in Listeria monocytogenes tails. J. Cell Biol. 136:1323–1332. [DOI] [PMC free article] [PubMed] [Google Scholar]
- 28.Cameron, L. A., M. J. Footer, A. van Oudenaarden, and J. A. Theriot. 1999. Motility of ActA protein-coated microspheres driven by actin polymerization. Proc. Natl. Acad. Sci. USA. 96:4908–4913.10220392 [Google Scholar]
- 29.Theriot, J. A., T. J. Mitchison, L. G. Tilney, and D. A. Portnoy. 1992. The rate of actin-based motility of intracellular Listeria monocytogenes equals the rate of actin polymerization. Nature. 357:257–260. [DOI] [PubMed] [Google Scholar]
- 30.Lasa, I., E. Gouin, M. Goethals, K. Vancompernolle, V. David, J. Vandekerckhove, and P. Cossart. 1997. Identification of two regions in the N-terminal domain of ActA involved in the actin comet tail formation by Listeria monocytogenes. EMBO J. 16:1531–1540. [DOI] [PMC free article] [PubMed] [Google Scholar]
- 31.Geese, M., K. Schluter, M. Rothkegel, B. M. Jockusch, J. Wehland, and A. S. Sechi. 2000. Accumulation of profilin II at the surface of Listeria is concomitant with the onset of motility and correlates with bacterial speed. J. Cell Sci. 113:1415–1426. [DOI] [PubMed] [Google Scholar]
- 32.Sanger, J. M., J. W. Sanger, and F. S. Southwick. 1992. Host cell actin assembly is necessary and likely to provide the propulsive force for intracellular movement of Listeria monocytogenes. Infect. Immun. 60:3609–3619. [DOI] [PMC free article] [PubMed] [Google Scholar]
- 33.Lauer, P., J. A. Theriot, J. Skoble, M. D. Welch, and D. A. Portnoy. 2001. Systematic mutational analysis of the amino-terminal domain of the Listeria monocytogenes ActA protein reveals novel functions in actin-based motility. Mol. Microbiol. 42:1163–1177. [DOI] [PubMed] [Google Scholar]
- 34.Auerbuch, V., J. J. Loureiro, F. B. Gertler, J. A. Theriot, and D. A. Portnoy. 2003. Ena/VASP proteins contribute to Listeria monocytogenes pathogenesis by controlling temporal and spatial persistence of bacterial actin-based motility. Mol. Microbiol. 49:1361–1375. [DOI] [PubMed] [Google Scholar]
- 35.Rutenberg, A. D., and M. Grant. 2001. Curved tails in polymerization-based bacterial motility. Phys. Rev. E Stat. Nonlin. Soft Matter Phys. 64:021904. [DOI] [PubMed] [Google Scholar]
- 36.Dunn, G. A. 1983. Characterising a kinesis response: time averaged measures of cell speed and directional persistence. Agents Actions Suppl. 12:14–33. [DOI] [PubMed] [Google Scholar]
- 37.Vignjevic, D., D. Yarar, M. D. Welch, J. Peloquin, T. Svitkina, and G. G. Borisy. 2003. Formation of filopodia-like bundles in vitro from a dendritic network. J. Cell Biol. 160:951–962. [DOI] [PMC free article] [PubMed] [Google Scholar]
- 38.Rafelski, S. M., and J. A. Theriot. 2004. Crawling toward a unified model of cell motility: spatial and temporal regulation of actin dynamics. Annu. Rev. Biochem. 73:209–239. [DOI] [PubMed] [Google Scholar]
- 39.Fung, D. C., and J. Theriot. 1998. Movement of bacterial pathogens driven by actin polymerization. In Motion Analysis of Living Cells. D. Soll, editor. John Wiley and Sons, New York. 157–175.
- 40.Tilney, L. G., and D. A. Portnoy. 1989. Actin filaments and the growth, movement, and spread of the intracellular bacterial parasite, Listeria monocytogenes. J. Cell Biol. 109:1597–1608. [DOI] [PMC free article] [PubMed] [Google Scholar]
- 41.Mounier, J., A. Ryter, M. Coquis-Rondon, and P. J. Sansonetti. 1990. Intracellular and cell-to-cell spread of Listeria monocytogenes involves interaction with F-actin in the enterocytelike cell line Caco-2. Infect. Immun. 58:1048–1058. [DOI] [PMC free article] [PubMed] [Google Scholar]
- 42.Tilney, L. G., D. J. DeRosier, A. Weber, and M. S. Tilney. 1992. How Listeria exploits host cell actin to form its own cytoskeleton. II. Nucleation, actin filament polarity, filament assembly, and evidence for a pointed end capper. J. Cell Biol. 118:83–93. [DOI] [PMC free article] [PubMed] [Google Scholar]
- 43.Cameron, L. A., J. R. Robbins, M. J. Footer, and J. A. Theriot. 2004. Biophysical parameters influence actin-based movement, trajectory, and initiation in a cell-free system. Mol. Biol. Cell. 15:2312–2323. [DOI] [PMC free article] [PubMed] [Google Scholar]
- 44.Kocks, C., R. Hellio, P. Gounon, H. Ohayon, and P. Cossart. 1993. Polarized distribution of Listeria monocytogenes surface protein ActA at the site of directional actin assembly. J. Cell Sci. 105:699–710. [DOI] [PubMed] [Google Scholar]
- 45.Mullins, R. D., J. A. Heuser, and T. D. Pollard. 1998. The interaction of Arp2/3 complex with actin: nucleation, high affinity pointed end capping, and formation of branching networks of filaments. Proc. Natl. Acad. Sci. USA. 95:6181–6186. [DOI] [PMC free article] [PubMed] [Google Scholar]
- 46.Alberts, J. B., and G. M. Odell. 2004. In silico reconstitution of Listeria propulsion exhibits nano-saltation. PLoS Biol. 2:e412. [DOI] [PMC free article] [PubMed] [Google Scholar]
- 47.Carlsson, A. E. 2001. Growth of branched actin networks against obstacles. Biophys. J. 81:1907–1923. [DOI] [PMC free article] [PubMed] [Google Scholar]
- 48.Carlsson, A. E. 2003. Growth velocities of branched actin networks. Biophys. J. 84:2907–2918. [DOI] [PMC free article] [PubMed] [Google Scholar]
Associated Data
This section collects any data citations, data availability statements, or supplementary materials included in this article.