

Abstract
Biological membranes are known to contain compositional heterogeneities, often termed rafts, with distinguishable composition and function, and these heterogeneities participate in vigorous transport processes. Membrane lipid phase coexistence is expected to modulate these processes through the differing mechanical properties of the bulk domains and line tension at phase boundaries. In this contribution, we compare the predictions from a shape theory derived for vesicles with fluid phase coexistence to the geometry of giant unilamellar vesicles with coexisting liquid-disordered (Ld) and liquid-ordered (Lo) phases. We find a bending modulus for the Lo phase higher than that of the Ld phase and a saddle-splay (Gauss) modulus difference with the Gauss modulus of the Lo phase being more negative than the Ld phase. The Gauss modulus critically influences membrane processes that change topology, such as vesicle fission or fusion, and could therefore be of significant biological relevance in heterogeneous membranes. Our observations of experimental vesicle geometries being modulated by Gaussian curvature moduli differences confirm the prediction by the theory of Juelicher and Lipowsky.
INTRODUCTION
Bilayer lipid membranes with microscopically resolvable coexisting fluid domains, a so-called liquid-ordered phase (Lo) and a liquid-disordered phase (Ld), have recently become a field of intensive research (1–6). The desire to understand the physicochemical principles of lipid fluid domain coexistence arises from the hypothesized coupling of lipid phase segregation to fundamental cell biological processes, such as membrane signaling, trafficking, and sorting of membrane components (7,8). This raft hypothesis, which proposes cell membrane signaling platforms to critically depend on the existence of membrane domains, and its relation to domain formation in model membrane systems, is currently a matter of considerable debate (9–11).
Lateral membrane inhomogeneity is often discussed in the context of essentially flat membranes. Highly curved membranes are, however, found in many functionally distinct regions of the cellular plasma membrane, such as caveolae, clathrin-coated pits, microvilli, endocytic and secretory vesicles, the internal membranes of endosomes, and parts of the endoplasmic reticulum and Golgi apparatus. Membrane trafficking involves changing membrane curvatures (e.g., by tubulation, budding, fission, or fusion; see Ref. 12) and is often mediated by proteins (13), but is clearly affected by the lipid composition (14–17). Addressing the influence of lipid phase behavior and the physical properties of membrane domains and domain boundaries on fundamental biological membrane processes involving the third dimension is just beginning (18,19). However, there is growing evidence that lipid domains play an important role in membrane trafficking events such as the clathrin-independent endocytosis pathway (20,21).
The three-dimensional shape of laterally homogeneous (model) membranes is theoretically understood relatively well (22–24). Hence, the focus of theoretical membrane elasticity research is increasingly directed to membranes showing coexisting fluid domains (25–30), which now can be experimentally observed on micrometer lengthscales.
The physicochemical understanding of membrane phase segregation greatly benefits from model membrane research, because these well-defined systems allow for the systematic analysis of the influence of precisely adjustable control parameters. Using this approach, the phase behavior of ternary lipid mixtures, involving cholesterol and both long-chain saturated lipids that enrich in an Lo phase and unsaturated or short-chain lipids that enrich in an Ld phase, has been examined (3–5,31–33). At appropriate conditions, the phase diagrams of these lipid mixtures show extended regions where two-dimensional segregation into domains with dimensions in the range of several microns is found. These domains are often circular. After mechanical distortion, these fluid domains rapidly equilibrate to their circular shape; accordingly, significant line tension exists at the phase boundary (2). It was recently demonstrated that in addition to this two-dimensional boundary perimeter minimization, line tension drives out-of-plane curvature, budding, and fission at the phase boundary (5). These findings confirmed earlier theoretical predictions (14). The curvature elasticity theory developed by Lipowsky's group (14,25,34), was used to estimate mechanical parameters of vesicles with fluid phase coexistence (5). A first integral of the differential shape equations (25) led to a fitting routine to determine the relative bending moduli and lateral tensions of the coexisting phases and the line tension and normal pressure difference across the membrane, from the experimental vesicle geometry (5).
In this report numerically determined vesicle shapes are compared to a typical experimentally obtained vesicle geometry. It is demonstrated that the line tension and normal pressure difference, the relative magnitudes of bending moduli, and difference in Gauss moduli, have significant distinguishable effects on the neck geometry of vesicles with fluid phase coexistence. To the best of our knowledge, for the first time we experimentally show the effect of Gaussian curvature moduli differences on membrane shapes and in a special case obtain an estimate of its magnitude. Gaussian curvature resistance is reported to play a significant role in intermediate stages of vesicle fusion (35). Furthermore, differences in Gaussian curvature moduli, line tension, and differing bending moduli are known to critically influence the energetic feasibility of dynamical vesicle budding and fission events (25,34), and the fission of membrane tubes (36). Consequently, the mechanical analysis in the present work could have significant biological relevance.
In the following section, we provide a review of quantities and physical relations necessary for examining membrane mechanics. A section on experimental results describes vesicle geometries with fluid phase coexistence and line tension. Afterward, experimental vesicle geometries are compared to numerically obtained vesicle shapes with systematically varied parameters. The discussion then compares the mechanical parameters obtained for vesicles with Lo/Ld phase coexistence to known properties of liquid-ordered and liquid-disordered phases.
BASICS OF MEMBRANE MECHANICS AND MATERIALS AND METHODS
Detailed discussions of fluid membrane geometries are available in the literature. Two main approaches can be distinguished. In the first, differential shape equations are derived from minimizing a global energy functional (22,25,37). The second method is based on balancing forces and moments acting on a local membrane area element (38–40). These two approaches can be shown to be equivalent (41). Juelicher and Lipowsky derived a membrane shape theory for vesicles with fluid phase coexistence based on the first approach (25,34) and the assumption of line tension coupling to membrane curvature (14). This theoretical prediction was recently confirmed experimentally (5). The theory of Juelicher and Lipowsky furthermore predicts a characteristic contribution of differing Gaussian curvature resistances between membrane phases. We shall demonstrate the experimental observation of this effect. We will furthermore provide a mechanical interpretation of the boundary conditions originally derived by Juelicher and Lipowsky (25) in terms of jumps of lateral stress and transverse shear (see Appendix A). In the following, we review the terminology and basic mechanical relations necessary for our comparison between experimental and theoretical vesicle shapes. We express shape equations and phase boundary jump conditions in terms of force and moment balance, since this allows a mechanically intuitive expression of the jump conditions.
For a fluid, laterally incompressible membrane, with inner and outer leaflet indistinguishable, and with the long axis of the constituting molecules directed along the membrane surface normal, it can be shown (38,42) that the bending free energy per unit membrane area w, is a function of h2 and k, i.e., w = w(h2,k), where h and k are the mean and Gauss curvatures of the membrane. The simplest form of w is
 |
(1) |
where κ and κG are the bending rigidities corresponding to mean and Gauss curvature, respectively (23,38). The total bending energy of the membrane is obtained from an integration of Eq. 1 over the whole membrane area, A. The Gauss-Bonnet theorem (43) in the case of membranes with spherical topology results in
 |
(2) |
This shows that the area integral over Gaussian curvature decomposes into a constant bulk term and a boundary term. This boundary term depends on the integral over the geodesic curvature, cg, along the boundary, s. Consequently, for homogenous, closed vesicles, shape changes preserving the vesicle topology do not contribute to the total Gaussian curvature (22,42). Hence, Eq. 1 can be simplified to w = 2κh2. For phase-separated membranes, however, the Gauss curvature rigidity plays an important role. In that case, Juelicher and Lipowsky (25) showed that although the vesicle bulk shape equations do not contain any term involving κG, the Gauss curvature rigidity enters through the jump conditions that connect the bulk equations at the interface between the different phases.
In the present analysis, a closed axially symmetric lipid bilayer membrane consisting of two equilibrated phases is considered. The membrane geometry is parameterized with respect to arc length along the meridian, s, and tangent angle ψ (see Fig. 1). In this case, the mean curvature is given by h = −1/2ψ′+ sin ψ/r) = 1/2(cm + cp), where cm and cp are meridional curvature and curvature along the circular parallels of the axially symmetric membrane, respectively, r is the distance from the axis of revolution, and a prime indicates derivative with respect to arc length, s. For axially symmetric shapes, the geodesic curvature is given by cg = cosψ/r (25).
FIGURE 1.

Axially symmetric parameterization of a phase-separated membrane. The arc length s, can be defined in terms of a generalized coordinate S. The phase boundary is found at the value s* = s(S*).
The out-of-plane bulk force balance equation can be expressed as (39–41)
 |
(3) |
where Qs is the transverse (i.e., along the surface normal) shear traction per unit length acting on an edge along the parallels,  and
and  are lateral stress components along the meridian and parallels (θ is the azimuthal angle), respectively, and p is the net pressure per unit area of the membrane acting along the inward surface normal direction; i.e., p is an outer excess pressure.
The in-plane balance of forces can be written as
 |
(4) |
We furthermore show in Appendix A that the jump conditions derived by Juelicher and Lipowsky (25) are equivalent to the expressions in Eqs. 5 and 6,
 |
(5) |
for the jump in lateral stress, where (−) indicates the value before and (+) the value after the phase jump (in the direction away from the north pole of the vesicle), respectively. The jump condition for transverse shear is
 |
(6) |
Accordingly, the jump in lateral stress is equal to line tension multiplied by the geodesic curvature along the boundary, whereas the jump in transverse shear is simply line tension multiplied by the principal curvature along the boundary.
It can be shown that tensions  and
and  and transverse shear Qs are related to curvature, mean curvature bending resistance, κ, and mean tension, d, in the membrane (42) by
  and Qs = −2κh′. The Gaussian curvature enters the condition for zero jump in moments across the boundary,
  through the constitutive equation
  (25,42).
To solve the system of differential shape equations for a membrane with coexisting phases, we introduce the following dimensionless parameters (25): ɛ = κ−/κ+ is the ratio between the mean curvature bending rigidities of the two regions;  provides a measure of the difference in Gaussian curvature rigidities between the two regions; and dimensionless transverse shear, mean lateral tension, line tension, and pressure are
 |
(7) |
where R0 is the radius of a spherical membrane (vesicle) with the same area as the particular deformed vesicle. All further quantities bearing the dimension of length are non-dimensionalized by R0 as well. The shape equations are simultaneously solved in the (−) and (+) regions of the membrane (for details see Appendix B), subject to appropriate boundary conditions.
In Experimental Results, the experimental geometry of an axially symmetric vesicle with two coexisting fluid phases, a liquid-disordered phase (Ld) and a liquid-ordered phase (Lo), is analyzed. Accordingly, ɛ is defined as ɛ = κLo/κLd, and  is defined as
Materials and methods
Giant liposomes with microscopically visible fluid phase coexistence (1,31) were prepared from lipid mixtures containing the lipids dioleoylphosphatidylcholine (DOPC), egg sphingomyelin (egg SM), and cholesterol. These lipids, as well as the dye N-lissamine rhodamine dipalmitoylphosphatidylcholine (rho-DPPE), were obtained from Avanti Polar Lipids (Birmingham, AL). Perylene was obtained from Sigma/Aldrich (Milwaukee, WI). Lipids were checked for purity by thin-layer chromatography and used without further purification. Rho-DPPE was used at a molar ratio of 1:1000 (dye/lipid), and perylene was added at a molar ratio of 1:500 (dye/lipid). Stock solutions were prepared in chloroform, checked for purity by thin-layer chromatography, and stored at −20°C, before use. Vesicles were prepared by the method of electroswelling (44), at a temperature of 60°C, in a solution of 100 mM sucrose. The elevated temperature ensured that vesicles would form from swollen membranes above the mixing demixing transition temperature. Temperature control during microscopic imaging was performed by means of a small water bath attached to the objective (×60, water immersion) of an inverted microscope (IX 70, Olympus, Melville, NY). Two-photon two-color fluorescence microscopy was performed at an excitation wavelength of λ = 750 nm, using a Radiance scanhead (Biorad, Hercules, CA). The excitation source was a mode-locked Ti:Sapphire laser, pumped by a solid-state Millennia laser (Spectra Physics, Mountain View, CA). The laser polarization was controlled via a Berek polarization compensator (New Focus, San Jose, CA). Circularly polarized light was used to ensure homogenous excitation of fluorophore dipoles embedded into the anisotropic membrane.
Numerical integration of the shape equations was performed with the boundary problem solver BVP4C of the software MatLab (Ver. 6.5, The MathWorks, Natick, MA).
EXPERIMENTAL RESULTS
Fig. 2 shows equatorial sections of axially symmetric, phase-separated vesicles, obtained by two-photon fluorescence microscopy. Lipid-phase-sensitive microscopy was performed with differentially partitioning fluorescence dyes. Three vesicles are depicted in a false color representation with red referring to Ld phase and blue referring to Lo phase (first column). Separated color channels are shown in the second and third columns. The red fluorophore lissamine rhodamine DPPE partitions strongly into the Ld phase (second column), whereas the polycyclic aromatic hydrocarbon perylene, partitions preferentially into the Lo phase (third column) (5).
FIGURE 2.
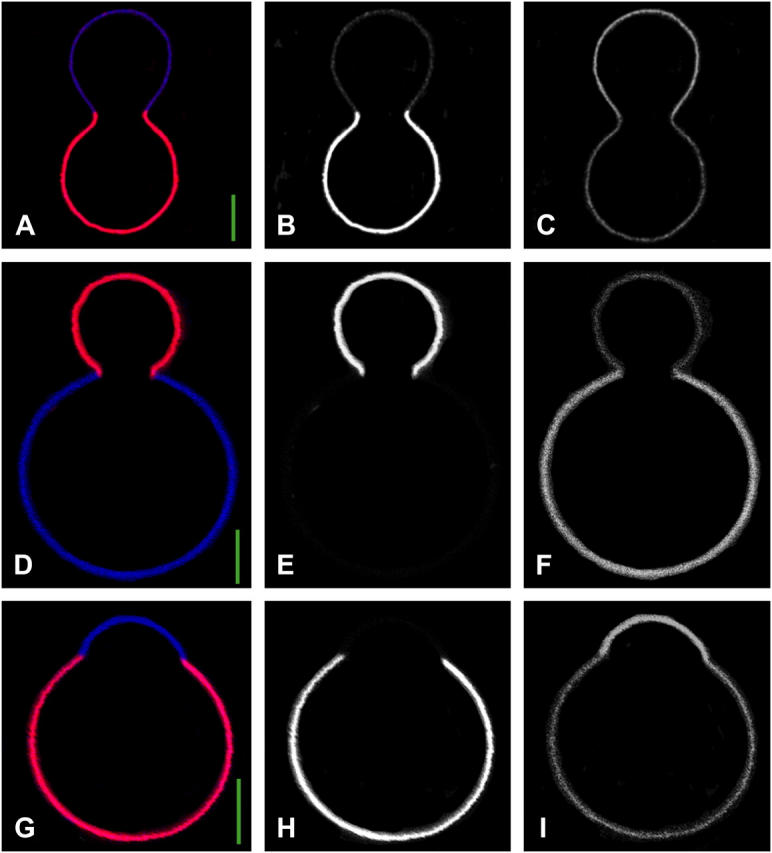
Two photon microscopy images of axially symmetric vesicles with fluid phase coexistence. (A, D, and G) Merged imaging channels. (Red, Ld phase, fluorescence dye lissamine rhodamine DPPE; blue, Lo phase, fluorescence dye perylene.) Vesicle compositions are, as mole fractions of egg SM, DOPC, and cholesterol, respectively, 0.615:0.135:0.25 (A–C, this vesicle was imaged at a temperature of 30°C), 0.584:0.103:0.313 (D–F), and 0.25:0.5:0.25 (G–I), these vesicles were imaged at 23°C. (B, E, and H) Red channel. (C, F, and I) Blue channel. Scale bar is 5 μm.
Vesicles with coexisting fluid domains have shapes and domain morphologies distinctly different from vesicles with gel/fluid phase coexistence. Fluid domains minimize their boundary perimeter to yield circular domain boundaries due to line tension at the phase boundary (2). Budded vesicles with two fluid phases have axially symmetric shapes (5). Gel/fluid phase coexistence, on the other hand, is characterized by irregular domain shapes with an elongated boundary (45–47), due to anisotropic line tension (48) and the high viscosity of the gel phase. Gel phase domains in vesicles with spherical topology are expected to be either planar, or shaped in the form of cylindrical stripes with vanishing Gauss curvature, due to the large bending rigidity and in-plane shear resistance of gel phase membranes (48). Accordingly, the axially symmetric vesicles with minimized phase boundary perimeters depicted in Fig. 2 show two coexisting fluid domains. The vesicles of Fig. 2 refer to a range of area fractions of coexisting domains that depend on the vesicle composition (31). Fig. 2 A (approximately equal area fraction of Ld phase versus Lo phase) shows a vesicle with composition (mole fractions of egg SM, DOPC, and cholesterol, respectively) 0.615:0.135:0.25, this vesicle was imaged at a temperature of 30°C. Fig. 2 D (with Ld phase being the minority phase) refers to the composition 0.584:0.103:0.313, and Fig. 2 G (with Ld phase being the majority phase) shows a vesicle with composition 0.25:0.5:0.25; both of these vesicles were imaged at 23°C.
The quantitative mechanical analysis of vesicle shapes depends on an accurate determination of the vesicle neck geometry. In particular, we show below that the direction of the tangent to the meridional vesicle trace at the location of the phase boundary is critically influenced by the difference between Ld and Lo phase of Gaussian bending moduli. This tangent direction can be accurately determined from the vesicle shown in Fig. 2 A, but can only be estimated in vesicles depicted in Fig. 2, D and G. We therefore focus our quantitative discussion on the vesicle shown in Fig. 2 A, and discuss the shapes of vesicles in Fig. 2, D and G, in a qualitative manner.
The coordinates of the vesicle shown in Fig. 2 A were mapped by a tracing algorithm (5), at 2150 data points with equal arc length increments. The total arc length of the meridional section was 78.5 μm. To allow for convenient comparison between experimental vesicle and simulated vesicle shapes, the total vesicle area, A, was determined from the trace using
 |
(8) |
where integration is performed from north pole to the vesicle south pole. An area A ≈ 1205 μm2 was obtained, leading to a radius of an undeformed sphere with the same area, Ro ≈ 9.8 μm. From this radius and the measured vesicle volume, V, the reduced volume was calculated from
 |
(9) |
which resulted in υ ≈ 0.76. The vesicle coordinates were normalized to the area of the unit sphere: these normalized coordinates are shown in Fig. 3 A. Fig. 3 B depicts tangent angles to the meridional trace, as a function of arc length, measured clockwise from the north pole of the vesicle (see Fig. 1). The dimensionless arc length of Fig. 3 B can be converted to physical units by multiplying with a factor of 78.5 μm/8.01 ≅ 10.2 μm. By definition, the derivative of the tangent angle with respect to arc length is the meridional curvature, cm = −ψ′. The experimental vesicle shape with line tension shown in Fig. 2 A is significantly deformed from the equilibrium shape of a vesicle with a homogenous membrane and with the same reduced volume υ ≈ 0.76 (compare Fig. 4 B, leftmost vesicle shape). High reverse meridional curvature is found in a region near the phase boundary, whereas the vesicle shape outside this boundary layer shows relatively constant curvature, i.e., the shape of a spherical cap. To highlight this fact (and to pronounce the characteristic deviations from spherical caps near the phase boundary), circles were added to the vesicle trace in Fig. 3 A. Note that the membrane geometry is continuous over the phase boundary (as opposed to a kink). The magnitude of meridional neck curvature depends on vesicle composition and temperature (5).
FIGURE 3.

Trace parameterization of the vesicle with fluid phase coexistence shown in Fig. 2 A. (A) Vesicle contour with coordinates normalized with respect to the unit sphere. Reduced volume υ ≈ 0.76, Ld phase area fraction xLd ≈ 0.56, boundary radius rb (right) ≈ 0.34, and rb (left) ≈ −0.34. (Gray, Lo phase; black, Ld phase.) Both upper and lower parts of the meridional vesicle section are compared to circles, to emphasize the characteristic deviations of the membrane shape from spherical caps, in the neck region. (B) Tangent angle as a function of arc length (normalized with respect to unit sphere). Boundary angle ψb (right) ≈ 1.96 rad; ψb (left) ≈ 4.32 rad.
FIGURE 4.

Simulated vesicles with varying line tension but equal curvature moduli of Ld and Lo phases (ɛ = 1 and  ), area fraction equal to experimental shape. (Gray, Lo phase; black, Ld phase.) (A) Freely adjustable volume (pressure difference
  ), from left to right: dimensionless line tension
  4.2, 4.52, 4.382 (rb equal to experimental vesicle, which is shown for comparison with dashed lines), 4.46, and 5.2. (B and C) Vesicle shapes (B) and tangent angles near right phase boundary (C), for vesicles with volume fixed to experimental shape. From left to right (B) and in direction of arrows (C):
  (rb equal to experimental vesicle, which is shown for comparison with dashed lines, B; and as additional plot in C);
A close inspection of the neck geometry reveals characteristic differences between the Lo and Ld phase regions. Upon approaching the neck region, the Ld phase is observed to closely follow the spherical cap and then to bend sharply toward the Lo phase. Accordingly, the high curvature neck region mostly consists of the Ld phase membrane. The same phenomenon is found in the vesicle shown in Fig. 2 D. We demonstrate below that this particular neck geometry in the framework of vesicle shape theories introduced above can only be explained by a difference between the Gaussian curvature moduli of Ld and Lo phases, as has been theoretically predicted (25).
The Lo phase, upon approaching the neck, deviates earlier from the spherical cap than the Ld phase (see the comparison of circles and vesicle shape in Fig. 3 A, and compare tangent angles of vesicle shape and straight lines in Fig. 3 B).
It was previously shown (5) that vesicle shapes with high reverse meridional neck curvature and spherical caps far from the neck are a consequence of line tension at the phase boundary (25), using a first integral of the differential shape equations and the experimental vesicle geometry to optimize mechanical vesicle parameters.
In the following section, it is demonstrated that the detailed neck geometry of vesicles with fluid phase coexistence results from the different elastic material properties of the Ld and Lo phase membranes. To examine the effect of varying particular vesicle parameters, simulated vesicle shapes with systematically varied parameters are compared to the experimental shape. It will be shown that the ratio of mean curvature moduli ɛ, and the dimensionless difference in Gauss moduli  modulate vesicle shapes in characteristically different ways. By comparing the experimental and theoretical shapes, we obtained estimates for both ɛ and
COMPARISON OF EXPERIMENTAL AND SIMULATED VESICLE SHAPES
This section discusses the characteristic influence of varied mechanical parameters in vesicle shapes. We begin with simulated vesicles that have equal curvature moduli in both phases but line tension at the phase boundary, and compare the case of freely adjustable versus fixed vesicle volume. We then proceed to show the variation of vesicle shape with differing mean curvature modulus in coexisting phases (ɛ ≠ 1), where equal Gauss curvature moduli are assumed ( ). Next we show by comparison of the previously mentioned situation to the case of equal mean curvature moduli (ɛ = 1) and differing Gauss curvature moduli (
 ), that both types of curvature moduli affect vesicle shapes in significantly different ways. We finally obtain the best agreement between theory and experiment by analyzing the case of ɛ ≠ 1 and
  and obtain estimates for the difference of mean and Gauss curvature moduli in coexisting fluid lipid phases.
Vesicles with line tension but equal curvature moduli: freely adjustable versus constrained volume
We begin the discussion of vesicle shapes with coexisting phases, deformed by line tension at the boundary, with a series of simulated vesicles with increasing line tension, and equal curvature moduli of the Lo and Ld phases (ɛ = 1 and  ), where the vesicle volume is assumed to be freely adjustable, i.e.,
  and the area fraction of the Ld phase is adjusted to the value of the experimental vesicle (Fig. 2 A), xLd ≈ 0.56. In Fig. 4 A, the neck curvature and line tension increase from left to right. The comparison of the meridional neck curvature of a simulated vesicle with neck radius rb equal to the experimental value rb ≈ 0.34 (simulated vesicle overlaid with the experimental vesicle, which is shown with dashed line, for comparison), indicates smaller meridional neck curvatures in the simulated vesicle. As will be demonstrated below, high meridional neck curvature with large neck radii are obtained in vesicles with inner excess pressure only, where
Fig. 4 B shows simulated vesicles with varying line tension, where the reduced volume of each vesicle is fixed to the experimental value υ ≈ 0.76. The constrained volume is accounted for as an additional boundary condition for the numerical solution of the shape equations and the inner excess pressure results as an eigenvalue of the boundary value problem (see Appendix B for further details). Whereas for homogenous vesicles without line tension, a reduced volume smaller than υ = 1 requires an outer excess pressure ( see Refs. 22 and 43) at mechanical equilibrium, in vesicles with high line tension, it necessitates an inner excess pressure. Fig. 4, B and C, shows the meridional neck curvature to increase with line tension. The volume constraint results in a limit shape of minimum boundary radius (for increasing line tension), which is characterized by spherical caps with a geometry determined by the area fraction and vesicle volume (see the rightmost shape in Fig. 4 B). In case of this limit shape, a balance of forces in the plane of the phase boundary leads to a linear relationship between pressure and line tension according to
 |
(10) |
where ψ1 and ψ2 are the tangent angles right before and right after the phase boundary (5). Note that with high line tension, the meridional neck curvature can become higher than is resolvable by optical microscopy. Accordingly, a kinked neck geometry imaged by fluorescence microscopy, similar to the rightmost vesicle in Fig. 4 B, does not allow for the conclusion that meridional tangent angles show a discontinuity at the phase boundary. For example, the neck geometry of the experimental vesicle displayed in Fig. 2 G is in accordance with the assumption of a continuous neck geometry, as follows from the comparison to the simulated vesicle in Fig. 7 B.
FIGURE 7.

Simulated vesicle shapes with area fraction, reduced volume, and boundary radius equal to the experimental vesicles shown in Fig. 2 D (left) and Fig. 2 G (right). The ratio of mean curvature moduli and dimensionless difference in Gaussian moduli, respectively, were set to ɛ = 5 and  (i.e., the average values found from the analysis of the vesicle shown in Fig. 2 A). Geometrical parameters referring to the simulated shapes are for A: reduced volume υ = 0.84, Ld phase area fraction xLd = 0.18, and boundary radius rb = 0.235; and for B: υ = 0.98, xLd = 0.89, and rb = 0.522. Insets display a comparison of neck geometries for ɛ = 5 and
  (solid lines) and ɛ = 1 and
  (dashed lines).
The comparison of a simulated vesicle having a boundary radius equal to the experimentally obtained value and the experimental vesicle shows similar neck curvatures (Fig. 4 B, compare the overlaid simulated and experimental vesicle, with dashed lines). Accordingly, experimental vesicles with approximately spherical-cap-shaped domains result from line tension and a volume constraint leading to an inner excess pressure. This inner excess pressure is probably balanced by an osmotic pressure difference between inside and outside of the vesicle (5). The mechanical analysis of the vesicle geometries shown in Fig. 2, D and G, also lead to the conclusion of an inner excess pressure (data not shown).
Fig. 4 C shows the tangent angles near the right phase boundary of the simulated vesicles shown in Fig. 4 B and of the experimental vesicle (Fig. 2 A). It is found that the simulated vesicle with boundary radius equal to the experimental vesicle (third trace in the direction of the arrows in Fig. 4 C) does not fit well to the experimental data. Moreover, whereas the experimental vesicle shows the phase boundary at an angle of ψb ≈ 1.96 rad, the simulated vesicles have tangent angles at the phase boundary near ψb = π/2 rad. In the following, we will examine the effect of varying the curvature moduli, i.e., the effect of ɛ and  for vesicles with fixed volume and boundary radius (both equal to the experimentally obtained values).
Vesicles with line tension and constrained volume and boundary radius: the effect of varying curvature moduli
The simulated vesicle shapes shown in Fig. 5 all have an area fraction, volume, and boundary radius equal to the experimentally obtained vesicle shape (Fig. 2 A). Defining vesicle volume and boundary radius as boundary conditions allows the determination of line tension and pressure difference as eigenvalues of the boundary value problem. Fig. 5 A shows tangent angles near the right phase boundary for ratios of mean curvature moduli ranging from ɛ = 0.01 to ɛ = 100 (in the direction of the arrows), under the assumption of equal Gauss moduli in both phases, i.e.,  The experimental tangent angles are plotted for comparison. It is readily inferred that ɛ ≠ 1 cannot account for the high experimental tangent angle (ψb ≈ 1.96 rad) at the phase boundary. The comparison of vesicle shapes with decreasing values of ɛ (Fig. 5 B, from left to right) reveals that whereas the membrane domain with smaller mean curvature bending modulus has the shape of a spherical cap, the membrane domain with high mean curvature bending modulus has a characteristic droplet shape (compare, e.g., the rightmost and leftmost shapes in Fig. 5 B). The second simulated vesicle in Fig. 5 B has a value of ɛ = 10, i.e., κLo is assumed to be 10 times greater than κLd. Although the effect of ɛ on the vesicle geometry on that order of magnitude is subtle, the comparison to the experimental vesicle (shown in Fig. 5 B with dashed lines) indicates that the Lo phase of the experimental vesicle has a higher mean curvature bending modulus than the Ld phase. This difference in bending rigidity (ɛ ≠ 1) underlies the more pronounced deviation of the Lo phase from a spherical cap, compared to the Ld phase (see Fig. 3 A) near the phase boundary.
FIGURE 5.

Vesicle shapes and tangent angles near right phase boundary, in vesicles with varying ɛ and  (A and B), or alternatively varying
  and ɛ = 1 (C and D). (Gray, Lo phase; black, Ld phase.) In all vesicles, area fraction, volume, and boundary radius were fixed to the experimental values. (A) Tangent angles near right phase boundary, ɛ increases in the direction of the arrows; ɛ = 0.01, 1, 100. The figure additionally shows the experimental trace. (B) The value ɛ decreases from left to right; ɛ = 100, 10, 0.1, 0.01, the experimental vesicle is shown for comparison with dashed lines. (C) Tangent angles near right phase boundary, which shifts toward lower angles with increasing
  (D) Vesicle shapes with varying
  from left to right:
  experimental vesicle,
  For all three shapes circles were added to compare the vesicle geometry to spherical caps.
To demonstrate the influence of  on the neck geometry, vesicles with ɛ = 1 but varying difference in Gaussian bending moduli are shown in Fig. 5, C and D. Fig. 5 C reveals that varying
  between −4 and 4, shifts the boundary angle from ψb = 0.90 rad to ψb = 2.14 rad. The comparison with the experimental value ψb (right) ≈ 1.96 rad indicates that the experimental value of
  is positive, i.e., the Lo phase has a smaller value of κG (but higher magnitude, because the κG values of mechanically stable bilayer membranes are negative; see Ref. 49) than the Ld phase. The left and right vesicle shapes in Fig. 5 D are simulated shapes referring to
  and
and  respectively, the middle shape is the experimental trace, for comparison.
The term  shifts the phase boundary out of the neck region (25), such that the membrane phase with the higher value (but smaller magnitude) of κG primarily forms the neck. The simulated shapes in Fig. 5 D clearly indicate that the effect of
  is confined to the neck region, where Gauss curvature is high. Both the Lo and Ld phase domains in vesicles with
  and
and  and ɛ = 1 are close to spherical caps (circles are added in Fig. 5 D for comparison) far from and near the neck. The Ld phase geometry of the simulated vesicle with
  (right vesicle in Fig. 5 D, black domain) is similar to the Ld phase geometry of the experimental vesicle (Fig. 5 D middle). However, as previously mentioned, the comparison of the Lo phase geometry of the experimental vesicle to a spherical cap, and additionally to the Lo phase geometry of the simulated vesicle with
  reveals a significant deviation. The experimental Lo phase domain shows a characteristic droplet shape, which according to the results shown in Fig. 5 B, indicates ɛ > 1, i.e., κLo > κLd.
To obtain estimates of the parameters ɛ and  for the experimental vesicle shape shown in Fig. 2 A, the vesicle volume, phase boundary radius, and phase boundary angle were defined as boundary values (for the numerical solution of the shape equations) given by the experimentally obtained data, which determines the excess pressure
  line tension
  and difference in Gauss moduli
  as eigenvalues in a boundary value problem with ɛ as a single adjustable parameter. Fig. 6, A and B, shows vesicle shapes simulated with those conditions, and mean curvature moduli ratio ranging from ɛ = 0.05 to ɛ = 5 (in the direction of the arrows in Fig. 6 A and from right to left in Fig. 6 B). The experimental values are shown both in Fig. 6 A, and with dashed lines in Fig. 6 B, for comparison. Both plots indicate that agreement between simulated vesicle shapes and experimental vesicle necessitates ɛ > 1 and
FIGURE 6.

Vesicle shapes and tangent angles near right phase boundary, in vesicles with varying ɛ and  (Gray, Lo phase; black, Ld phase.) In all vesicles, area fraction, volume, boundary radius, and boundary angle were fixed to the experimental values. (A) Tangent angles near right phase boundary, in the direction of the arrows: ɛ = 0.2,
  ɛ = 1,
  ɛ = 5,
  ɛ = 20, and
  (B) vesicles with same parameters as in A, with increasing ɛ (and increasing
  ) from left to right, the experimental vesicle is shown for comparison with dashed lines. (C) Comparison of tangent angles near right phase boundary for a vesicle with ɛ = 6.1 (i.e., the best fit value) and the experimental vesicle. (D) Comparison of vesicle geometry near right phase boundary for a vesicle with ɛ = 6.1 and the experimental vesicle (dashed lines and shifted toward the left).
The most probable estimates of ɛ consistent with the experimental data were obtained from least-squares fitting of the model described above to the experimentally obtained coordinates, using ɛ as a single adjustable parameter in the parameterization with respect to arc length and tangent angles. The least-square sum was calculated for the left and right halves of the vesicle separately, and was restricted to an interval of ±250 data points from the position of the phase boundary, i.e., ∼48% of the vesicle arc length measured from north to south pole. According to Figs. 3 B and 6 A, this procedure captures the vesicle geometry in the low curvature spherical cap-shaped regions far from the neck in addition to the high curvature neck region, but avoids decreasing the fit quality by thermally excited membrane undulations (i.e., deviations from constant curvature) in the spherical caps. The statistic χ2 was calculated from the least-square sum and an estimated uniform uncertainty in the experimentally determined tangent angles ψ, of ±0.1 rad. The uncertainty in the fit parameter ɛ was obtained from the curvature of the function χ2 = χ2(ɛ) near the minimum (50). The right-hand side of the vesicle yielded ɛ = 6.10 ± 1.339, whereas fitting the left part of the vesicle resulted in ɛ = 3.89 ± 0.916, indicating that the uncertainty in ɛ caused by thermal fluctuations of the membrane geometry is higher than the uncertainty estimated from the fit quality. The averaged values and standard deviations of fit parameters on left and right part of the vesicle are  and
and  Lateral tensions in the liquid-ordered and -disordered part of the vesicle are
  and
and 
Fig. 6 C shows a closeup of tangent angle values at the phase boundary, indicating the jump in meridional curvature, for a simulated vesicle under the same conditions as those used in Fig. 6, A and B, and ɛ = 6.1, i.e., the best fit value for the right half of the vesicle. This meridional curvature discontinuity, which is caused by the differential material properties quantified by ɛ and  is clearly seen as a jump in slope at the phase boundary in both experimental and simulated vesicles.
A comparison between the vesicle coordinates of a simulated vesicle with best fit parameters (same as in Fig. 6 C) and experimental vesicle (dashed lines and shifted toward the left) is shown in Fig. 6 D, which further illustrates the satisfactory agreement between theory and experiment.
Fig. 7, A and B, display simulated vesicle shapes with area fraction, phase boundary radius, and reduced volume equal to the experimental shapes of Fig. 2, D and G. Furthermore, the geometries shown in Fig. 7 were obtained with the average values for ɛ and  that were found from the analysis of the vesicle shown in Fig. 2 A. The insets of Fig. 7 depict neck geometries obtained with values for ɛ and
  equal to those found from fitting the shape of the vesicle in Fig. 2 A (solid lines), and for comparison neck geometries obtained for ɛ = 1 and
  (dashed lines). Fig. 7 A (inset) indicates high neck curvature in the Ld phase. The inset of Fig. 7 A furthermore shows the Lo phase to bend strongly toward the Ld phase in case of equal bending moduli in both phases, whereas small neck curvature in the Lo phase is found in the case of bending moduli obtained from the fitting vesicle in Fig. 2 A. We showed above that the vesicle neck geometry is primarily influenced by differing Gauss moduli, i.e., the parameter
  Accordingly, vesicles with geometries similar to Fig. 7 A are in better agreement with the experimental vesicle of Fig. 2 D (here the Lo phase hardly bends toward the Ld phase in the neck region, see Fig. 2 F), if a difference in Gaussian bending moduli is assumed. This result qualitatively supports our finding of non-zero
  values in vesicles with fluid phase coexistence. The neck geometries shown in the inset of Fig. 7 B hardly show a detectable difference, indicating that vesicles with geometry similar to Fig. 2 G cannot be employed to demonstrate a difference in material properties of Lo and Ld phases.
We found vesicles with sufficiently resolvable neck geometry particularly difficult to experimentally obtain. This is explained by the fact that shapes have to be imaged that are sufficiently different from limit shapes for high line tension (see rightmost vesicle in Figs. 4 B and 7 B), i.e., line tensions of experimental vesicles should not be too high, to allow for a quantitative mechanical analysis. On the other hand, vesicles with low line tension show increased thermal out-of-plane fluctuations, which limits the applicability of a zero-temperature vesicle shape theory (5). Our quantitative mechanical analysis is limited by the fact that only one vesicle of a composition SM/DOPC/chol = 0.615:0.135:0.25 was analyzed in detail. Further research is therefore necessary, to examine the extent to which our results can be generalized. In particular, the influence of vesicle compositions on mechanical vesicle parameters needs to be examined. To that end, our algorithm for numerically solving the shape equations has to be significantly improved to reduce the amount of time necessary to fit a single experimental vesicle shape.
DISCUSSION OF THE MECHANICAL PARAMETERS FOR A VESICLE WITH LO/LD PHASE COEXISTENCE
The model that was used above to examine the mechanical properties of a phase-separated vesicle yields six parameters ( and
and  ), raising the question of an ambiguity of the results. It was demonstrated above that line tension, the difference in bending moduli, and the difference in Gauss moduli each affect vesicle shapes in characteristically different ways. Additionally, the axially symmetric, quasispherical shape of the bulk domains causes the lateral tensions of each domain to be determined by the simple Laplace equation (see below). Furthermore, the measurement of the vesicle volume, the boundary radius, the boundary angle, and the area fraction of the coexisting phases allowed the determination of five parameters as boundary values. The bending modulus ratio ɛ was chosen as the only fitting parameter in comparing the local membrane geometry of the experimental vesicle to the simulated shape. The approach for determining five parameters from five independent measurements allowed the fitting of the model described above to the experimental vesicle with sufficient statistical significance.
In the following, these estimates will be discussed based on published experimental results in optically homogenous lipid membranes and theoretical predictions.
Bending moduli: the ratio ɛ
Bending moduli κ of lipid bilayer membranes have been determined by several different experimental methods, among which the vesicle flicker spectroscopy (24,51,52) and micropipette aspiration (53) have been employed most frequently. Furthermore, theoretical estimates of κ have been obtained from microscopic models (54,55) and computer simulations (56–58).
However, absolute values of bending moduli cannot be determined from studying static equilibrium shapes of vesicles with homogenous membranes, because vesicle shapes of homogenous membranes (without spontaneous curvature) are determined by the reduced volume only (37). (Note that the effect of a blocked lipid exchange between monolayer leaflets leads to further shape parameters, which is neglected in this work due to the presence of cholesterol, which rapidly flip-flops between leaflets.) This is because the bending energies are much smaller compared to energies necessary to change the total membrane area, and the vesicle volume (59). For the same reason, absolute values of bending moduli for the Ld and Lo phases cannot be obtained from an equilibrium shape analysis of phase-separated vesicles. However, the experimental shape of vesicles with phase coexistence permits the determination of the ratio of bending moduli ɛ, as shown above (see also Refs. 25 and 34). A value  is obtained from the shape analysis of the vesicle shown in Fig. 2 A, indicating a significantly higher bending rigidity of the Lo phase compared to that of the Ld phase.
This finding is in accord with experimental measurements of bending moduli in homogenous membranes, with microscopic models, and with known properties of the Lo versus Ld phase membranes, as will be discussed in the following.
Tie-line estimations in the Lo/Ld demixing region of phase diagrams of ternary lipid mixtures composed of cholesterol and a phospholipid with saturated (like SM or DPPC) and unsaturated (like POPC or DOPC) chains, indicate that the Lo phase contains more cholesterol than a coexisting Ld phase (33,60). Cholesterol incorporation into fluid membranes is known to increase membrane bending moduli (52,53), compared to fluid membranes without cholesterol, up to a factor of ∼5 (61).
Microscopic models (55,62) show the bending modulus to scale as
 |
(11) |
where KA is the area compressibility modulus, l is the thickness of the membrane, and u is the average cross-sectional area of a lipid molecule. The exponents τ, υ ≥ 1. The value KA has been shown to increase with cholesterol content (63), consistent with ɛ > 1. Comparative studies of one-component membranes from lipids with increasing chain length but identical headgroups revealed KA to be roughly constant (64) and a quadratic dependence on chain length (and therefore membrane thickness), i.e., τ = 2 (64,65). Cholesterol incorporation has been shown to lead to a thickness increase of lipid membranes and a decrease in the average cross-sectional area per molecule, u, in single phase membranes (66–68). Atomic force microscopy measurements have indicated the Lo phase thickness, l, to be higher compared to a coexisting Ld phase, in ternary lipid mixtures of DOPC, egg SM, and cholesterol (69). The increased Lo phase thickness is partially due to the enrichment of saturated chain lipids in this phase (33). Eq. 11 reveals that all these findings lead to a higher bending modulus of the Lo versus Ld phases, consistent with ɛ > 1.
Saddle-splay moduli: the difference Δ̂g
Saddle-splay (Gauss) moduli κG are significantly more difficult to measure than the moduli κ, because the Gaussian bending energy is a topological invariant due to the Gauss-Bonnet theorem and, consequently, cannot be experimentally determined in homogenous bilayer membranes. However, it was shown above that phase-separated giant vesicles can be used to experimentally determine the normalized difference,  of saddle-splay moduli in the Lo and Ld phases. A value of
  was obtained from the analysis of the vesicle shown in Fig. 2 A, i.e., a smaller (i.e., more negative) value of κG in the Lo phase versus the Ld phase.
It can be shown (35,70) that bilayer saddle-splay moduli κG are related to the monolayer values  by
by
 |
(12) |
where  is the spontaneous curvature of the lipid monolayer, and δ is the distance of the monolayer neutral surface (surface of inextension) to the bilayer midplane. The monolayer neutral surface is usually assumed to be near the hydrophilic/hydrophobic interface of the lipid monolayer. Theoretical considerations limit the range of
  (71). Most theoretical models show the ratio
  to be a constant with respect to varied microscopic parameters (see Refs. 55 and 72 and references therein), i.e., bending rigidity and saddle splay modulus are affected in exactly the same way with varying membrane parameters. Due to the sign difference (
 ), and κ = 2κm (49), and ɛ > 1 (see above), it is therefore expected that the Lo phase monolayers have more negative values of
  compared to the Ld phase monolayers. Assuming the first term in Eq. 12 to dominate the difference in bilayer Gaussian bending moduli, and furthermore assuming
  leads to
  consistent with the value determined experimentally. However, the spontaneous curvature
  and therefore the second term in Eq. 12 depend on parameters such as the membrane composition, the molecular geometry of the constituting membrane lipids, and the temperature. It could therefore be the case that
  of the Lo and Ld phases is not always positive. Further systematic shape studies of vesicles with fluid phase coexistence that span the whole composition range of fluid phase coexistence are therefore necessary.
Experimentally obtained values of κLd for the Ld phase membranes are of the order 10−19 J (24,51–53). Using this value, the absolute difference in Gauss moduli is estimated to be 
Estimation of line tension, pressure, and lateral tensions
The dimensionless vesicle shape parameters  can be used to obtain a rough estimate of the magnitudes of line tension σ, pressure difference p, and lateral tensions d in the experimental vesicle, using the radius of the undeformed sphere R0 and an estimate of the bending modulus of the Ld phase (see Eq. 7).
The typical value of κLd ≈ 10−19 J used with the radius of the (undeformed) experimental vesicle, R0 ≈ 9.8 μm and  yields an experimental line tension σ ≈ 6.7 × 10⁻¹³ N.
Generally, the thermodynamic description of line tension at the boundary of coexisting fluid phases in lipid bilayer membranes has been based on two contributions. These are a chemical line-tension arising from the compositional inhomogeneity over the phase boundary (73), and a mechanical line-tension resulting from the thickness difference between coexisting domains leading to membrane compression and tilt to avoid an energetically unfavorable hydrophobic mismatch (74). The latter model yields line tensions in the range of the experimental value determined in this work.
Line tension at phase boundaries of coexisting fluid domains in two-dimensional lipid systems have been measured in lipid monolayers at the air/water interface (75). The experimental values varied from 1.6 × 10⁻¹² N to 0 at the critical point of the phase diagram where the difference in properties of coexisting phases becomes negligible, and accordingly the line tension vanishes. A recent line tension estimate in giant vesicles with fluid phase coexistence (5) yielded σ ≈ 9.0 × 10⁻¹³ N, i.e., a value of the same order of magnitude as determined above. Line tension estimates in other systems are typically of order 10−12 N (73). Line tensions depend on the relative properties of coexisting phases, i.e., on domain composition and temperature. To systematically relate experimentally obtained line tensions to vesicle composition and temperature, the determination of tie-line directions in ternary lipid phase diagrams with fluid phase coexistence is necessary.
The normal pressure difference across the membrane of the experimental vesicle amounts to p ≈ −2.8 × 10⁻² N/m2. Lateral mean tensions in the membrane were d(Ld) ≈ −1.03 × 10⁻⁴ mN/m and d(Lo) ≈ −0.91 × 10⁻⁴ mN/m. The mechanical pressure difference, p, should be balanced by an osmotic pressure Π,
 |
(13) |
where cs is the solute (sucrose in the present case) concentration difference between inside and outside of the vesicle, R is the molar gas constant, and T is temperature. Eq. 13 yields a concentration difference on the order of cs ≈ 10−5 mmolar, i.e., an extremely tiny value. The spherical caps of the experimental vesicle with approximately constant curvature (see Fig. 2 A) yield radii of curvature in the disordered-liquid phase RLd ≈ 7.4 μm and in the liquid-ordered phase RLo ≈ 6.5. From the Laplace equation (p = 2d/Ri, where Ri is the constant radius of curvature of a spherical membrane), these curvature radii and the lateral tensions determined above, a pressure difference is obtained—which is in agreement with the value determined from the vesicle fit.
CONCLUSION
Cellular membrane transport processes are hypothesized to involve coexisting fluid lipid membrane phases; i.e., tubulation, budding, and fission take place in the presence of membrane regions with differing curvature moduli and line tension at the boundary of domains with differing compositions. A proper mechanical interpretation of these phenomena necessitates the determination of the curvature resistance of coexisting domains and the magnitudes of line tensions at phase boundaries.
The approach of this research was to analyze the geometry of individual vesicles with fluid phase coexistence that showed a geometry amenable to quantitative analysis, i.e., an optically resolvable neck curvature, the disordered phase bending strongly toward the ordered phase with a clearly resolvable tangent angle at the phase boundary, a spherical cap of the disordered fluid phase, and a somewhat droplet-shaped ordered phase cap (5). Clearly, a more complete mechanical analysis has to account for the lipid composition of the coexisting changes, which varies with average lipid composition and temperature (5,31). Such an analysis relies on the determination of tie-line directions in ternary lipid phase diagrams; this field of research is currently still at an early stage (33). However, the approach described above provides a starting point for a refined mechanical analysis of membranes with fluid coexisting phases.
In this contribution, an elastic model for phase-separated vesicles with line tension at the phase boundary and different bending moduli κ and Gauss moduli κG was used to extract experimental estimates for the ratio of bending moduli, and difference in Gauss moduli, from the detailed neck geometry of a vesicle with coexisting liquid-ordered and liquid-disordered phases.
The expression of boundary conditions based on the balance of forces and moments over the boundary allowed a straightforward interpretation of the physical meaning of the jump conditions. The jump in lateral tensions is equal to line tension multiplied by the geodesic curvature of the boundary, whereas the jump in transverse shear is equal to line tension multiplied by the principal curvature along the phase boundary.
The contributions from line tension, differing bending moduli, and differences in Gauss moduli were shown to each affect vesicle shapes in distinct ways, allowing estimations of their magnitudes from a comparison of theory and experiment. It was found that line tension leads to a vesicle shape significantly different from membranes without a phase boundary and that a normal pressure difference across the vesicle membrane in the case of high neck curvature with large neck radii is mandatory to maintain mechanical equilibrium. The mean curvature bending modulus of the Lo phase was found to be considerably higher than that of the Ld phase.
The significant influence of the difference of Gaussian bending moduli on biologically relevant membrane shape transitions such as budding of phase-separated vesicles (25,34) and fission of tubes with coexisting phases (36) has been theoretically demonstrated by several groups. To the best of our knowledge, this research provides the first experimental evidence for the existence of a difference in Gaussian bending moduli in coexisting liquid-ordered and liquid-disordered bilayer lipid membrane phases. This is a starting point for an in-depth analysis that will relate the compositions of coexisting fluid phases to mechanical membrane properties and examine the dynamics of line tension driven budding and fission.
APPENDIX A: EQUIVALENCE OF JUMPS IN FORCES AND MOMENTS TO THE VARIATIONAL APPROACH
This section shows that the three jump conditions, Eqs. 5 and 6 and the moments jump condition  are equivalent to Eqs. A18, A21, and A22 in Juelicher and Lipowsky (25), when spontaneous curvature is neglected. Their Eq. A18 (with neglecting spontaneous curvature, and in our notation, i.e., d = −Σi) can be written as
 |
(14) |
Solving for γ and inserting Eq. 14 into their relation for σ (their Eq. A21), it follows that
 |
(15) |
where Δ indicates a difference between phases. With h = −1/2(ψ′ + sin ψ/r) it follows that
 |
(16) |
With  the in-plane jump condition Eq. 5 is obtained. Similarly, Juelicher and Lipowsky's equation (their Eq. A13) can be solved for γ and insertion into their relation for σ (their Eq. A21) yields
 |
(17) |
which with Qs = 2κh′ is equivalent to the jump in transverse shear Eq. 6. The jump in moments together with the constitutive relation  yields Juelicher and Lipowsky's Eq. A22. Hence, the expression of jumps in forces and moments is in accordance with the variational approach put forward by Juelicher and Lipowsky (25).
APPENDIX B: NUMERICAL SOLUTION OF THE SHAPE EQUATIONS
The six quantities  h, ψ, r, z, and
  are chosen as dependent variables, where z is the vesicle height (see Fig. 1) and the arc length s is the independent variable. For each phase of a membrane with domains, a set of six coupled first-order differential equations for each membrane region is obtained. Two of these are derived from Eqs. 3 and 4, and read for the (−) region (i.e., the region before the phase jump, viewed from the north pole of the vesicle)
 |
(18) |
and
 |
(19) |
The four remaining equations are ψ′ = −2h − sin ψ/r, r′ = cos ψ, z′ = sin ψ, and  The six equations for the (+) region are identical, except that the parameter ɛ in Eqs. 18 and 19 does not appear (due to scaling with respect to κ+). The 12 boundary conditions at north pole (s = 0), phase discontinuity (s = s*), and south pole (s = se) are: Qs(0) = Qs(se) = 0, ψ(0) = 0, ψ(se) = π, r(0) = 0, and z(0) = 0; and the continuity equations are ψ(s*−) = ψ(s*+), r(s*−) = r(s*+), and z(s*−) = z(s*+); and, finally, the three jump conditions obtained from Eqs. 5, 6, and
  are
are
 |
(20) |
 |
(21) |
and
 |
(22) |
A calculation shows that r(se) = 0 is automatically satisfied. The choice of a continuous tangent angle over the phase boundary is based on experimental evidence in vesicles with fluid phase coexistence (see Ref. 5). To account for the constraints on total membrane area and area fraction of the coexisting phases of a phase-separated lipid vesicle at constant temperature, we introduce a generalized variable S (25,42), such that s(S = 0) = 0, s(S*) = s*, s(Se) = se, and  Derivatives with respect to s are thus expressed in terms of derivatives with respect to S, e.g.,
  For the choice of
  and Se = π, S becomes the arc length along the meridian of a unit sphere with local radius R(S) (42). The area of an axially symmetric vesicle element including the north pole yields
 |
(23) |
Accordingly, this parameterization yields the total membrane area of a unit sphere, and preserves the area fraction of coexisting membrane phases, under change of membrane parameters. The differential shape equations of the (−) and (+) regions are solved by mapping S− in [0 S*] and S+ in [S* π] onto the common interval [0 π], by introducing a modified scaling of S. The arc length of the deformed vesicle is obtained by simultaneously integrating  with the boundary condition s(S = 0) = 0. The singularities at the poles are approximated by expansions near the poles. The pressure difference,
  is either prescribed, or in case of a fixed volume Vf, can be obtained as an eigenvalue, with introduction of the additional differential equation
  with boundary conditions V(S = 0) = 0 and V(S = π) = Vf. The line tension,
  is either prescribed or in case of a fixed boundary radius, rb, obtained from the boundary condition r(S*) = rb. The normalized difference in Gaussian bending resistances,
  is either prescribed or in case of a fixed tangent angle at the boundary, ψb, obtained from the boundary condition ψ(S*) = ψb.
References
- 1.Dietrich, C., L. A. Bagatolli, Z. N. Volovyk, N. L. Thompson, M. Levi, K. Jacobson, and E. Gratton. 2001. Lipid rafts reconstituted in model membranes. Biophys. J. 80:1417–1428. [DOI] [PMC free article] [PubMed] [Google Scholar]
- 2.Samsonov, A. V., I. Mihalyov, and F. S. Cohen. 2001. Characterization of cholesterol-sphingomyelin domains and their dynamics in bilayer membranes. Biophys. J. 81:1486–1500. [DOI] [PMC free article] [PubMed] [Google Scholar]
- 3.Veatch, S. L., and S. L. Keller. 2002. Organization in lipid membranes containing cholesterol. Phys. Rev. Lett. 89:268101-1–268101-4. [DOI] [PubMed] [Google Scholar]
- 4.Kahya, N., D. Scherfeld, K. Bacia, B. Poolman, and P. Schwille. 2003. Probing lipid mobility of raft-exhibiting model membranes by fluorescence correlation spectroscopy. J. Biol. Chem. 278:28109–28115. [DOI] [PubMed] [Google Scholar]
- 5.Baumgart, T., S. T. Hess, and W. W. Webb. 2003. Imaging coexisting fluid domains in biomembrane models coupling curvature and line tension. Nature. 425:821–824. [DOI] [PubMed] [Google Scholar]
- 6.Staneva, G., M. I. Angelova, and K. Koumanov. 2004. Phospholipase A2 promotes raft budding and fission from giant liposomes. Chem. Phys. Lipids. 129:53–62. [DOI] [PubMed] [Google Scholar]
- 7.Simons, K., and E. Ikonen. 1997. Functional rafts in cell membranes. Nature. 387:569–572. [DOI] [PubMed] [Google Scholar]
- 8.Ikonen, E. 2001. Roles of lipid rafts in membrane transport. Curr. Opin. Cell Biol. 13:470–477. [DOI] [PubMed] [Google Scholar]
- 9.McConnell, H. M., and M. Vrljic. 2003. Liquid-liquid immiscibility in membranes. Annu. Rev. Biophys. Biomol. Struct. 32:469–492. [DOI] [PubMed] [Google Scholar]
- 10.Edidin, M. 2003. The state of lipid rafts: from model membranes to cells. Annu. Rev. Biophys. Biomol. Struct. 32:257–283. [DOI] [PubMed] [Google Scholar]
- 11.Munro, S. 2003. Lipid rafts: elusive or illusive? Cell. 115:377–388. [DOI] [PubMed] [Google Scholar]
- 12.Mukherjee, S., and F. R. Maxfield. 2000. Role of membrane organization and membrane domains in endocytic lipid trafficking. Traffic. 1:203–211. [DOI] [PubMed] [Google Scholar]
- 13.Bonifacino, J. S., and J. Lippincott-Schwartz. 2003. Coat proteins: shaping membrane transport. Nat. Rev. Mol. Cell Biol. 4:409–414. [DOI] [PubMed] [Google Scholar]
- 14.Lipowsky, R. 1992. Budding of membranes induced by intramembrane domains. J. Phys. II (Fr.). 2:1825–1840. [Google Scholar]
- 15.Subtil, A., I. Gaidarov, K. Kobylarz, M. A. Lampson, J. H. Keen, and T. E. McGraw. 1999. Acute cholesterol depletion inhibits clathrin-coated pit budding. Proc. Natl. Acad. Sci. USA. 96:6775–6780. [DOI] [PMC free article] [PubMed] [Google Scholar]
- 16.Wang, Y., C. Thiele, and W. B. Huttner. 2000. Cholesterol is required for the formation of regulated and constitutive secretory vesicles from the trans-Golgi network. Traffic. 1:952–962. [DOI] [PubMed] [Google Scholar]
- 17.Holthuis, J. C. M., G. van Meer, and K. Huitema. 2003. Lipid microdomains, lipid translocation and the organization of intracellular membrane transport. Mol. Membr. Biol. 20:231–241. [PubMed] [Google Scholar]
- 18.Huttner, W. B., and J. Zimmerberg. 2001. Implications of lipid microdomains for membrane curvature, budding and fission. Curr. Opin. Cell Biol. 13:478–484. [DOI] [PubMed] [Google Scholar]
- 19.Bonifacino, J. S., and B. S. Glick. 2004. The mechanisms of vesicle budding and fusion. Cell. 116:153–166. [DOI] [PubMed] [Google Scholar]
- 20.Nabi, I. R., and P. U. Le. 2003. Caveolae/raft-dependent endocytosis. J. Cell Biol. 161:673–677. [DOI] [PMC free article] [PubMed] [Google Scholar]
- 21.Parton, R. G., and A. A. Richards. 2003. Lipid rafts and caveolae as portals for endocytosis: new insights and common mechanisms. Traffic. 2003:724–738. [DOI] [PubMed] [Google Scholar]
- 22.Helfrich, W. 1973. Elastic properties of lipid bilayers: theory and possible experiments. Z. Naturforsch. 28c:693–703. [DOI] [PubMed] [Google Scholar]
- 23.Seifert, U. 1997. Configurations of fluid membranes and vesicles. Adv. Phys. 46:13–137. [Google Scholar]
- 24.Schneider, M. B., J. T. Jenkins, and W. W. Webb. 1984. Thermal fluctuations of large quasi-spherical bimolecular phospholipid vesicles. J. Phys. [E]. 45:1457–1472. [DOI] [PMC free article] [PubMed] [Google Scholar]
- 25.Juelicher, F., and R. Lipowsky. 1996. Shape transformations of vesicles with intramembrane domains. Phys. Rev. E. 53:2670–2683. [DOI] [PubMed] [Google Scholar]
- 26.Andelman, D., T. Kawakatsu, and K. Kawasaki. 1992. Equilibrium shape of two-component unilamellar membranes and vesicles. Europhys. Lett. 19:57–62. [Google Scholar]
- 27.Taniguchi, T. 1996. Shape deformations and phase separation dynamics of two-component vesicles. Phys. Rev. Lett. 76:4444–4447. [DOI] [PubMed] [Google Scholar]
- 28.Jiang, Y., T. Lookman, and A. Saxena. 2000. Phase separation and shape deformation of two-phase membranes. Phys. Rev. E. 61:R57–R60. [DOI] [PubMed] [Google Scholar]
- 29.Gozdz, W. T., and G. Gompper. 2002. Phase behaviour of two-component membranes. Colloids Surf. A Physicochem. Eng. Aspects. 208:241–251. [Google Scholar]
- 30.Allain, J.-M., and M. Ben Amar. 2004. Biphasic vesicle: instability induced by adsorption of proteins. Physica A (Amsterdam). 337:531–545. [Google Scholar]
- 31.Veatch, S. L., and S. L. Keller. 2003. Separation of liquid phases in giant vesicles of ternary mixtures of phospholipids and cholesterol. Biophys. J. 85:3074–3083. [DOI] [PMC free article] [PubMed] [Google Scholar]
- 32.Smith, A. K., J. T. Buboltz, C. H. Spink, and G. W. Feigenson. 2003. Ternary phase diagram of the lipid mixture sphingomyelin/DOPC/cholesterol. Biophys. J. 84:372A. [Google Scholar]
- 33.Veatch, S. L., I. V. Polozov, K. Gawrisch, and S. L. Keller. 2004. Liquid domains in vesicles investigated by NMR and fluorescence microscopy. Biophys. J. 86:2910–2922. [DOI] [PMC free article] [PubMed] [Google Scholar]
- 34.Juelicher, F., and R. Lipowsky. 1993. Domain-induced budding of vesicles. Phys. Rev. Lett. 70:2964–2967. [DOI] [PubMed] [Google Scholar]
- 35.Siegel, D. P., and M. M. Kozlov. 2004. The Gaussian curvature elastic modulus of N-monomethylated dioleoylphosphatidylethanolamine: relevance to membrane fusion and lipid phase behavior. Biophys. J. 87:366–374. [DOI] [PMC free article] [PubMed] [Google Scholar]
- 36.Allain, J.-M., C. Storm, A. Roux, M. Ben Amar, and J. F. Joanny. 2004. Fission of a multiphase membrane tube. Phys. Rev. Lett. 93:158104. [DOI] [PubMed] [Google Scholar]
- 37.Seifert, U., K. Berndl, and R. Lipowsky. 1991. Shape transformation of vesicles: phase diagram for spontaneous-curvature and bilayer-coupling models. Phys. Rev. A. 44:1182–1202. [DOI] [PubMed] [Google Scholar]
- 38.Jenkins, J. T. 1977. The equations of mechanical equilibrium of a model membrane. SIAM J. Appl. Math. 32:755–764. [Google Scholar]
- 39.Evans, E. A., and R. Skalak. 1980. Mechanics and Thermodynamics of Biomembranes. CRC Press, Boca Raton, FL.
- 40.Evans, E., and A. Yeung. 1994. Hidden dynamics in rapid changes of bilayer shape. Chem. Phys. Lipids. 73:39–56. [Google Scholar]
- 41.Powers, T. R., G. Huber, and R. E. Goldstein. 2002. Fluid-membrane tethers: minimal surfaces and elastic boundary layers. Phys. Rev. E. 65:041901–1–041901–11. [DOI] [PubMed]
- 42.Jenkins, J. T. 1976. Static equilibrium configurations of a model red blood cell. J. Math. Biol. 4:149–169. [DOI] [PubMed] [Google Scholar]
- 43.Do Carmo, M. P. 1976. Differential Geometry of Curves and Surfaces. Prentice Hall, Englewood Cliffs, NJ.
- 44.Mathivet, L., S. Cribier, and P. F. Devaux. 1996. Shape change and physical properties of giant phospholipid vesicles prepared in the presence of an AC electric field. Biophys. J. 70:1112–1121. [DOI] [PMC free article] [PubMed] [Google Scholar]
- 45.Korlach, J., P. Schwille, W. W. Webb, and G. W. Feigenson. 1999. Characterization of lipid bilayer phases by confocal microscopy and fluorescence correlation spectroscopy. Proc. Natl. Acad. Sci. USA. 96:8461–8466. [DOI] [PMC free article] [PubMed] [Google Scholar]
- 46.Bagatolli, L. A., and E. Gratton. 2000. Two photon fluorescence microscopy of coexisting lipid domains in giant unilamellar vesicles of binary phospholipid mixtures. Biophys. J. 78:290–305. [DOI] [PMC free article] [PubMed] [Google Scholar]
- 47.Feigenson, G. W., and J. T. Buboltz. 2001. Ternary phase diagram of dipalmitoyl-PC/dilauroyl-PC/cholesterol: nanoscopic domain formation driven by cholesterol. Biophys. J. 80:2775–2788. [DOI] [PMC free article] [PubMed] [Google Scholar]
- 48.Lipowsky, R., and R. Dimova. 2003. Domains in membranes and vesicles. J. Phys. Condens. Matter. 15:S31–S45. [Google Scholar]
- 49.Helfrich, W. 1981. Amphiphilic mesophases made of defects. In Physics of Defects. R. Balian, M. Kleman, and J.-P. Poirier. Les Houches Summer School, 1980, Amsterdam, The Netherlands.
- 50.Bevington, P. R., and D. K. Robinson. 1003. Data Reduction and Error Analysis for the Physical Sciences, 3rd Ed. McGraw-Hill, Boston, MA.
- 51.Faucon, J. F., M. D. Mitov, P. Meleard, I. Bivas, and P. Bothorel. 1989. Bending elasticity and thermal fluctuations of lipid membranes. Theoretical and experimental requirements. J. Phys. [E]. 50:2389–2414. [Google Scholar]
- 52.Duwe, H. P., and E. Sackmann. 1990. Bending elasticity and thermal excitations of lipid bilayer vesicles: modulation by solutes. Physica A (Amsterdam). 163:410–428. [Google Scholar]
- 53.Evans, E., and W. Rawicz. 1990. Entropy-driven tension and bending elasticity in condensed-fluid membranes. Phys. Rev. Lett. 64:2094–2097. [DOI] [PubMed] [Google Scholar]
- 54.Petrov, A. G., and I. Bivas. 1984. Elastic and flexoelectric aspects of out-of-plane fluctuations in biological and model membranes. Prog. Surf. Sci. 16:389–512. [Google Scholar]
- 55.Safran, S. A. 1999. Curvature elasticity of thin films. Adv. Phys. 48:395–448. [Google Scholar]
- 56.Goetz, R., G. Gompper, and R. Lipowsky. 1999. Mobility and elasticity of self-assembled membranes. Phys. Rev. Lett. 82:221. [Google Scholar]
- 57.Rekvig, L., B. Hafskjold, and B. Smit. 2004. Simulating the effect of surfactant structure on bending moduli of monolayers. J. Chem. Phys. 120:4897–4905. [DOI] [PubMed] [Google Scholar]
- 58.Farago, O., and P. Pincus. 2004. Statistical mechanics of bilayer membrane with fixed projected area. J. Chem. Phys. 120:2934–2950. [DOI] [PubMed] [Google Scholar]
- 59.Doebereiner, H. G., E. Evans, M. Kraus, U. Seifert, and M. Wortis. 1997. Mapping vesicle shapes into the phase diagram: a comparison of experiment and theory. Phys. Rev. E. 55:4458–4473. [Google Scholar]
- 60.Almeida, R. F. M., A. Fedorov, and M. Prieto. 2003. Sphingomyelin/phosphatidylcholine/cholesterol phase diagram: boundaries and composition of lipid rafts. Biophys. J. 85:2406–2416. [DOI] [PMC free article] [PubMed] [Google Scholar]
- 61.Meleard, P., C. Gerbeaud, T. Pott, L. Fernandez-Puente, I. Bivas, M. D. Mitov, J. Dufourcq, and P. Bothorel. 1997. Bending elasticities of model membranes: influences of temperature and sterol content. Biophys. J. 72:2616–2629. [DOI] [PMC free article] [PubMed] [Google Scholar]
- 62.Szleifer, I., D. Kramer, A. Ben-Shaul, W. M. Gebhardt, and S. A. Safran. 1990. Molecular theory of curvature elasticity in surfactant films. J. Chem. Phys. 92:6800–6817. [Google Scholar]
- 63.Needham, D., T. J. McIntosh, and E. Evans. 1988. Thermomechanical and transition properties of dimyristoylphosphatidylcholine/cholesterol bilayers. Biochemistry. 27:4668–4673. [DOI] [PubMed] [Google Scholar]
- 64.Rawicz, W., K. Olbrich, T. McIntosh, D. Needham, and E. A. Evans. 2000. Effect of chain length and unsaturation on elasticity of lipid bilayers. Biophys. J. 79:328–339. [DOI] [PMC free article] [PubMed] [Google Scholar]
- 65.Fernandez-Puente, L., I. Bivas, M. D. Mitov, and P. Meleard. 1994. Temperature and chain length effects on bending elasticity of phosphatidylcholine bilayers. Europhys. Lett. 28:181–186. [Google Scholar]
- 66.Smondyrev, A. M., and M. L. Berkowitz. 1999. Structure of dipalmitoylphosphatidylcholine/cholesterol bilayer at low and high cholesterol concentrations: molecular dynamics simulation. Biophys. J. 77:2075–2089. [DOI] [PMC free article] [PubMed] [Google Scholar]
- 67.Chiu, S. W., E. Jakobsson, R. J. Mashi, and H. L. Scott. 2002. Cholesterol-induced modifications in lipid bilayers: a simulation study. Biophys. J. 83:1842–1853. [DOI] [PMC free article] [PubMed] [Google Scholar]
- 68.Jedlovszky, P., N. N. Medvedev, and M. Mezei. 2004. Effect of cholesterol on the properties of phospholipid membranes. III. Local lateral structure. J. Phys. Chem. 108:465–472. [Google Scholar]
- 69.Rinia, H. A., M. M. E. Snel, J. P. J. M. van der Eerden, and B. de Kruijff. 2001. Visualizing detergent resistant domains in model membranes with atomic force microscopy. FEBS Lett. 501:92–96. [DOI] [PubMed] [Google Scholar]
- 70.Schwarz, U. S., and G. Gompper. 2001. Bending frustration of lipid-water mesophases based on cubic minimal surfaces. Langmuir. 17:2084–2096. [Google Scholar]
- 71.Templer, R. H., B. J. Khoo, and J. M. Seddon. 1998. Gaussian curvature modulus of an amphiphilic monolayer. Langmuir. 14:7427–7434. [Google Scholar]
- 72.Auth, T., and G. Gompper. 2003. Self-avoiding linear and star polymers anchored to membranes. Phys. Rev. E. art.#051801. [DOI] [PubMed]
- 73.Widom, B. 1998. Structure and tension of interfaces. Mol. Phys. 96:1019–1026. [Google Scholar]
- 74.Akimov, S. A., P. I. Kuzmin, J. Zimmerberg, F. S. Cohen, and Y. A. Chizmadzhev. 2004. An elastic theory for line tension at a boundary separating two lipid monolayer regions of different thickness. J. Electroanal. Chem. 564:13–18. [Google Scholar]
- 75.Benvegnu, D. J., and H. M. McConnell. 1992. Line tension between liquid domains in lipid monolayers. J. Phys. Chem. 96:6820–6824. [Google Scholar]