

Abstract
Calmodulin (CaM) interacts specifically as a dimer with some dimeric basic-Helix-Loop-Helix (bHLH) transcription factors via a novel high affinity binding mode. Here we report a study of the backbone dynamics by 15N-spin relaxation on the CaM dimer in complex with a dimeric peptide that mimics the CaM binding region of the bHLH transcription factor SEF2-1. The relaxation data were measured at multiple magnetic fields, and analyzed in a model-free manner using in-house written software designed to detect nanosecond internal motion. Besides picosecond motions, all residues also experience internal motion with an effective correlation time of ∼2.5 ns with squared order parameter (S2) of ∼0.75. Hydrodynamic calculations suggest that this can be attributed to motions of the N- and C-terminal domains of the CaM dimer in the complex. Moreover, residues with significant exchange broadening are found. They are clustered in the CaM:SEF2-1mp binding interface, the CaM:CaM dimer interface, and in the flexible helix connecting the CaM N- and C-terminal domains, and have similar exchange times (∼50 μs), suggesting a cooperative mechanism probably caused by protein:protein interactions. The dynamic features presented here support the conclusion that the conformationally heterogeneous bHLH mimicking peptide trapped inside the CaM dimer exchanges between different binding sites on both nanosecond and microsecond timescales. Nature has thus found a way to specifically recognize a relatively ill-fitting target. This novel mode of target-specific binding, which neither belongs to lock-and-key nor induced-fit binding, is characterized by dimerization and continuous exchange between multiple flexible binding alternatives.
INTRODUCTION
Calmodulin (CaM) is a Ca2+ binding protein, present in all eukaryotic cells. It has a 100% amino acid identity among all analyzed vertebrates, and plays a central role in translating intracellular Ca2+ signals into biological responses.
The crystal structures of Ca2+/CaM show an extended dumbbell shaped molecule, in which its two globular domains are connected with a long α-helix (1). In solution, this helix is disrupted in the middle (2), which allows N- and C-terminal domains of both apo-CaM and Ca2+/CaM to tumble almost independently of each other (3–5). Upon Ca2+ binding, a conformational change enables it to interact with over 100 different target proteins, including transcription factors (for reviews, see Van Eldik and Watterson and others (6,7)).
When Ca2+/CaM interact with its targets, the flexibly connected domains normally collapse into a more compact globule. This is called “wraparound” binding because the two domains in CaM wrap around the α-helical target (8,9). In context of the wraparound binding mode, Wand and co-workers have studied the backbone and side-chain dynamics of free CaM and CaM in complex with a peptide (10). Upon peptide binding, the flexibility of side chains located in the binding sites is redistributed. This is believed to assist the target-specific deformation of the binding sites in CaM that is necessary for productive binding. In contrast, the backbone within the domains is fairly rigid, both for target-free (3) and target-bound CaM (10). Tjandra and co-workers (3) have shown, via 15N-relaxation at multiple fields, that in free CaM the two domains undergo a slow “wobbling” motion on a timescale of ∼3 ns, apparently not evident in target-bound CaM.
Although the wraparound mode of target binding is the most studied, alternative binding modes have become evident. One of these, the interaction of CaM with basic-Helix-Loop-Helix (bHLH) transcription factors has a 2:2 stoichiometry (11). This new type of CaM interaction is the first example where two interacting CaM molecules interact with a dimeric target.
Helix-Loop-Helix (HLH) transcription factors regulate numerous developmental processes (12,13). Most HLH proteins belong to the bHLH group, which has a basic sequence directly N-terminal to the HLH motif. They are active as dimers, where the two basic regions bind DNA symmetrically as α-helices on opposite sides in the major groove. In the absence of DNA, the basic sequences loose their well-defined secondary structure (14).
Ca2+ signaling can inhibit the transcriptional activities in vivo of the bHLH proteins E12 and SEF2-1 through direct binding of Ca2+/CaM to the basic sequence of the proteins, resulting in inhibition of their DNA binding (15). Thus, CaM can, in a Ca2+-dependent manner, directly interact with some members of the bHLH family. The CaM binding site coincides with the basic DNA-binding sequence of the bHLH dimers (11,15,16,17). A homodimeric peptide corresponding to the complete SEF2-1 basic sequence, henceforth called SEF2-1mp, was chosen as a good model system for NMR studies of the interactions between bHLH proteins and Ca2+/CaM.
In an earlier NMR study we could conclude that the CaM:SEF2-1mp complex has a 2:2 stoichiometry, where two interacting CaM molecules bind one homodimeric SEF2-1mp (11). The previous NMR data were consistent with two schematic models of the CaM dimer. In both models the N-terminal domain of one CaM faces the C-terminal domain of the other CaM, creating a hydrophobic tunnel where SEF2-1mp is trapped. Fig. 1 shows one of these two possible models. In the same study we could also conclude that SEF2-1mp lacks any well-defined secondary structure when interacting with CaM, an observation very unusual for CaM-bound peptides. The peptide still interacts with the same exposed hydrophobic patches as in the wraparound binding mode, but here a number of weak interactions occur instead of one strong. Despite these features the overall interaction is highly specific with nanomolar binding strength (16). Possibly the dimeric nature of both the target and CaM overcomes the less specific hydrophobic interactions. Study of the dynamics of the complex can give insights into this novel type of CaM:target interaction.
FIGURE 1.

A schematic model of the CaM:SEF2-1mp complex based on intermolecular CaM:CaM contacts and the 2:2 stoichiometry (11). The CaM molecules (orange) create a dimer where the C-terminal domain of one CaM contacts the N-terminal of the other CaM, which creates a hydrophobic tunnel. Inside the tunnel the dimeric SEF2-1mp peptide (blue) is trapped, and is in constant exchange between different bound conformations. In addition, the CaM domains undergo a wobbling motion with a correlation time of ∼2.5 ns. This figure should, therefore, not be interpreted as a fixed localization of SEF2-1mp.
In this report we present the backbone dynamics of the CaM dimer bound to the dimeric SEF2-1mp. The CaM:SEF2-1mp complex is found to be highly flexible with internal motions on the picosecond, nanosecond, and microsecond timescales. The dynamics is similar to that found for the “wraparound” binding mode in some aspects, e.g., rigid domains, but also uniquely different in other aspects. The interaction neither belongs to the category of lock-and-key nor to that of induced-fit.
MATERIALS AND METHODS
Sample preparation
SEF2-1mp mimics the DNA- and CaM-binding region of the bHLH transcription factor SEF2-1. It is a homodimeric peptide formed via a disulfide bridge between two cysteine residues located at position 19 of the two 21-residue-long peptide strands. Azodicarboxylic acid (diamide) was used to oxidize the cysteines to form the disulfide bridge and was present in all NMR samples. That the peptide remained dimeric was also confirmed by SDS-PAGE. The preparation of the CaM:SEF2-1mp NMR samples has been described by us earlier (11).
NMR spectroscopy
If nothing else is mentioned, the NMR measurements were performed at 308 K. The experiments were carried out on Bruker DRX-400, AMX2-500, and DRX-600 spectrometers equipped with triple-resonance (1H/13C/15N or broadband) probes with XYZ-gradient capabilities. The spectra were processed with XWINNMR (Bruker Instruments, Billerica, MA). Proton chemical shifts were calibrated using the internal standard DSS (0.0 ppm at 308 K). 15N chemical shifts were indirectly referenced using the gyromagnetic ratio of 15N/1H (18).
Longitudinal (R1) and transverse (R2) 15N-spin relaxation rates were measured at 400 and 600 MHz 1H frequency (40.5 and 60.8 MHz 15N frequency) using standard pulse sequences (19). The 15N R1 and R2 experiments at each field were recorded in an interleaved manner with the relaxation delays randomly distributed. The experimental details of these experiments are compiled in Supplementary Materials (Table RS1). Before the start of each experiment the temperature was calibrated with a water/DSS sample.
The 15N-{1H} nuclear Overhauser enhancement (NOE) shows only weak field dependence and was therefore only carried out at the higher field. NOE values were determined from pairs of spectra recorded interleaved with and without a 4-s proton saturation (see Supplementary Materials, Table RS1, for more details).
To determine the presence of conformational exchange on microsecond and millisecond timescales, the relaxation-compensated CPMG experiment (20) was carried out at 308 K at 500 MHz and at 308 and 300 K at 600 MHz. The delay between the 180° pulses (δ) in the CPMG was set to either 450 μs or 3.6 ms. More experimental details are found in Supplementary Materials (Table RS1).
Data analysis
All spectra were analyzed using SYBYL software (TRIPOS). The relaxation data at 600 MHz were integrated over an elliptically shaped area with diameters 7.2 and 6.6 Hz in the 1H and 15N dimension, respectively. The 400-MHz data were analyzed with 1H and 15N diameters of 6.5 and 4.4 Hz. The use of small integration areas has the advantage that the noise is still averaged, while at the same time partially overlapping crosspeaks still can be reliably integrated (21).
R1 and R2 values were determined by fitting peak volumes to a two-parameter single exponential decay using MATLAB. The error in the R1 and R2 values was defined as the standard deviation between three curve fittings, one with all time points and two fittings with reduced data sets containing every second time point, which were shifted either zero or one time point in the relaxation series. 15N-{1H} NOE values were determined from the ratios of peak volumes recorded in presence and absence of proton saturation.
The R1, R2, and NOE data were analyzed using our new analysis method PINATA (22). This method uses the extended Lipari-Szabo approach (23) and fully anisotropic diffusion to derive motional parameters from relaxation data measured at two magnetic fields. The method is particularly useful to identify the presence of nanosecond-timescale internal motion for proteins for which many or all residues undergo such internal motions. It is insensitive to small variations in 15N chemical shift anisotropy (CSA) (from −150 to −200 ppm) (22). In the analysis of the CaM data we used an axially symmetric diffusion model to calculate the relaxation parameters. The N-HN bond length was set to 1.020 Å, and the 15N CSA value to −170 ppm.
Spectra from the relaxation-compensated CPMG experiments were integrated and analyzed in the same manner as the R1 and R2 experiments. Conformational exchange is present when the difference between the R2 rates measured with δ = 3.6 ms and δ = 450 μs is significantly above zero.
Hydrodynamic calculations to predict molecular tumbling times were carried out on different models of the CaM:SEF2-1mp complex. Both the analytical expressions for tumbling times of cylinder symmetric objects as well as bead model hydrodynamics incorporated in the DASHA software (24) were used (see Supplementary Materials for more details).
Theory
The equations for the relaxation of a backbone amide 15N spin in a protein as well as their interpretation in terms of the model-free approach of Lipari and Szabo (25) are well described in the literature (see, e.g., Clore et al. and others (23,26,27,28,29)). For the analysis of the relaxation data, the apparent overall tumbling time is an important parameter and we briefly describe the relevant equations.
The apparent overall correlation time at a certain magnetic field B,  is calculated from the ratio R2 over R1 at that field (22,29):
 |
(1) |
with a = −0.02. In absence of internal motion and exchange broadening, we define  as
as  (22). For isotropic tumbling,
  is equal to the true uniform overall correlation time
  For anisotropic tumbling,
  contains information on the orientation of the N-HN relaxation vector in the molecular frame, which can be used to determine the diffusion tensor (22,26,30,31). For small degrees of anisotropy and axial symmetry the orientation information in
  depends only on the angle, Φ, of the N-HN relaxation vector relative to the long axis of the diffusion tensor (22) according to:
 |
(2) |
Here the Δ is anisotropy and is given by  where
where  is the tumbling time of the long axis, and
  is the tumbling time of the short axis of the molecule.
In presence of internal motion,  depends on the magnetic field, timescale, and degree of internal motion (22,32). We have developed a method for analyzing 15N-spin relaxation measured at two magnetic fields that corrects
  for internal motion up to ∼4 ns, giving
  (22). In the absence of internal motions slower than ∼4 ns,
  can thus be considered equal to
  the real overall tumbling time. In the presence of even slower internal motions it becomes progressively difficult to distinguish overall tumbling and internal motion (22,32). Consequently,
  may contain contributions from these slow internal motions and must be considered as an effective overall tumbling time.
For studies of conformational exchange it is important to ascertain whether the exchange is in the fast or slow exchange limit. Usually, it is possible to distinguish between these limits by the number of resonances per exchanged spin, present in the NMR spectra. It is to be noted that observation of single resonances in NMR spectra does not necessarily mean that the exchange is fast. This problem has been considered and recipes on how to still estimate the timescale of an exchange process based on CPMG data can be found in the literature (26,33,34). Below we consider equations assuming fast exchange. In addition, using the simple general equation, which covers for both fast and slow exchange, derived by Ishima and Torchia (34), we also show that the exchange rate can be determined from a combination of CPMG measured Rex and change in Rex, (ΔRex, vide infra) without prior assumption on the exchange timescale.
For a nucleus exchanging between two states, A and B, with different chemical shifts, the apparent exchange broadening, Rex, measured using a CPMG sequence (26) is given by:
 |
(3) |
Here, pA and pB are the populations of the states A and B, Δex = ΩA − ΩB is the chemical shift difference between the two states, kex = kA→B / pB = kB→A / pA is the rate constant for the exchange process, δ is the delay of the δ-180°-δ CPMG block and ωI is the frequency of nucleus I. With the method of Loria et al. (20), R2 is measured for two settings of δ (we used 2δ1 = 450 μs and 2δ2 = 3.6 ms) and Rex is detected if the difference in R2 between the two δ settings, ΔRex, is significantly large.
 |
(4) |
As can be seen from Eq. 5, the ratio of ΔRex and Rex depends only on kex:
 |
(5) |
Thus, from the ratio ΔRex/Rex, the exchange rate kex can be derived and a correlation plot of Rex vs. ΔRex shows a linear dependence for a given kex. Given kex, the value of  can be derived from ΔRex and/or Rex. Finally, a lower estimate of Δex,
  can be obtained, because pApB has a maximum at pA = 0.5.
Ishima and Torchia (34) derived a simple function, which approximates Rex for fast exchange as well as slow exchange with a skewed population (pA ≫ pB):
 |
(6a) |
 |
(6b) |
where, ω1eff(δ1,2) = √3/δ1,2. The ratio of ΔRex/Rex is then given by:
 |
(6c) |
Given δ1,2 and a reasonable maximum of Δex (∼6 ppm), a correlation plot of Rex vs. ΔRex calculated using Eq. 6 shows essentially the same linear dependence for kex values as when Eqs. 3–5 are used. The kex derived from Rex vs. ΔRex via either set of equations is essentially the same in the fast exchange region. Most importantly, as for Eqs. 3–5, the slope increases with increasing  (see below; Fig. 7). Consequently, the kex values calculated in this way (Eqs. 6c and/or 5), establish whether fast exchange applies or not without prior knowledge of the exchange timescale. A further note of importance is that for the CPMG settings used, R2(δ1) is measured in the high ω1eff limit (ω1eff > pAΔexωI), so that Rex is proportional to
  independent of whether the exchange is fast or slow to a skewed population (33,34). In conclusion, residues with fast exchange can be identified from the combination of Rex and ΔRex using either the fast exchange equations or the general fast/slow exchange equations derived by Ishima and Torchia (34).
FIGURE 7.

Correlation diagram of Rex and ΔRex at 600 MHz. The exchange lifetime scatter around  ≈ 50 μs. The Rex and ΔRex show a linear dependence given the exchange time
  according to fast exchange limit (Eqs. 3 and 4) (solid lines) and according to the approximate function (Eq. 6) (within 15%), proposed by Ishima and Torchia (34), which applies over all timescales provided pA ≫ pB (dashed lines). In these calculations of theoretical Rex and ΔRex correlations, the CPMG delay, δ1 and δ2 were set to their experimental values, Δex ranges from 0 to 6 ppm to cover the relevant range, ωI to its corresponding value (ΔexωI is maximum 2100 s−1), pA is taken for convenience equal to 0.5 for the fast exchange limit calculations (solid lines) and equal to 0.9 for the general equation (dashed lines). Both equations show similar correlation lines given this range of parameter values.
ΔRex can also be measured at different temperatures (e.g., at T1 and T2), which can be used to derive estimates of the activation enthalpy, ΔH#, for the exchange process (vide infra). Based on the Boltzmann distribution, the relative populations in an exchanging system do not significantly change upon a small temperature change. Therefore, the difference in ΔRex, ΔΔRex, when the temperature is lowered becomes:
 |
(7) |
From ΔΔRex, the temperature-induced change in kex (f = kex,T2/kex,T1) can be derived, given kex and  (established from Rex and ΔRex at temperature T1). When kexδ1 > 3 (here when
  ), Eq. 7 simplifies, and f can be calculated from the ratio of ΔΔRex and ΔRex:
 |
(8) |
According to the transition-state theory in thermodynamics (35,36,37), the rate constant, kex, is given by:
 |
(9) |
Here, ΔG#, ΔH#, and ΔS# are the activation free -energy, -enthalpy, and -entropy, respectively; k is the Boltzmann factor, h is Planck's constant, and R the gas constant. The ratio f of the exchange rates at two different temperatures then becomes:
 |
(10) |
The ratio f is usually dominated by the exponential factor, so that the right-hand term in Eq. 10 is a good approximation. Hence, the ratio f can be used to estimate the energy barrier between the exchanging states.
RESULTS
CaM R1 and R2 relaxation rates were measured at 600 and 400 MHz 1H frequency and the 15N-{1H} NOE data at 600 MHz. The R1, R2 and 15N-{1H} NOE data are presented in Fig. 2 and in Supplementary Material (Table S1). In total, 116 residues were analyzed using the PINATA method (22), which is particularly suited for proteins that exhibit extensive nanosecond-timescale internal motions. The data are presented following the flow diagram of the PINATA script.
FIGURE 2.

15N relaxation parameters, T1 = 1/R1 (a), T2 = 1/R2 (b), and 15N-{1H} NOE (c) measured at one or two magnetic fields. The black and gray lines correspond to relaxation parameters measured at 600 and 400 MHz 1H frequency, respectively. The 15N-{1H} NOE experiment was only measured at 600 MHz.
Identification of nanosecond-timescale internal motion
The presence of nanosecond-timescale motion can be directly identified from a plot of the normalized ratio of R1 values measured at two magnetic fields ( ) versus NOE (22). Fig. 3 shows the theoretical
  curves for a molecule with a correlation time,
  of 10 ns with one internal motion, τif, ranging between 20 ps and 6 ns, and squared order parameter,
  ranging between 0.4 and 1.0 (dashed τif contours and solid
  contours). The same figure also shows the
  contours when an additional nanosecond-timescale internal motion is present with time constant τis = 2 ns and order parameter
  = 0.8 (dotted red contours). The interpretation of the
  versus NOE plots is straightforward. The
  value is always 1 in the absence of internal motion or when the internal motion is faster than ∼200 ps.
  only decreases below 1 when the internal motion is slower than 200 ps or when an additional internal motion with a timescale slower than 200 ps is present. Thus, the presence of nanosecond-timescale internal motion is directly evident from the observation that
  is smaller than a critical value determined by the experimental error in the R1 measurements. Note that potential variation of the 15N CSA between −150 and −200 ppm hardly affects
  (±3%), and thus does not affect the conclusions (22).
FIGURE 3.

The normalized ratio,  (
( ) plotted versus the 15N-{1H} NOE for the experimental CaM relaxation data. The normalization constant
  is RT1 in the absence of any internal motion.
  was calculated with a 15N CSA of −170 ppm and a
  of 10 ns, the average overall tumbling time for the CaM dimer (vide infra). RT1 was also corrected for the linear NOE dependence for fast (<200 ps) internal motion. The
  contours of the theoretical
  are shown for a one-contribution model (solid black
  contours), and a two-contribution model (dotted red
  contours). In both theoretical models, τif is running from 20 ps to 6 ns. In the two-contribution model, an additional 2.5 ns internal motion is present with
  = 0.8. Guidelines for internal motions of 1.0 and 2.5 ns for the one-contribution model is outlined with dashed black lines. The experimental CaM data are overlaid on top of theoretical
  curves, and are normalized with the same
  as the theoretical curves. The average error in the
  and
and  is 1.0 and 2.5%, respectively. Hence, the error in the experimental
  equals 3.5%. The shaded area represents the area where residues are only affected by picosecond-timescale internal motion, i.e., motions < 200 ps.
  curves are not affected by exchange contributions, have relatively small error margins, and are only weakly affected by variation in the CSA and overall rotation time. Thus, average approximate values for these parameters can be used without adversely affecting the correctness of the drawn conclusions.
The  values for the CaM:SEF2-1mp complex are superimposed onto the S2 contours in Fig. 3. As can be seen, the
  values spread around
  showing that most residues are affected by the same contribution of nanosecond-timescale motion. This motion may or may not be superimposed onto varying degrees of picosecond-timescale motion. That a two-contribution model is needed follows from a comparison of average experimental and theoretical R1 values. The theoretical R1 values, calculated for a one-contribution model with S2 and τi values consistent with the
  of 0.87 and varying NOE values (Fig. 3) are always too high, meaning that a two-contribution model needs to be considered. For parameter values of τis = 2.5 ns,
  and
and  an R1 value of 1.42 s−1 is obtained, which is very close to the average experimental R1. Thus, in addition to the usual picosecond-timescale motions of varying contributions, a small amplitude nanosecond-timescale motion is present for all CaM residues in the CaM:SEF2-1mp complex.
Determination of the rotational correlation times
A reliable estimate of the overall rotation correlation times is very important for the further analysis of the relaxation data. In addition, it provides important structural information. The ratio of R2 over R1 (R2 corrected for Rex; vide infra) at a magnetic field B gives the apparent correlation time,  (Eq. 1). In the absence of internal motion or when there is only a small degree of fast (<200 ps) internal motion present,
  is equal or close to the true rotation correlation time
  However, in the presence of nanosecond internal motion,
  can be substantially smaller than
  (22,32). Thus, due to the presence of nanosecond-timescale internal motion, the experimental
  for CaM:SEF2-1mp are smaller than the true correlation time,
  As described elsewhere (22),
  can be corrected for the presence of internal motions up to ∼4 ns with good accuracy (±0.5 ns). We note that the potential variation in 15N CSA does not affect the final corrected
  values (22). The
  of the CaM:SEF2-1mp complex corrected in this way are shown in Fig. 4 a.
FIGURE 4.
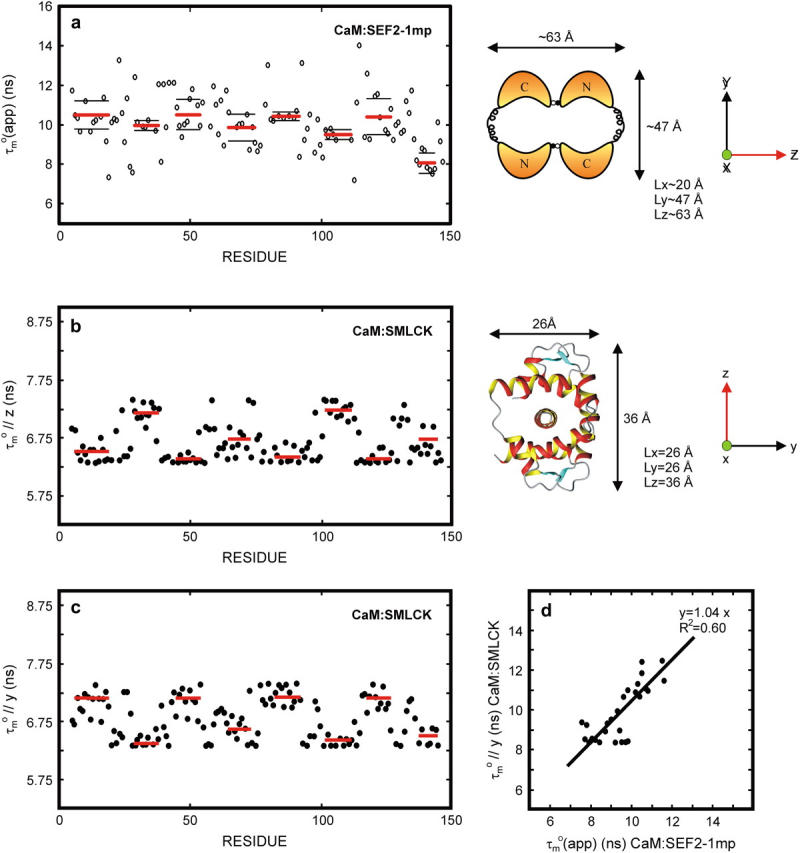
The derived local overall tumbling time  for CaM in the CaM:SEF2-1mp complex (○) (a, left). The error in the individual
  values of the CaM:SEF2-1mp complex is ±0.9 ns (derived from the error in R1 and R2). The average
  of the α-helices are indicated with red lines and their standard deviations as black lines. The right panel shows a schematic figure of the CaM:SEF2-1mp complex that is compatible with both the classical NMR data from Larsson et al. (22) and the global structure information derived from the relaxation data presented here. The axial ratio of the diffusion tensor (2Dz/(Dx + Dy)) is approximated to be ∼1.8, assuming a cylinder-shaped molecule. In panel b (left) the back calculated
  from the CaM:SMLCK complex (9) are shown. Via hydrodynamic calculations the diffusion tensor was determined to be cylinder symmetric with τl = 7.4 ns at 308 K. The dimensions of the complex and the orientation of the diffusion tensor are shown in panel b (right). Panel c shows the back calculated
  from the CaM:SMLCK complex assuming that the molecule has rotated by 90° with respect to the original diffusion tensor giving (τ//y). In panel d the (τ//y) values from the C-terminal residues in panel c (scaled to the size and shape of the CaM:SEF2-1mp complex) are plotted against the
  of the corresponding residues in the CaM:SEF2-1mp complex. A clear correlation is seen between these values, indicating that the main axis of the diffusion tensor has indeed rotated ∼90° in the CaM:SEF2-1mp complex compared with that of the CaM:SMLCK complex.
Rotational diffusion anisotropy and global orientation
A cylinder-shaped model with a small degree of anisotropy has, according to Eq. 2, a  that depends on the angle, Φ, between the relaxation vector and the long axis of the diffusion tensor. Thus,
  contains information about the orientation of the N-HN bond vector via the angle Φ. From the distribution of
  values, the shape of the diffusion tensor can be determined (30), whereas the degree of anisotropy can be gauged from the maximum and minimum
  values. Given the anisotropy and the maximum
  the angle Φ that each N-HN bond vector makes with the main axis of the diffusion tensor can be calculated. Moreover, the N-HN bond vectors of an α-helix are nearly parallel (within 15°) to the axis of an α-helix. Thus, the N-HN bond vectors within an α-helix must have similar
  and the average
  for each helix can be taken to reduce the error. The angle that a helix axis makes with the main axis of the diffusion tensor can therefore be determined with reasonable accuracy from
  averaged over a helix.
The variation in  in Fig. 4 a shows that the CaM:SEF2-1mp complex tumbles anisotropically. From the estimated maximum and minimum values of
  12.4 ± 0.4 ns and 7.7 ± 0.3 ns, respectively, the anisotropy of the diffusion tensor is calculated to be 2.2 ± 0.2 (the average and standard deviation of the 10 highest and 10 lowest
  ). Given an anisotropy of 2.2 (Δ = 1.2) and
  of 12.4 ns, the angles Φ that the helices in CaM make with the main axis of the diffusion tensor were derived using Eq. 2: helix I 35 ± 8° (10.5 ± 0.6), helix II 40 ± 3° (10.0 ± 0.2), helix III 32 ± 9° (10.2 ± 0.7), helix IV 44 ± 10° (9.7 ± 0.6), helix V 37 ± 10° (10.3 ± 0.4), helix VI 45 ± 3° (9.6 ± 0.2), helix VII 31 ± 14° (10.6 ± 0.8), and helix VIII 71 ± 14° (8.1 ± 0.5). Here, the average
  values for the α-helices are given in parentheses and the error on Φ was based on a uniform error in
  of 1.2 ns. A minimum estimate of the anisotropy of 1.6 ± 0.3 is achieved when only the average
  in the helices are considered. The Φ angles, recalculated with the smaller anisotropy, were essentially within the error margins of the earlier estimates. We therefore conclude that not only the pattern of Φ angle values is reliable, but that also the values are correct within the error margins.
The backbone structures of the CaM N- and C-terminal domains within the CaM:SEF2-1mp complex are expected to be very similar to those in other CaM structures. This is based on the relative small differences in chemical shifts between free and SEF2-1mp bound CaM and the low root mean square deviation of 1.6 Å when the backbones from N- and C-terminal domains from eight other CaM molecules were compared (data not shown). Hydrodynamic calculations on the CaM:SMLCK complex showed that its diffusion tensor is nearly axially symmetric with a  pattern for the α-helices that is almost a mirror image of that in the CaM:SEF2-1mp complex, Fig. 4 b. This means that the orientation of the diffusion tensor in the CaM:SEF2-1mp complex has rotated by ∼90° relative to that of the CaM:SMLCK complex. In fact, the pattern of
  back calculated from the CaM:SMLCK complex when the diffusion tensor would be oriented along an axis perpendicular to the real diffusion tensor closely matches the pattern of
  found for the dimeric CaM:SEF2-1mp complex, Fig. 4 c. The qualitative structural implication is, therefore, that the second CaM monomer in the dimeric complex is placed along this axis in such a way that the tips of the N- and C-terminal domains touch each other. This ∼90° rotation of the diffusion tensor together with the relatively small structural changes within each CaM domain puts direct restraints on the overall structure of the CaM:SEF2-1mp complex, which allows us to choose one of the two possible schematic structure models proposed in our earlier study (11) (see Figs. 1 and 4 a, right).
Model selection, order parameters, and timescales for internal motion
Based on the qualitative analysis of the  versus NOE plots, Fig. 3, we tested internal motion models with either one (M1; τi and S2 fitting parameters) or two contributions (M2; τif,
  and
and  fitting parameters) to the internal motion. The
  was either kept at a uniform constant value (M2I) or optimized together with τif and
  (M2II). A complete overview of the different fit results is given in the Supplementary Material (Tables S3–S8).
As expected from Fig. 3, there is a statistically significant improvement in χ2 for the vast majority of CaM N-HN backbone vectors when a second internal correlation time is introduced. When different τis values were tested, the lowest χ2 values and hence the best overall fit was found for τis equal to 2.5 ns. Although the differences in the χ2 residuals between M2II models with different τis are not statistically significant, it is safe to conclude that there is a slow timescale motion present with a correlation time of roughly 2.5 ns. The optimized  values have an average of 0.75 ± 0.07, and are fairly uniform throughout the sequence, except for five outliers with
  values between 0.9 and 1. The
  and τif values extracted from M2II are presented in Fig. 5 and vary around 0.8 and between 5 and 200 ps, respectively. These values are very similar to those found in the core of small well-structured proteins.
FIGURE 5.

The order parameter,  (a) and time constant τif (b) of the fast (picosecond) internal motion. The data are from a fit using the two-contribution model, M2II (see text). The time constant τis of the slower internal motion was set to 2.5 ns in the fit. The order parameter of this internal motion,
  was found to be 0.75 ± 0.07 on average. The exact
  and τis values are given in Supplementary Material (Table S5).
In conclusion, the relaxation data show that the dimeric CaM:SEF2-1mp complex has an additional nanosecond-timescale internal motion (∼2.5 ns) superimposed onto the picosecond-timescale internal motion usually found in well-structured proteins.
Structural interpretation of the nanosecond-timescale internal motion
The dimeric CaM:SEF2-1mp complex can in principle show internal modes of motion involving either the individual N- and C- terminal domains and/or the CaM monomers as a whole. Hydrodynamic calculations can provide some indication as to the structural assignment of the internal motions identified from NMR relaxation experiments (see Supplementary Material). Briefly, we find: i), the observed 2.5-ns internal motion in the CaM:SEF2-1mp complex can be attributed to motions of the separate N- and C-terminal domains of CaM, because the free domains have an overall correlation time of ∼3 ns. ii), It cannot be excluded, but also not definitely confirmed, that some degree of CaM “monomer” internal motion of ∼7–9 ns (estimated tumbling time of free CaM monomer) is also present in the complex.
Dynamics on micro- to millisecond timescale
Three different approaches were used to determine which CaM residues in the CaM:SEF2-1mp complex are affected by conformational exchange. Firstly, Rex was derived from the ratio of R2 values measured via a CPMG experiment at two different magnetic fields using the PINATA method. Secondly, the relaxation-compensated CPMG experiment (20) was employed at 500 and 600 MHz to measure ΔRex. Thirdly, the relaxation-compensated CPMG experiment at 600 MHz was repeated at a lower temperature (300 K instead of 308 K) to measure the change in ΔRex, ΔΔRex. The exchange data for all residues are summarized in Fig. 6, whereas Table 1 collects the data for residues with significant exchange broadening (see table legend for more details).
FIGURE 6.

Exchange rates for CaM in the CaM:SEF2-1mp complex. Residues with significant exchange rates are marked with their residue number. The secondary structural elements of CaM are outlined in each panel. The error bars have been left out for clarity. All exchange rates are at a nominal field of 600 MHz. For a numerical data list and further details we refer to Table S2. (a) Exchange rates, Rex, at 600 MHz and at 308 K, as determined from the ratio of R2 relaxation rates at 400 and 600 MHz (22). The error in the Rex is ∼±2 s−1, based on 3% average error in the R2 derived at 400 MHz, 4% average error in the R2 derived at 600 MHz, and possible variations in the 15N chemical shift anisotropy between −150 and −200 ppm. (b) Conformational exchange at a nominal field of 600 MHz and at 308 K as determined with the relaxation-compensated CPMG experiment (20). The difference in R2 (ΔRex) determined with 2δ = 3.6 ms and 2δ = 450 μs in the CPMG is plotted as a function of the CaM sequence. ΔRex is the average of measurements at 600 MHz (hard 15N 180-pulse) and 500 MHz (hard and soft 15N 180-pulse). The ΔRex values at 500 MHz were multiplied with 1.44 to convert to 600 MHz field. The error in the ΔRex is ±0.7 s−1, based on the standard deviation between the three individual ΔRex experiments. (c) The difference in ΔRex (ΔΔRex) at 600 MHz determined at 308 and 300 K. The error margin is ±1.4 s−1 (indicated by horizontal lines), based on the average error in ΔRex of ±0.7 s−1 at both temperatures.
TABLE 1.
Analysis of residues with significant exchange broadening
| Residue* | ΔRex* (s−1) | ΔΔRex†(s−1) | Rex* (s−1) |
 (μs)* (μs)*
|
 (ppm)* (ppm)*
|
f† |
|---|---|---|---|---|---|---|
| 14 | <0.7 | −2.3 | 4.5 | <33 | 1.5 | <0.5 |
| 19 | 3.4 | −3.6 | 12.0 | 55 | 2.8 | 0.6 |
| 27 | 1.6 | 0.0 | 8.6 | 40 | 2.8 | 0.8 |
| 28 | 2.0 | 1.1 | 7.2 | 55 | 2.2 | 0.9 |
| 36 | 2.2 | 1.6 | 1 | >220 | <0.8 | – |
| 39 | 4.7 | 1.5 | 23.8 | 40 | 4.6 | 0.9 |
| 42 | 4.2 | −1.0 | 1.7 | >210 | <0.9 | – |
| 51 | 0.5 | −1.5 | 2.8 | 37 | 1.2 | 0.5 |
| 55 | 6.2 | −7.8 | 28.0 | 45 | 4.6 | 0.6 |
| 57 | 2.9 | 1.45 | 1 | >230 | <0.8 | – |
| 60 | 3.3 | −0.1 | 5.8 | 90 | 1.7 | 0.8 |
| 72 | 2.3 | −0.0 | 10.0 | 20 | 2.8 | 0.8 |
| 73 | 2.2 | 0.4 | 7.9 | 62 | 2.3 | 0.9 |
| 75 | 1.6 | −0.3 | 6.5 | 50 | 2.2 | 0.8 |
| 76 | 0.6 | −8.9 | 11.0 | 15 | 5.0 | 0.4 |
| 77 | 1.9 | 0.7 | 8.5 | 45 | 2.6 | 0.8 |
| 92 | 2.2 | −1.1 | 8.3 | 55 | 2.4 | 0.7 |
| 112 | 3.4 | 1.7 | 8.0 | 70 | 2.2 | 0.9 |
| 113 | 3.2 | 1.2 | 9.5 | 60 | 2.4 | 0.9 |
| 115 | 4.6 | 1.2 | 1 | >300 | <1.1 | – |
| 118 | <0.7 | −2.0 | 3.3 | <35 | 1.4 | <0.5 |
| 142 | – | – | 20.3 | – | – | – |
| 144 | 0.8 | 0.5 | 8.0 | 20 | 3.6 | 0.8 |
| 146 | 5.8 | –0.7 | 9.9 | 90 | 2.2 | 0.8 |
| 147 | 2.7 | 1.7 | 2.2 | 145 | 1 | 0.9 |
Selected residues (selection value underlined) with either Rex > 6.4 s−1 or ΔRex > 2.5 s−1 or ΔΔRex < −1.4 s−1. The fast exchange equations were used to derive  from the correlation of ΔRex and Rex as explained in the Theory section. The error in
  is estimated to be ∼30 μs and ∼1 ppm in
  based on 1 s−1 errors in ΔRex and Rex;
  is calculated from
  with pA = pB = 0.5 and represents the minimum value of Δex, because pApB reaches a maximum at pA = 0.5. The ΔRex showed a systematic offset of ∼−2 s−1. The values given and used in the derivation of
  and
and  have been corrected for this offset. Residues 36, 42, 57, and 115 have small Rex; the
  is a lower limit and the
  an upper limit based on a maximum value of Rex of 1 s−1.
Residues 14, 19, 51, 55, 76, 92, 118, and 146 show a relatively high decrease in ΔRex (ΔΔRex < −0.5, italic) upon decrease in temperature, leading to relatively large fractional decrease in the exchange rate kex (f = kex,300/kex,308, italic; see Theory section for the equations used). Based on the error in ΔΔRex (1.4 s−1) and ΔRex (0.7 s−1), the error in f is estimated to be 0.15. For the four residues 36, 42, 57, and 115, no reliable estimate of f can be made, because of the uncertainty in the value of kex. For residues 14 and 118 the upper limit of f and  is given as estimated from the lower limit of ΔRex.
A single set of CaM resonances, such as we observe, implies fast exchange and/or slow exchange to a lowly populated state (33,34). In our previous titration experiment on the CaM:SEF2-1mp complex (11) we always observed a single set of CaM resonances that shifts position upon different CaM:SEF2-1mp ratios, i.e., at different populations of free and bound CaM. It can therefore be concluded that free and peptide-bound CaM are in fast exchange. However, at the relatively high CaM concentration (1 mM) used in the NMR experiments, compared to the nanomolar dissociation constant of the complex, all CaM is in the bound state. The exchange broadening must then be due to conformational exchange between different conformations of bound CaM. Nevertheless, the established fast exchange between bound and free CaM does not exclude the possibility of slow exchange between one (or more) highly populated bound state(s) of CaM and a lowly populated bound state.
As described in the Theory section, kex can be derived from the correlation between Rex and ΔRex without prior assumption on the timescale of the exchange. Such a correlation diagram of Rex and ΔRex is shown in Fig. 7, which shows theoretical correlation lines for some representative kex values together with the measured Rex and ΔRex. The data points scatter around the line with  For the residues with significant exchange broadening, specific
  values were derived (Table 1). They generally have
  values below 100 μs confirming the trend. Hence, for any reasonable value of Δex (up to 6 ppm), these residues are in fast exchange (
 ). Only residues 36, 42, 57, and 115 are exceptions with
  values above ∼200 μs. They can either be in fast exchange or in slow exchange to a lowly populated bound CaM state.
For  Eq. 8 holds and consequently a negative ΔΔRex implies a decrease in exchange rate (f < 1) at the lower temperature. Equations 8 and 10 further show that residues with large negative ΔΔRex have a high activation barrier, whereas those with small negative ΔΔRex experience the opposite. The observed ΔΔRex values in Fig. 6 c are all negative, as expected for
  For the selected residues in Table 1, the fractional change in exchange rate, f, was calculated. Residues 36, 42, 57, and 115 were excluded from this analysis, because they have
  Residues 14, 19, 51, 55, 76, 92, and 118 show a relatively strong decrease in exchange rate upon change in temperature (f = 0.4–0.7). This corresponds to ΔH# values of 8–18 kcal/mol, when employing a two-state exchange model, Eq. 9 (the root mean square (rms) error in ΔH# is ∼4 kcal/mol, based on the rms error in f of ∼0.15). The remaining residues (see Table 1) show a weak decrease in exchange rate upon change in temperature (f ≈ 0.9 ± 0.1). Consequently, they have a lower activation enthalpy of ∼3.5 ± 1.3 kcal/mol. Interestingly, the residues with (f = 0.4–0.7) are all located in α-helices, whereas the residues with f ≈ 0.9 ± 0.1 are all in nonhelical regions except residues 72, 73, and 75, which are part of the less well-defined C-terminal part of helix IV. Thus, the residues with significant exchange broadening can be placed into two groups: those located in helices with a relatively high activation barrier, and those located in loops with a relatively low activation barrier. Akke and co-workers (38) have also found larger ΔH# values for residues that are part of regular secondary structure and smaller values for loop residues, in their study on the C-terminal domain of CaM.
Deriving the activation barriers assuming a two-state exchange is likely to be a significant simplification, as the conformational landscape may be much more complex. For instance, in the so-called rugged landscape ΔH# should be viewed as an average (38). Nevertheless, the trends remain correct, but the ΔH# numbers should be considered with proper care.
Nuclei that are influenced by chemical exchange have been shown to correlate with residues known to be critical for protein interactions and enzymatic activity (39,40,41,42,43,44). We find that residues with significant exchange broadening (Table 1) group in a model structure of the CaM:SEF2-1mp complex into three regions: i), the CaM dimerization interface, i.e., at the tips of the N- and C-terminal domains, ii), close to the hinge region connecting the N- and C-terminal domains, iii), close to the hydrophobic pockets in the N- and C-terminal domains where the target binds (see Fig. 8). This clustering suggests a direct relation between the observed conformational exchange and the CaM-SEF2-1mp interactions (vida infra).
FIGURE 8.

Model of the CaM dimer. Different regions with significant conformational exchange (Table 1) are shown as surface representations in the left CaM molecule. The regions are localized in the vicinity of the N- and C-terminal hydrophobic pockets (red and yellow areas, respectively), in the dimerization interface of the N- and C-terminal regions (green and orange areas, respectively), and in the central helix (blue area). Residues 14 and 118 are excluded because they do not group into the above-defined clusters. The model of the CaM dimer is based on the CaM:SMLCK complex (9) where the N- and C-terminal domains of CaM have been rotated in such a way that the derived helical angles (vide supra) relative to the long axis of the diffusion tensor (z axis) are roughly in the correct orientation.
DISCUSSION
The dimeric CaM:SEF2-1mp complex shows unique dynamical behavior. Its apparent overall correlation time is ∼10 ns at 308 K, as expected for a highly dynamic complex of this shape and size. The complex shows ∼20-ps-timescale fast internal motion with order parameters  around 0.8, as usually seen in well-structured proteins. Interestingly, all N-HN vectors are also affected by an additional internal motion of ∼2.5 ns with
  of ∼0.75. This timescale corresponds well with the expected motions of the N- and C-terminal CaM domains. Thus, the data are consistent with a motional model in which the two N-terminal and two C-terminal CaM domains in the dimeric CaM:SEF2-1mp complex undergo a small-scale wobbling motion with a half-angle of ∼20° as estimated from
  However, the present data cannot exclude internal motion involving reorientation of the CaM monomers, which have an excepted timescale of ∼7–9 ns. Furthermore, several residues in CaM also undergo conformational exchange on a timescale of ∼50 μs. All the significantly exchanging residues are clustered in well-defined regions, namely on the CaM:SEF2-1mp interaction interface, in the CaM:CaM dimerization interface or in the flexible hinge region that connects the N- and C-terminal domains within the CaM monomer.
The dimeric SEF2-1mp peptide binds within the interior of the eight-shaped CaM dimer via multiple binding alternatives. This is based on the observations that the bound SEF2-1mp lacks any well-defined conformation, and that not all hydrophobic peptide residues simultaneously interact with the hydrophobic patches on the inner surface of the CaM dimer (11). The CaM dimer is created by the tip of the N-terminal domain of one CaM monomer contacting the tip of the C-terminal domain of the other CaM. Hence, there are four hinge regions in the CaM dimer. Two of the hinge regions are formed by the flexible part of the central helix of the CaM molecules, and the other two hinge regions are formed by the flexible dimerization interfaces. The four hinge regions create a flexible CaM dimer that can easily slide along or wobble over the peptide sequence allowing it to interact with the different binding sites in the interior of the CaM dimer. The sliding process is likely to occur on a nanosecond timescale, although CaM:SEF2-1mp interactions may slow down this process in some instances. Indeed, apart from the nanosecond-timescale wobbling motion of the CaM domains and/or monomers, conformation exchange on the microsecond timescale (∼50 μs) is also evident.
We have compared the characteristics of the CaM:SEF2-1mp interaction with those of other CaM:protein complexes and other protein:protein complexes. In the common wraparound CaM:target binding the hydrophobic patches of CaM and target fit well, resulting in an induced-fit binding where only one binding alternative is needed. Furthermore, the nanosecond-timescale domain motion, present in free CaM, seems to be frozen out, and as far as we know, microsecond-timescale motions are not present in the wraparound binding (10). Note, however, that NMR relaxation data on various protein:target complexes do show a redistribution of motions upon specific target binding. For instance, the barnase (45) and oxalocrotonate tautomerase (46) bind specifically to their rigid target to form a specific complex with essentially one overall conformation. The PLC-γ1 C-terminal SH2 domain (19) and Csk SH3 domain (47) bind specifically to their flexible (peptide) target to form a specific complex, again with essentially one overall conformation. The mouse major urinary protein:pheromone interaction (48) and the topoisomerase I domain interaction with single-stranded DNA (49) have, or suggest to have, the aspect of multiple-binding alternatives in the bound state. However, these binding modes are essentially different from those of CaM-SEF2-1mp, because the target-binding proteins do not undergo large-scale motion in the bound state. Processive enzymes, when sliding along their targets (50), have the closest similarity to CaM:SEF2-1mp binding. However, the sliding mechanism is usually a nonspecific target interaction, whereas in CaM-SEF2-1mp it is specific.
In contrast to known protein:target binding modes, the CaM:SEF2-1mp complex shows large-scale (domain) dynamics in the bound state. The interaction is clearly different from the well-known categories of specific binding by lock-and-key or induced-fit binding, in which the complex in the bound state becomes essentially locked in one conformation. Two aspects of this type of binding as compared to rigid binding are important to discuss, the presence of fast exchange, and the effect on high affinity and specificity.
Fast exchange on the NMR timescale indicates off rates koff > 2 ΔδN, which for the CaM:SEF2-1mp complex is ∼30 s−1 (Table 1). Therefore, a purely diffusion-controlled on-rate kon of 108 s−1 M−1 would put a lower limit on the CaM:SEF2-1mp affinity, koff/kon > 10−6. However, in the CaM:SEF2-1mp complex, the two basic peptide arms are trapped in the hydrophobic interior of the CaM dimer. Consequently, the on-rate of the equilibrium between free and CaM-bound peptide will be faster than diffusion controlled, which explains the fast exchange and the high affinity observed in the CaM:SEF2-1mp interaction (11). It is tempting to speculate that the CaM dimer opening-closing process is coupled with the CaM:SEF2-1mp interaction, i.e., when the CaM:SEF2-1mp interaction brakes, one side of the CaM dimer interaction also momentarily brakes. However, due to the close proximity of all involved components, a new CaM:SEF2-1mp interaction is rapidly reformed, which in turn forces the CaM dimer to close again. This collective process could explain the fact that essentially all resonances affected by conformational exchange have approximately the same time constant and are clustered in regions important for either CaM:CaM or CaM:SEF2-1mp interactions.
Mutation studies on E12 (a bHLH protein similar to SEF2-1) have shown a gradual decrease in CaM affinity upon each mutation of an interacting residue, and not the on-off behavior usually seen with lock-and-key or induced-fit binding mechanisms (15). In other words, the CaM:SEF2-1mp binding shows many weak interactions rather than a few strong interactions as found in lock-and-key or induced-fit binding. Thus, removing an interaction is indeed expected to have only a small effect on the affinity. The presence of exchange between multiple-target sites and flexibility in the bound state leads to an important advantage over rigid binding, namely that the affinity (and specificity) is finely tuned. However, this same aspect leads to a lower affinity and specificity than for (cooperative) rigid binding (with all target sites simultaneously and rigidly interacting). This loss is compensated via multimerization. In CaM:bHLH interactions two flexibly bound complexes form a flexibly bound dimer of complexes, defining a geometric context and thereby increasing the number of interactions and thus leading to high affinity and specificity.
In conclusion, the CaM:SEF2-1mp binding seems indeed distinct from other known protein:target binding modes. Its characteristic features are: i), specific high-affinity binding in the presence of fast exchange, ii), accommodation of a relatively nonmatching and flexible target via exchange between multiple binding alternatives, iii) dimerization of CaM upon target binding, and iv), large-scale (domain) motions on the nanosecond and microsecond timescale. Thus, the dynamic features presented here support the conclusion that the conformationally heterogeneous SEF2-1mp, trapped inside the CaM dimer, constantly exchanges between different binding sites. Nature has thus found a way for CaM to specifically recognize a relatively ill-fitting target in its regulation of bHLH transcription factors.
SUPPLEMENTARY MATERIAL
An online supplement to this article can be found by visiting BJ Online at http://www.biophysj.org.
Supplementary Material
Acknowledgments
We thank Janny Hof for critical reading of the manuscript.
This work was supported by grants from the Swedish Research Council (S.W. and T.G.); the Basic-Science-Oriented Biotechnology Research at Umeå University (S.W.); the Swedish Research Council for Engineering Sciences/SSF (T.G.); and the Kempe Foundation, The Royal Swedish Academy of Science, and the Wenner-Gren foundations (G.L.).
Jacqueline Onions' present address is ICRF Skin Tumour Labs, Centre for Cutaneous Research, 2 Newark St., London, London E1 2AT, UK.
Stefan Hermann's present address is Dept. of Biosciences, Karolinska Institute, Novum, S-141 57 Huddinge, Sweden.
Sybren S. Wijmenga's present address is Dept. of Physical Chemistry-Laboratory of Biophysical Chemistry, University of Nijmegen, Toernooiveld 1, 6525 ED, Nijmegen, The Netherlands.
References
- 1.Babu, Y. S., C. E. Bugg, and W. J. Cook. 1988. Structure of calmodulin refined at 2.2 A resolution. J. Mol. Biol. 204:191–204. [DOI] [PubMed] [Google Scholar]
- 2.Ikura, M., S. Spera, G. Barbato, L. E. Kay, M. Krinks, and A. Bax. 1991. Secondary structure and side-chain H-1 and C-13 resonance assignment of calmodulin in solution by heteronuclear multidimensional NMR spectroscopy. Biochemistry. 30:9216–9228. [DOI] [PubMed] [Google Scholar]
- 3.Baber, J. L., A. Szabo, and N. Tjandra. 2001. Analysis of slow interdomain motion of macromolecules using NMR relaxation data. J. Am. Chem. Soc. 123:3953–3959. [DOI] [PubMed] [Google Scholar]
- 4.Barbato, G., M. Ikura, L. E. Kay, R. W. Pastor, and A. Bax. 1992. Backbone dynamics of calmodulin studied by N-15 relaxation using inverse detected 2-dimensional NMR-spectroscopy: the central helix is flexible. Biochemistry. 31:5269–5278. [DOI] [PubMed] [Google Scholar]
- 5.Tjandra, N., H. Kuboniwa, H. Ren, and A. Bax. 1995. Rotational-dynamics of calcium-free calmodulin studied by 15N NMR relaxation measurements. Eur. J. Biochem. 230:1014–1024. [DOI] [PubMed] [Google Scholar]
- 6.Van Eldik, L., and D. M. Watterson. 1998. Calmodulin and Signal Transduction. Academic Press, London, UK.
- 7.Mellström, B., and B. Naranjo. 2001. Mechanisms of Ca2+-dependent transcription. Current Opinion in Neurobiology. 11:312–319. [DOI] [PubMed] [Google Scholar]
- 8.Ikura, M., G. M. Clore, A. M. Gronenborn, G. Zhu, C. B. Klee, and A. Bax. 1992. NMR solution structure of a calmodulin-target peptide complex by multidimensional NMR. Science. 256:632–638. [DOI] [PubMed] [Google Scholar]
- 9.Meador, W. E., A. R. Means, and F. A. Quiocho. 1992. Target enzyme recognition by calmodulin: 2.4-angstrom structure of calmodulin-peptide complex. Science. 257:1251–1255. [DOI] [PubMed] [Google Scholar]
- 10.Lee, A. L., S. A. Kinnear, and A. J. Wand. 2000. Redistribution and loss of side chain entropy upon formation of a calmodulin-peptide complex. Nat. Struct. Biol. 7:72–77. [DOI] [PubMed] [Google Scholar]
- 11.Larsson, G., J. Schleucher, J. Onions, S. Hermann, T. Grundström, and S. S. Wijmenga. 2001. A novel target recognition revealed by calmodulin in complex with the basic helix-loop-helix transcription factor SEF2–1/E2–2. Protein Sci. 10:169–186. [DOI] [PMC free article] [PubMed] [Google Scholar]
- 12.Littlewood, T. D., and G. I. Evan. 1998. Helix-Loop-Helix Transcription Factors. Oxford University Press, Oxford, UK.
- 13.Massari, M. E., and C. Murre. 2000. Helix-loop-helix proteins: regulators of transcription in eucaryotic organisms. Mol. Cell. Biol. 20:429–440. [DOI] [PMC free article] [PubMed] [Google Scholar]
- 14.Fairman, R., R. K BeranSteed, and T. M. Handel. 1997. Heteronuclear (H-1,C-13,N-15) NMR assignments and secondary structure of the basic region-helix-loop-helix domain of E47. Protein Sci. 6:175–184. [DOI] [PMC free article] [PubMed] [Google Scholar]
- 15.Saarikettu, J., N. Sveshnikova, and T. Grundström. 2004. Calcium/calmodulin inhibition of transcriptional activity of E-proteins by prevention of their binding to DNA. J. Biol. Chem. 279:41004–41011. [DOI] [PubMed] [Google Scholar]
- 16.Onions, J., S. Hermann, and T. Grundstrom. 2000. A novel type of calmodulin interaction in the inhibition of basic helix-loop-helix transcription factors. Biochemistry. 39:4366–4374. [DOI] [PubMed] [Google Scholar]
- 17.Onions, J., S. Hermann, and T. Grundström. 1997. Basic helix-loop-helix protein sequences determining differential inhibition by calmodulin and S-100 proteins. J. Biol. Chem. 272:23930–23937. [DOI] [PubMed] [Google Scholar]
- 18.Wishart, D. S., C. G. Bigam, J. Yao, F. Abildgaard, H. J. Dyson, E. Oldfield, J. L. Markley, and B. D. Sykes. 1995. H-1, C-13 and N-15 chemical-shift referencing in biomolecular NMR. J. Biomol. NMR. 6:135–140. [DOI] [PubMed] [Google Scholar]
- 19.Farrow, N. A., D. R. Muhandiram, A. U. Singer, S. M. Pascal, C. M. Kay, G. Gish, S. E. Shoelson, T. Pawson, J. D. Forman-Kay, and L. E. Kay. 1994. Backbone dynamics of a free and phosphopeptide-complexed Src-2 homology domain studied by 15N relaxation. Biochemistry. 33:5984–6003. [DOI] [PubMed] [Google Scholar]
- 20.Loria, J. P., M. Rance, and A. G. Palmer. 1999. A relaxation-compensated Carr-Purcell-Meiboom-Gill sequence for characterizing chemical exchange by NMR spectroscopy. J. Am. Chem. Soc. 121:2331–2332. [Google Scholar]
- 21.Viles, J. H., B. M. Duggan, E. Zaborowski, S. Schwarzinger, J. J. A. Huntly, G. J. A. Kroon, H. J. Dyson, and P. E. Wright. 2001. Potential bias in NMR relaxation data introduced by peak intensity analysis and curve fitting methods. J. Biomol. NMR. 21:1–9. [DOI] [PubMed] [Google Scholar]
- 22.Larsson, G., G. Martinez, J. Schleucher, and S. S. Wijmenga. 2003. Detection of nano-second time scale internal motion and determination of overall tumbling times independent of the time scale of internal motion in proteins from 15N relaxation data. J. Biomol. NMR. 27:291–312. [DOI] [PubMed] [Google Scholar]
- 23.Clore, G. M., A. Szabo, A. Bax, L. E. Kay, P. C. Driscoll, and A. M. Gronenborn. 1990. Deviations from simple two-parameter model-free approach to the interpretation of nitrogen-15 nuclear magnetic relaxation of proteins. J. Am. Chem. Soc. 112:4989–4991. [Google Scholar]
- 24.Orekhov, V. Y., D. E. Nolde, A. P. Golovanov, and A. S. Arseniev. 1996. Dasha 3.3. Appl. Magn. Reson. 9:581–588. [Google Scholar]
- 25.Lipari, G., and A. Szabo. 1982. Model-free approach to the interpretation of nuclear magnetic resonance relaxation in macromolecules. I. Theory and range validation. J. Am. Chem. Soc. 104:4546–4559. [Google Scholar]
- 26.Korzhnev, D. M., M. Billeter, A. S. Arseniev, and V. Y. Orekhov. 2001. NMR study of Brownian tumbling and internal motions in proteins. Prog. Nucl. Magn. Reson. Spectrosc. 38:197–266. [Google Scholar]
- 27.Abragam, A. 1961. The Principles of Nuclear Magnetism. Clarendon Press, Oxford, UK.
- 28.Schurr, J. M., H. P. Babcock, and B. S. Fujimoto. 1994. A test of the model-free formulas: effects of anisotropic rotational diffusion and dimerization. J. Magn. Reson. B. 105:211–224.7850167 [Google Scholar]
- 29.Tjandra, N., S. E. Feller, R. W. Pastor, and A. Bax. 1995. Rotational diffusion anisotropy of human ubiquitin from 15N NMR relaxation. J. Am. Chem. Soc. 117:12562–12566. [Google Scholar]
- 30.Clore, G. M., A. M. Gronenborn, A. Szabo, and N. Tjandra. 1998. Determining the magnitude of the fully asymmetric diffusion tensor from heteronuclear relaxation data in the absence of structural information. J. Am. Chem. Soc. 120:4889–4890. [Google Scholar]
- 31.Zdunek, J., G. Martinez, J. Schleucher, H. J. Ippel, P.-O. Lycksell, Y. Yin, S. Nilsson, Y. Shen, G. Olivecrona, and S. S. Wijmenga. 2003. Global structure and dynamics of recombinant human Apolipoprotein CII in complex with SDS micelles: evident for increased helix mobility in the binding/activation site for lipoprotein lipase. Biochemistry. 42:1872–1889. [DOI] [PubMed] [Google Scholar]
- 32.Korzhnev, D. M., V. Y. Orekhov, and A. S. Arseniev. 1997. Model-free approach beyond the borders of its applicability. J. Magn. Reson. 127:184–191. [DOI] [PubMed] [Google Scholar]
- 33.Millet, O., J. P. Loria, C. D. Kroenke, M. Pons, and A. G. Palmer. 2000. The static magnetic field dependence of chemical exchange linebroadening defines the NMR chemical shift time scale. J. Am. Chem. Soc. 122:2867–2877. [Google Scholar]
- 34.Ishima, R., and D. A. Torchia. 1999. Estimating the time scale of chemical exchange of proteins from measurements of transverse relaxation rates in solution. J. Biomol. NMR. 14:369–372. [DOI] [PubMed] [Google Scholar]
- 35.Moore, W. J. 1972. Physical Chemistry. Longman, London, UK.
- 36.Fersht, A. 1985. Enzyme Structure and Mechanism. W. H. Freeman, New York, NY.
- 37.Laidler, K. J. 1987. Chemical Kinetics. Harper & Row, New York, NY.
- 38.Evenäs, J., S. Forsen, A. Malmendal, and M. Akke. 1999. Backbone dynamics and energetics of a calmodulin domain mutant exchanging between closed and open conformations. J. Mol. Biol. 289:603–617. [DOI] [PubMed] [Google Scholar]
- 39.Akke, M., J. Liu, J. Cavanagh, H. Erickson, and A. G. Palmer. 1998. Pervasive conformational fluctuations on microsecond time scales in fibronectin type III domain. Nat. Struct. Biol. 5:55–59. [DOI] [PubMed] [Google Scholar]
- 40.Kay, L. E. 1998. Protein dynamics from NMR. Biochem. Cell Biol. 76:145–152. [DOI] [PubMed] [Google Scholar]
- 41.Feher, V. A., and J. Cavanagh. 1999. Millisecond-timescale motions contribute to the function of the bacterial response regulator protein Spo0F. Nature. 400:289–293. [DOI] [PubMed] [Google Scholar]
- 42.Mulder, F. A. A., P. J. A. van Tillborg, R. Kaptein, and R. Boelens. 1999. Microsecond time scale dynamics in the RXR DNA-binding domain from a combination of spin-echo and off-resonance rotating frame relaxation measurements. J. Biomol. NMR. 13:275–288. [DOI] [PubMed] [Google Scholar]
- 43.Ishima, R., and D. A. Torchia. 2000. Protein dynamics from NMR. Nat. Struct. Biol. 7:740–743. [DOI] [PubMed] [Google Scholar]
- 44.Volkman, B. F., D. Lipson, D. E. Wemmer, and D. Kern. 2001. Two state allosteric behavior in a single-domain signaling protein. Science. 291:2429–2433. [DOI] [PubMed] [Google Scholar]
- 45.Sahu, S. C., A. K. Bhuyan, J. B. Udgaonkar, and R. V. Hosur. 2000. Backbone dynamics of free barnase and its complex with barstar determined by 15N NMR relaxation study. J. Biomol. NMR. 18:107–118. [DOI] [PubMed] [Google Scholar]
- 46.Stivers, J. T., C. Abeygunawardana, A. S. Mildvan, and C. P. Whitmap. 1996. N-15 NMR relaxation studies of free and inhibitor-bound 4-oxalocrotonate tautomerase: backbone dynamics and entropy changes of an enzyme upon binding. Biochemistry. 35:16036–16047. [DOI] [PubMed] [Google Scholar]
- 47.Ghose, R., A. Shekhtman, M. Goger, H. Ji, and D. Cowburn. 2001. A novel, specific interaction involving the Csk SH3 domain and its natural ligand. Nat. Struct. Biol. 8:998–1004. [DOI] [PMC free article] [PubMed] [Google Scholar]
- 48.Zidek, L., M. V. Novotny, and M. J. Stone. 1999. Increased protein backbone conformational entropy upon hydrophobic ligand binding. Nat. Struct. Biol. 6:1118–1121. [DOI] [PubMed] [Google Scholar]
- 49.Yu, L., C. X. Zhu, Y. C. Tse-Dinh, and S. W. Fesik. 1996. Backbone dynamics of the C-terminal domain of Escherichia coli topoisomerase I in the absence and presence of single-stranded DNA. Biochemistry. 35:9661–9666. [DOI] [PubMed] [Google Scholar]
- 50.Breyer, W. A., and B. W. Matthews. 2001. A structural basis for processivity. Protein Sci. 10:1699–1711. [DOI] [PMC free article] [PubMed] [Google Scholar]
Associated Data
This section collects any data citations, data availability statements, or supplementary materials included in this article.