Abstract
Diffusion plays an important role in the transport of nutrients and signaling molecules in cartilaginous tissues. Diffusion coefficients can be measured by fluorescence recovery after photobleaching (FRAP). Available methods to analyze FRAP data, however, assume homogeneity in the environment of the bleached area and neglect geometrical restrictions to diffusion. Hence, diffusion coefficients in inhomogeneous materials, such as most biological tissues, cannot be assessed accurately. In this study, a new method for analyzing data from FRAP measurements has been developed, which is applicable to inhomogeneous tissues. It is based on a fitting procedure of the intensity recovery after photobleaching with a two-dimensional finite element analysis, which includes Fick's law for diffusion. The finite element analysis can account for distinctive diffusivity in predefined zones, which allows determining diffusion coefficients in inhomogeneous samples. The method is validated theoretically and experimentally in both homogeneous and inhomogeneous tissues and subsequently applied to the proliferation zone of the growth plate. Finally, the importance of accounting for inhomogeneities, for appropriate assessment of diffusivity in inhomogeneous tissues, is illustrated.
INTRODUCTION
The functioning of biological tissues in general and of unperfused tissues, such as cartilage, in particular relies on transport of nutrients and waste products. Also, tissue development and adaptation is controlled by signaling molecules, many of which are expressed at different locations than where they have their effect. Appropriate tissue development relies on transport of such molecules. An example of a tissue in which this is obviously important is the growth plate, which is controlled by a well-known feedback mechanism of secreted growth factors (1,2). Diffusion, characterized by the diffusion coefficient (D), is believed to be the primary mode of molecular transport in unperfused tissues.
Transport properties of large solutes in cartilaginous tissues have been determined in various ways at the tissue scale (3–7). A frequently used tool to determine D at a microscopic level is fluorescence recovery after photobleaching (FRAP). Recovery of fluorescence intensity after local bleaching of fluorescent molecules represents the average diffusion behavior of that particle at the location of bleaching. It is important to note that the recovery profile is not only determined by the diffusivity in the bleached area but also by the environment. Methods developed to perform FRAP measurements can roughly be classified as those that bleach spots or lines, without considering spatial information (e.g., Axelrod et al. (8)), and those that acquire two-dimensional images in time after photobleaching. These video photobleaching methods show the spatial fluorescence recovery in the bleached area and its environment. They have been used in gels (9), in explants at the tissue level (e.g., Leddy and Guilak (10)), in cells (e.g., Nehls (11)), and even in vivo (12).
Several methods are available to analyze FRAP data, each with its own characteristics (for review, see Carrero et al. (13)). The method to use depends on the data that are aimed for and the tissue which is being probed. Probably the most flexible method currently used is by spatial Fourier analysis of a sequence of FRAP images (14–16). With this method, anisotropic diffusion, flow, matrix binding, and diffusivity in multiple components of a gel can be evaluated, whereas the evaluation is independent on the geometry of the bleached area.
All methods, however, require D of the environmental tissue to resemble that of the area of interest. This prerequisite is not met when the region that is affected by bleaching contains distinct areas. The solution to such cases is either to perform the FRAP experiment at a smaller length scale, at which the undesired areas are far away from the bleached area, or to take the inhomogeneities into account during the analysis. For technological, scientific, or tissue-specific reasons, the first solution may sometimes not be applicable. For example, since the cut surface of explants is damaged per definition, diffusion measurements need to be performed inside the tissue. Deeper tissue penetration is possible at lower magnification. However, at low magnification, the typical columnar organization of chondrocytes in the proliferation zone of the growth plate makes it difficult to assess D in the extracellular matrix between the columns of cells, without having to account for the presence of the cells themselves. In such cases, accounting for inhomogeneities is obligatory.
Obviously, inhomogeneities exist at all length scales, and therefore the same considerations always apply. A general statement is that the scale must be chosen such that inhomogeneities in the tissue of interest (e.g., extracellular matrix) can be considered homogeneous, whereas inhomogeneities that are not part of the tissue of interest (e.g., cells) should not significantly affect the measurement or should be taken into consideration.
The aim of this study was to develop a method for analyzing FRAP data which takes inhomogeneities into account hence is suitable to determine D in inhomogeneous tissues. In this article, the method will be explained, validated using a theoretical and an experimental approach, and applied to the growth plate.
METHOD
The method involves fitting of the intensity recovery profile as determined in a FRAP experiment with the one obtained from a two-dimensional simulation of the experiment with a finite element (FE) analysis (SEPRAN, SEPRA, Leidschendam, The Netherlands). To compute the spatial recovery profile in time (t) with a given D and concentration profile (C), Fick's law of diffusion is used in the FE analysis:
 |
(1) |
where ∇ is the Laplacian operator. For time discretization of the differential equation, the Crank-Nicholson scheme is used, which is a standard method for simple diffusion problems (17). The time step (∂t) for the FE simulations must be chosen small enough to ensure accurate results. By verifying that the solution converges as the time step is reduced, an appropriate time step can be selected that provides sufficient accuracy, without involving overly large computational times. It is, however, required that ∂t > a2/D*, where a is the size of the elements in the mesh and D* is the lowest expected value for the diffusion coefficient. The diffusion equation is evaluated in a region, described by an FE mesh. Initial conditions, boundary conditions, and material parameters such as D can be prescribed locally in the mesh.
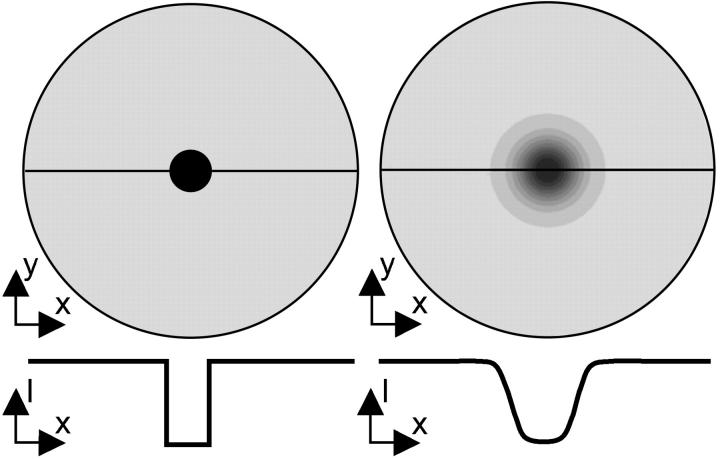
A mesh of the tissue involved in the FRAP experiment is created by defining elements in the mesh with the size of 3 × 3 pixels in the FRAP images. Inhomogeneous areas are identified in images and acquired before or after the FRAP measurement, and corresponding elements are selected in the mesh. Subsequently, the initial distributions of unbleached and bleached solute fractions need to be assigned to the mesh. During the bleaching and the (short) delay between bleaching and imaging, some diffusion already occurs. As a result, the intensity profile in the first postbleach image is blurred in comparison with the area probed by the laser during bleaching (Fig. 1). By using the intensity profile of the first postbleach image as initial condition in the evaluation, it becomes irrelevant how this intensity profile was formed. Hence, diffusion during bleaching and between bleaching and image acquisition is allowed. In practice, each postbleach image is subtracted from the average intensity distribution of five prebleach images. The intensity distribution of the first postbleach image is then copied to the mesh by assigning the average intensity value of nine pixels to the corresponding element. Since the initial profile depends on size and geometry of the bleached area, the duration of bleaching, and the time between bleaching and image acquisition, meshes are case specific. Finally, the mesh is enlarged by surrounding it with a relatively large area (S). At the outer border of this area, a constant boundary condition for the intensity (S0) is to be prescribed during the simulations. The only requirement is that the border must be far enough from the bleached area to not affect the recovery profile. To be on the safe side, the area is chosen eight times the image size. Note that fluorescence intensity is measured instead of solute concentration. It is generally assumed in similar experiments that there is a linear relation between solute concentration and fluorescence intensity (18). However, the linear concentration range should be checked for each fluorescent probe.
FIGURE 1.
Two-dimensional intensity distribution (top) and the intensity profile along the central line indicated in the top image (bottom) immediately after bleaching (left) and at t = 1 s after bleaching (right).
This study uses circular areas which are uniformly bleached. Such areas are frequently used in the literature and relatively easy to interpret. FRAP experiments are performed with fluorescein-conjugated bovine serum albumin (Molecular Probes, Eugene, OR). Albumin is an uncharged, globular molecule with a size (66 kDa) comparable to that of large proteins (e.g., MMP13 = 48 kDa; MMP9 = 78 kDa).
After creating the mesh and applying the intensity distribution, the diffusion process is simulated with the FE model. The average intensity at each time point in one or more defined regions, e.g., in the bleached area, is calculated in both the FE model and the FRAP images. The simulated recovery curve is then fitted to the experimental curve by iteratively adjusting D and S0 in the model. If different zones are considered, one D for each zone is independently adjusted. An automated fitting procedure (MATLAB, v. 6.0, The MathWorks, Natick, MA) is used with objective function, f, defined as the least square error between both recovery curves. Although not necessary, it can be useful to define one curve per distinct material if inhomogeneous areas are present. In such cases, the function value, f, is defined as the sum of the least squared errors of all curves.
The initial value of area S, which equals S0, cannot be obtained from the FRAP images because immobilized molecules could affect the final value of the recovery curve. Therefore S0, which represents the intensity recovery that comes to account for the mobile fraction of molecules only, is fitted along with D.
This method is validated theoretically and experimentally. For theoretical validation, the following procedure is used:
An FE simulation of a FRAP experiment is performed using known, prescribed D and S0 values for a mesh with two distinct zones. Bleaching is simulated by assigning intensity 0 to all elements within a circular area.
The recovery profile at t = 1 s is obtained from the simulation. The recovery curve in the bleached area, starting at t = 1 s, is used as if it were obtained from a FRAP experiment.
The fitting procedure is performed several times on these data using random values for the first estimates of D and S0.
Data from the fits are compared to the prescribed data to evaluate the accuracy of the method.
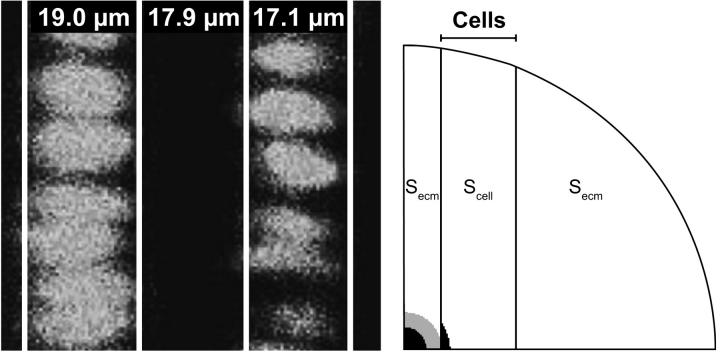
This procedure is applied to a mesh, representing the alternating columns of cells and extracellular matrix in the proliferation zone of the growth plate. These ∼18 μm wide columns are defined in the mesh as zones, with diffusion coefficients Dcell and Decm for the column with cells and with extracellular matrix, respectively (Fig. 2). For this analysis, the first estimate contains Decm, Dcell, and the value for S0 in the extracellular matrix (Secm) and in the column with cells (Scell). The bleached area is indicated by the gray ring, together with the encapsulated black area in Fig. 2, right. Intensity recovery curves from two areas, one per tissue type (black areas in Fig. 2, right), are used for curve fitting. Those areas are chosen such that they are close to the bleached area, large enough to exhibit a smooth average recovery curve, and small enough not to contain a large intensity gradient.
FIGURE 2.
(Left) Columns of cells in the proliferation zone of a porcine growth plate with their widths. (Right) Mesh with cell columns. For symmetry reasons, the displayed quarter is used during the theoretical validation. In simulations of experimental data, the complete mesh is used. The bleached area equals the gray ring together with the encapsulated black area. Secm and Scell denote the initial intensities in the areas outside the imaged area. The intensity recovery curves of the two black areas are used in the fitting algorithm.
Four data sets are used as input (Table 1). In all cases, the intensity is set to 1, whereas the intensity of the bleached area is set to zero at t = 0. This represents a normalized data set. This fully bleached condition does not have to be met in experiments. Since these simulated curves do not contain noise, the method is tested in optimal conditions. The error between the theoretical input data and the fit is indicative of the accuracy of the fitting procedure itself.
TABLE 1.
Results of the theoretical validation study
| Input data
|
Results
|
Apparent data
|
|||||||
|---|---|---|---|---|---|---|---|---|---|
| Decm(μm2/s) | Dcell(μm2/s) | Secm | Scell | Decm(μm2/s) | Dcell(μm2/s) | Secm | Scell | D(μm2/s) | S |
| 25.00 | 20.00 | 1.00 | 1.00 | 24.94 | 19.72 | 1.00 | 0.99 | 21.25 | 1.00 |
| 25.00 | 20.00 | 1.00 | 0.80 | 25.00 | 20.80 | 1.00 | 0.79 | 14.05 | 0.97 |
| 25.00 | 5.00 | 1.00 | 1.00 | 23.80 | 4.90 | 1.00 | 1.00 | 12.60 | 0.99 |
| 25.00 | 5.00 | 1.00 | 0.80 | 24.04 | 5.22 | 1.00 | 0.80 | 8.72 | 0.95 |
Input data for four theoretical situations are well predicted when accounting for the inhomogeneity. In the column with apparent data, homogeneity of the tissue is assumed, resulting in ambiguous values for D.
Experimental validation started with the notion that D is a material parameter and should be the same irrespective of the experiment by which it is obtained. Obviously, the intensity recovery distribution after photobleaching depends on the shape of the bleached area. The ultimate test for a method to be accurate is therefore to determine D at the same location in the tissue yet based on different recovery profiles. Any inaccuracies in an experimental method will result in different values for D with this validation test. This approach has been used by performing FRAP measurements with two differently sized bleached areas at the same location in a homogeneous agarose disk. The derived Ds must be identical and will be compared for validation.
Three disks (diameter 10 mm, height 3 mm) are made for the validation. Two disks contain 3% agarose (type VII, Sigma, St. Louis, MO), one contains 8% agarose. The disks are incubated in 0.75 μM albumin in phosphate-buffered saline for at least 24 h at 4°C to allow the albumin to fully permeate the constructs. Samples are equilibrated to room temperature for >20 min before testing. FRAP is performed with a confocal laser scanning microscope (LSM 510, Carl Zeiss, Jena, Germany). Photobleaching is performed with a 25 mW Argon laser at 100% laser power and 100% transmission with excitation at 488 nm. Imaging is performed with the same laser at 0.7% transmission. This low transmission value prevents bleaching during postbleach imaging. Emission is recorded between 505 and 530 nm using a 20×/0.5 NA Plan-Neofluar objective (Zeiss) and a pinhole of 424 μm, resulting in an optical slice thickness of <18 μm. This slice was chosen ∼100 μm inside the sample. One 128 × 128 pixel image was recorded per second using a zoom factor of 6, resulting in a resolution of 0.6 × 0.6 μm2/pixel. To verify that the assumption of two-dimensional diffusion is met (9), a stack of images of the bleached area is obtained after formalin fixation of albumin-loaded tissue. On a side view, the bleach-column through the sample is cylindrical, which justifies the assumption of two-dimensional diffusion.
Circular areas of 18 and 36 μm in diameter are uniformly bleached. Two measurements are performed per bleach-area size, all four at exactly the same location in the disk, separated by a 20 min recovery period. This procedure is repeated in all samples. After the experiment, the recovery curves of the bleached areas are obtained using MATLAB for curve fitting with the FE model. The intensity distribution in the first postbleach image is assigned to the FE mesh as previously explained. Meshes are case specific, containing between 2500 and 3500 elements.
Additional measurements are performed on a disk which contains 3% agarose at one side and 8% agarose at the other side. To obtain these samples, stainless steel molds (diameter 10 mm, height 3 mm) are 50% filled with 3% agarose solution. The molds are covered by glass plates and put in upright position, such that D-shaped samples result after solidifying. The remaining space is filled with 8% agarose gel. After solidification, samples are treated similarly to the previous gels.
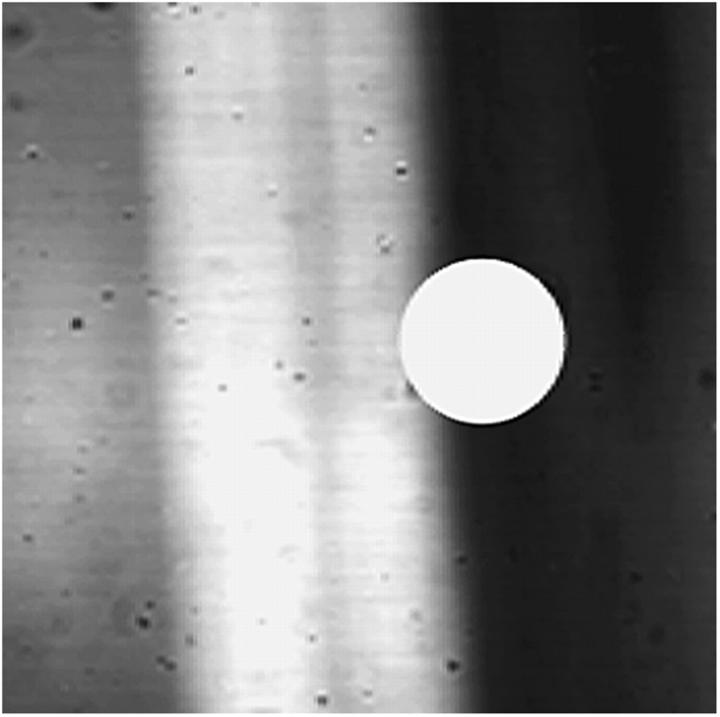
FRAP measurements (bleach diameter 36 μm) are performed close to the transition zone in both the 3% and the 8% part of the disk using previously mentioned settings. FE meshes with two distinct areas are generated, and two independent D-values and S0-values are fitted. Transmitted-light images are used to identify the two zones in the mesh (Fig. 3).
FIGURE 3.
Transition zone between the 3% and 8% agarose zones in the gel with both components is clearly visible with transmitted light (20× objective). (Left gray area) 3% agarose; (right black area) 8% agarose; (white band) projection of transition zone. The approximate size of the bleach spot is indicated in the figure as a white dot.
Finally, the method is applied to the proliferation zone of the growth plate. Columns of cells are expected to have lower apparent D than the extracellular matrix because albumin hardly penetrates cells. Explants (10 × 10 × 1 mm) of the proximal tibia growth plate with adjacent bone of ∼6-month-old pigs are made with a precision cutoff machine (Accutom5, Struers, Westlake, OH). The slices are washed three times with phosphate-buffered saline and incubated in 0.75 μM albumin for 24 h at 4°C. Samples are allowed to equilibrate to room temperature for 20 min before testing. Autofluorescence (25 mW argon laser, 100% laser power, 0.7% transmission, excitation 488 nm, emission >505nm) is used to identify the cell columns. FRAP is performed similar to the agarose samples using a bleach diameter of 36 μm. The bleached area is in between two cell columns (Fig. 2). FRAP data are treated as described, using recovery curves in the regions indicated by black areas in Fig. 3 for the fitting procedure.
RESULTS
In the theoretical validation, the fitted values for Decm, Dcell, Secm, and Scell correspond well to the prescribed values (Table 1). If the tissue is considered homogeneous, the fitted apparent D differs significantly from Decm, even though bleaching is performed completely in the extracellular matrix (Table 1).
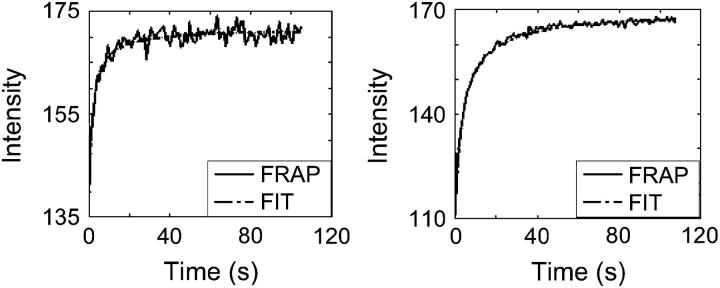
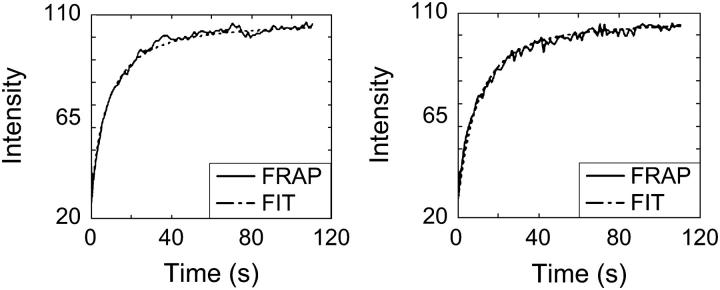
The fitted recovery curves resemble the experimental data very well in the agarose disks (Fig. 4). Even though the recovery curve of the small bleached area is noisy, due to the smaller number of pixels in the bleached area (Fig. 4), the obtained values for D are very similar between bleached areas in the same sample (Table 2). Ratios between Ds as determined with a small and a large bleached area are 0.99, 0.98, and 0.92 for the three disks, respectively (Table 2). The coefficients of variation, calculated as the SD of D divided by the mean D, were 0.04, 0.02, and 0.11.
FIGURE 4.
Examples of recovery curves of FRAP measurements with (left) small and (right) large bleached areas in agarose. The fitted curves are plotted over the experimental curves. Although the curves are different, the obtained D is similar for these measurements (Table 2).
TABLE 2.
Diffusion coefficients in homogeneous 3% and 8% agarose disks
| Diameter bleached area (μm) | 3% agarose disk 1 | 3% agarose disk 2 | 8% agarose disk |
|---|---|---|---|
| 18 | 38.3 μm2/s | 41.0 μm2/s | 13.7 μm2/s |
| 18 | 36.5 μm2/s | 42.1 μm2/s | 17.7 μm2/s |
| 36 | 35.5 μm2/s | 41.3 μm2/s | 16.9 μm2/s |
| 36 | 38.8 μm2/s | 40.2 μm2/s | 17.4 μm2/s |
| Mean ± SD | 37.3 ± 1.5 μm2/s | 41.1 ± 0.8 μm2/s | 16.4 ± 1.8 μm2/s |
The method computes identical values for D, based on recovery of intensity after bleaching small and large bleached area diameters (see also Fig. 4).
The Ds obtained in the combined 3%–8% agarose disk are well within the range of those obtained in the homogenous 3% and 8% agarose samples, even when the measurement was performed in the other half of the sample (Table 3). As in the theoretical example, omitting inhomogeneity results in an apparent D value, which is in between the values for the 3% and 8% parts.
TABLE 3.
Results of FRAP analyses in disks, constituting both 3% and 8% agarose
| D (3% agarose) | D (8% agarose) | D (apparent) | |
|---|---|---|---|
| Measurement in 3% agarose | 35.7 ± 1.8 μm2/s | 21.3 ± 1.9 μm2/s | 31.0 ± 0.8 μm2/s |
| Measurement in 8% agarose | 34.3 ± 2.5 μm2/s | 19.1 + 2.1 μm2/s | 26.2 ± 2.8 μm2/s |
Data are averages over three measurements. The values for D in 3% and 8% agarose are derived from an FE simulation, which contains two different zones. The apparent D is obtained when homogeneity is assumed.
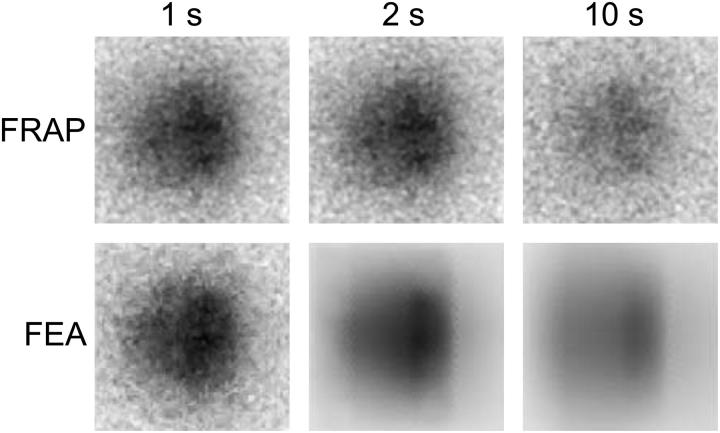
In the growth plate measurements, the fitted curves resemble the experimental data very well (Fig. 5). Fig. 6 shows images of the experimental and fitted intensity profiles at t = 1, t = 2, and t = 10 s after photobleaching. Obtained values for Decm and Dcell are 49.22 and 3.87 μm2/s, respectively. When inhomogeneities are not taken into account, the apparent D equals 19.75 μm2/s.
FIGURE 5.
Recovery curves of FRAP experiments in the growth plate, together with the fitted curves. (Left) Curves in column with extracellular matrix; Decm = 49 μm2/s. (Right) Curves in column with cells; Dcell = 3.87 μm2/s.
FIGURE 6.
(Top row) Measured intensity distribution at t = 1, t = 2, and t = 10 s after photobleaching in the growth plate. The t = 1 image is the first postbleach image, which is copied to the FE mesh (bottom left image). In the course of the simulation (bottom row), the noise disappears. The images in columns 2 and 3 are the results after fitting the data of this experiment. Associated fitted curves are shown in Fig. 5.
DISCUSSION
The aim of this study is to develop a method to determine D in inhomogeneous tissues, with inhomogeneities being defined as zones with different apparent diffusion coefficients, which cannot be considered homogenous at the length scale at which the measurement is performed and which are not intended to be part of the measurement. Accurate measurement of D in this particular situation is not possible with currently available methods.
In this method, FE simulations are used to fit recovery profiles of FRAP data. Different Ds for distinct, predefined zones are obtained. The method was validated with theoretical and experimental data from homogeneous and inhomogeneous agarose disks. Finally, the method was applied to inhomogeneous growth plate tissue.
It was demonstrated that omitting inhomogeneity results in an apparent D, determined by the properties of both materials, even though the bleached area may be chosen such that it is completely within one of them. Hence, to determine D of the bleached tissue only, relevant inhomogeneities need to be taken into account. Initial input values in the theoretical validation affected the results up to 3%, predictions being better when first estimates were more accurate, yet on the low side. These variations are in the same range as the SDs of the experimental data. All these deviations are small compared to the result of omitting inhomogeneities. Also, with these SDs, the differences between D values for different tissue types in the 3%–8% agarose gel and in the growth plate are highly significant.
The D of albumin in 3% (37 and 41 μm2/s) and 8% agarose (16 μm2/s) agree very well with the data of Kosto and Deen (16), who found for albumin 32 μm2/s in 4% and 19 μm2/s in 8% agarose. Using holographic laser interferometry, D of albumin was 30 μm2/s in 3% agarose (5).
Ds obtained from the 3%–8% agarose gel are comparable to the values determined in the homogeneous samples and significantly better than the apparent D (Table 3). However, D for 3% agarose seems at the low end, and D for 8% agarose is at the high side of the expected values. Most likely, some mixing between the 3% and 8% gel occurred in the transition zone during construction of the samples. Alternatively, the boundary between both gels might not have been identified accurately enough. The transmitted-light images contain a projection of the boundary throughout the height of the sample (Fig. 3). Determining the boundary location at the exact 18 μm slice of the measurement in this combined agarose disk is difficult. However, wrong estimation of the interface would theoretically have resulted in just one of the two Ds being wrong, rather than both of them.
There are no data available for D in the growth plate. At best, D for 66 kDa albumin in the extracellular matrix of the proliferation zone (49 μm2/s) can be compared with D obtained for articular cartilage using 70 kDa radiolabeled dextran (40 μm2/s (4)) and 70 kDa fluorescein-conjugated dextran (31 μm2/s (10)).
With this method, diffusion between the start of bleaching and imaging is accounted for by using the first recovery image as the initial condition in FE simulations. Thus, there are no limitations to the bleach geometry or the location of bleaching. A limitation of some other video-FRAP methods, including the one based on Fourier analysis, is that the average intensity in the postbleach images is not allowed to change with time (14). This limitation originates from the requirement that the boundary of the image must have a constant intensity value. In practice, this means that a large area, relative to the bleached area, is to be imaged. This decreases the amount of signal in the images. The same requirement of constant boundary intensity applies to this method, but this condition is met in the FE analysis, rather than in the experiment, by enlarging the surrounding area in the mesh. The average intensity of the images is allowed to change during the measurements. In practice, this means that the bleached area typically constitutes a large part of the acquired images to enhance the signal. Note that the lower limit to the physical size of the bleached area is defined by the point-spread function. This needs to be considered if small bleached areas are used. In this study, however, the bleached area was considerably larger than the point-spread function.
It is important to note that each of the defined zones might be inhomogeneous by itself, whereas they are considered homogeneous in FE simulations. For instance, the column of cells in the growth plate example contains extracellular matrix as well as cells, and the column of extracellular matrix contains different constituents at a smaller length scale. Therefore, Decm and Dcell are apparent Ds indeed. The effect is nicely illustrated when considering the fact that albumin hardly penetrates cells. Most likely, Dcell is the result of diffusion in between the cells, rather than in the cells themselves. Yet, although Dcell is not accurate for albumin diffusion through cells, omitting the presence of the cells would have resulted in strong underestimation of Decm (Table 1). Thus, Dcell can be considered a side product of the assessment of Decm.
The above consideration is of interest when discussing the most obvious disadvantage of the method, which is that inhomogeneities must be identified beforehand. Since imaging is essentially part of the method, visualization of inhomogeneities will generally be possible. In case of difficulties to accurately identify zones, one could consider narrowing the zone of interest such that it surely excludes the inhomogeneities at the expense of a more disperse constitution of the other zone. Consequently, the D of interest will be accurate, whereas the D in the other zone is less precise.
In the extracellular matrix of the growth plate, diffusion might be anisotropic due to alignment of matrix components. It is well possible to account for anisotropy with this method at the expense of one additional parameter to fit. In fact, D is already determined in both directions, but the values are forced equal in this study. Note that other methods can deal with anisotropy as well (e.g., Tsay and Jacobson (14)).
It is possible that a fraction of the fluorescent molecules is immobile. This is inherently accounted for by fitting the initial value of the surrounding area S, which represents the intensity that comes for the account of the mobile molecules only. A drawback is that S cannot be derived from the prebleach images but needs to be fitted along with the diffusion coefficient. Also, the immobile fraction of molecules is not directly obtained.
Summarizing, this method for analyzing FRAP data can be applied to both homogeneous and inhomogeneous tissues. Other methods might be easier to use in homogeneous or anisotropic tissues. This method, however, is the only one which is applicable to inhomogeneous tissues. It is a very flexible method, providing ample possibilities to assess Ds in complex materials, such as many biological tissues. Such data are essential to study diffusion related phenomena, such as nutrition and paracrine signaling in cartilaginous tissues.
References
- 1.Kronenberg, H. M. 2003. Developmental regulation of the growth plate. Nature. 423:332–336. [DOI] [PubMed] [Google Scholar]
- 2.Ortega, N., D. J. Behonick, and Z. Werb. 2004. Matrix remodeling during endochondral ossification. Trends Cell Biol. 14:86–93. [DOI] [PMC free article] [PubMed] [Google Scholar]
- 3.Garcia, A. M., E. H. Frank, P. E. Grimshaw, and A. J. Grodzinsky. 1996. Contributions of fluid convection and electrical migration to transport in cartilage: relevance to loading. Arch. Biochem. Biophys. 333:317–325. [DOI] [PubMed] [Google Scholar]
- 4.Torzilli, P. A., J. M. Arduino, J. D. Gregory, and M. Bansal. 1997. Effect of proteoglycan removal on solute mobility in articular cartilage. J. Biomech. 30:895–902. [DOI] [PubMed] [Google Scholar]
- 5.Roger, P., C. Mattisson, A. Axelsson, and G. Zacchi. 2000. Use of holographic laser interferometry to study the diffusion of polymers in gels. Biotechnol. Bioeng. 69:654–663. [DOI] [PubMed] [Google Scholar]
- 6.Quinn, T. M., V. Morel, and J. J. Meister. 2001. Static compression of articular cartilage can reduce solute diffusivity and partitioning: implications for the chondrocyte biological response. J. Biomech. 34:1463–1469. [DOI] [PubMed] [Google Scholar]
- 7.Nimer, E., R. Schneiderman, and A. Maroudas. 2003. Diffusion and partition of solutes in cartilage under static load. Biophys. Chem. 106:125–146. [DOI] [PubMed] [Google Scholar]
- 8.Axelrod, D., D. E. Koppel, J. Schlessinger, E. Elson, and W. W. Webb. 1976. Mobility measurement by analysis of fluorescence photobleaching recovery kinetics. Biophys. J. 16:1055–1069. [DOI] [PMC free article] [PubMed] [Google Scholar]
- 9.Braeckmans, K., L. Peeters, N. N. Sanders, S. C. De Smedt, and J. Demeester. 2003. Three-dimensional fluorescence recovery after photobleaching with the confocal scanning laser microscope. Biophys. J. 85:2240–2252. [DOI] [PMC free article] [PubMed] [Google Scholar]
- 10.Leddy, H. A., and F. Guilak. 2003. Site-specific molecular diffusion in articular cartilage measured using fluorescence recovery after photobleaching. Ann. Biomed. Eng. 31:753–760. [DOI] [PubMed] [Google Scholar]
- 11.Nehls, S., E. L. Snapp, N. B. Cole, K. J. M. Zaal, A. K. Kenworthy, T. H. Roberts, J. Ellenberg, J. F. Presley, E. Siggia, and J. Lippincott-Schwartz. 2000. Dynamics and retention of misfolded proteins in native ER membranes. Nat. Cell Biol. 2:288–295. [DOI] [PubMed] [Google Scholar]
- 12.Berk, D. A., F. Yuan, M. Leunig, and R. K. Jain. 1997. Direct in vivo measurement of targeted binding in a human tumor xenograft. Proc. Natl. Acad. Sci. USA. 94:1785–1790. [DOI] [PMC free article] [PubMed] [Google Scholar]
- 13.Carrero, G., D. McDonald, E. Crawford, G. de Vries, and M. J. Hendzel. 2003. Using FRAP and mathematical modeling to determine the in vivo kinetics of nuclear proteins. Methods. 29:14–28. [DOI] [PubMed] [Google Scholar]
- 14.Tsay, T., and K. A. Jacobson. 1991. Spatial Fourier analysis of video photobleaching measurements. Principles and optimization. Biophys. J. 60:360–368. [DOI] [PMC free article] [PubMed] [Google Scholar]
- 15.Berk, D. A., F. Yuan, M. Leunig, and R. K. Jain. 1993. Fluorescence photobleaching with spatial Fourier analysis: measurement of diffusion in light-scattering media. Biophys. J. 65:2428–2436. [DOI] [PMC free article] [PubMed] [Google Scholar]
- 16.Kosto, K. B., and W. M. Deen. 2004. Diffusivities of macromolecules in composite hydrogels. AIChE J. 50:2648–2658. [Google Scholar]
- 17.Press, W. H., S. A. Teukolsky, W. T. Vetterling, and B. P. Flannery. 1994. Numerical Recipes in FORTRAN 77: the Art of Scientific Computing. Cambridge University Press, Cambridge.
- 18.Quinn, T. M., C. Studer, A. J. Grodzinsky, and J. J. Meister. 2002. Preservation and analysis of nonequilibrium solute concentration distributions within mechanically compressed cartilage explants. J. Biochem. Biophys. Methods. 52:83–95. [DOI] [PubMed] [Google Scholar]


