

Abstract
A technique has been developed to measure absolute intracellular oxygen concentrations in green plants. Oxygen-sensitive phosphorescent microbeads were injected into the cells and an optical multifrequency phase-modulation technique was used to discriminate the sensor signal from the strong autofluorescence of the plant tissue. The method was established using photosynthesis-competent cells of the giant algae Chara corallina L., and was validated by application to various cell types of other plant species.
INTRODUCTION
Unlike animals, plants do not possess an efficient distribution system for the supply of oxygen to their tissues. Therefore the internal oxygen concentration depends strongly on the cellular oxygen consumption, mainly via respiration, as well as on the endogenous oxygen production in green tissues by photosynthesis. To avoid oxygen decreasing to too low concentrations, plant cells posses a variety of adaptive physiological responses to fine-tune oxygen consumption to the actual oxygen availability. When the internal oxygen concentration decreases, energy-consuming metabolic pathways such as storage product biosynthesis (starch, protein, lipids) are inhibited, and glycolysis and respiratory rates are reduced (1–4). Where possible, plant metabolism switches to less-energy-consuming metabolic pathways that use oxygen more efficiently (5). These adaptive responses allow oxygen consumption to be decreased (6). Finally, long-term morphological changes are induced, such as the formation of lenticels and aerenchyma to improve the oxygen permeability of the tissue (7).
A prerequisite for these adaptive responses is the existence of a mechanism by which the internal oxygen status is being sensed. Unfortunately, knowledge on the molecular mechanisms underlying the regulation of the cellular oxygen status is limited (8–10). A major bottleneck for this research is that the techniques currently available for measuring oxygen do not permit intracellular measurements in plants. The only technique that allows oxygen measurements at a high spatial resolution is a handmade Clark-type oxygen electrode, adapted to a glass needle with a diameter between 5 and 20 μm (11,12). However, this method measures relative oxygen levels rather than absolute intracellular oxygen concentrations. Furthermore, the constant consumption of oxygen by the electrode affects the internal oxygen concentration of the cell, which is unfavorable when the adaptive mechanisms that regulate the internal oxygen status are under investigation.
In animal cells, oxygen has been measured using miniature beads consisting of phosphorescent sensor molecules entrapped in a matrix, so-called optical probes encapsulated by biologically localized embedding (PEBBLEs), which exhibit an oxygen-dependent red phosphorescent signal (13–18). Unfortunately, this technique cannot be readily adopted for application in plant cells because of interference by the strong autofluorescence of plant cells in the spectral range of the sensor signal.
In this article, a method is presented to discriminate between the oxygen-dependent phosphorescence signal of Pt(II)-tetra-pentafluorophenyl-porphyrin (PtPFPP; 18–20) encapsulated in polystyrene microbeads, and the strong autofluorescence of plant cells. Using different modulation frequencies to excite the oxygen probe allows the separation of sensor phosphorescence and cell autofluorescence, which mainly arises from chlorophyll. The method is based on the large differences in the respective lifetimes. Chlorophyll shows lifetimes in the sub-10-ns range, which is negligibly small in comparison to the microseconds' lifetime of PtPFPP. Injecting the probe beads into photosynthetically active cells enabled the measurement of absolute intracellular oxygen concentrations in real-time. The method has been established using cells of the green alga Chara corallina, which is a well-characterized plant model species for microinjection studies.
THEORETICAL BACKGROUND
The sensing of oxygen with phosphorescent probes is based on luminescence quenching (21). Energy transfer from the probe dye triplet state to oxygen leads to a decrease in phosphorescence intensity as well as lifetime. Unfortunately, the phosphorescent light that is emitted by oxygen-sensitive probes has a spectrum that is very similar to that of the autofluorescence of plant tissue. Here, we describe a technique to differentiate between luminescent lifetime of fluorescence and phosphorescence by using a two-frequency phase-modulation technique, which enables precise determination of changes in phosphorescent lifetime due to oxygen-induced quenching of the signal. As a catch-all for both fluorescent and phosphorescent emission we use the word luminescence throughout the text.
The relation of luminescence lifetime and quencher concentration is described by an adapted Stern-Volmer equation (22),
 |
(1) |
where τ0 and τ are luminescence lifetimes in the absence and the presence of a quencher; KSV is the quenching constant; [Q] is the quencher concentration; and x is the quenchable fraction of the dye molecules. Due to matrix effects of the microbeads in which the sensor dye is encapsulated, only a fraction x of the dye molecules can interact with oxygen. The remaining fraction 1 − x is not significantly quenched.
If a luminophore is excited with sinusoidal modulated light, the luminescence lifetime can be determined by measuring the phase shift between the excitation and the luminescence light. Emission of a luminescent signal does not occur simultaneously with excitation, but is delayed depending on the lifetime of the excited state of the molecule. The size of the phase shift Φ is given by
 |
(2) |
where ω is the angular frequency of the sinusoidal modulation (21–24). It is important to mention that Eq. 2 only allows the evaluation of the sensor's phosphorescence lifetime when no sinusoidal signals, other than the sensor signal itself, are detected. In the presence of any additional sinusoidal signal (e.g., autofluorescence of green plant tissue) individual signals will superpose and a summed signal with an apparent phase shift Φapp is detected. In such cases, an apparent lifetime τapp will yield from Eq. 2, instead of the actual sensor lifetime τ.
In contrast to the actual lifetime, the apparent lifetime depends on the modulation frequency. This allows the determination of an actual sensor lifetime by measuring apparent lifetimes at different frequencies. In the presence of two signals, the dependency of τapp on the modulation frequency ω and on the respective lifetimes of the signal sources τ1, τ2 can be described by (24,25)
 |
(3) |
The values I1 and I2 are the steady-state intensities of signals 1 and 2, respectively. Luminescence intensities depend on the modulation frequency of the excitation light (23). A steady-state intensity denotes the luminescence intensity, which is generated if a luminophore is excited with unmodulated continuous wave light. Considering signal 1 originating from a phosphorescent oxygen-sensitive dye, and signal 2 from autofluorescent green plant tissue, then τ2 can be assumed to be zero due to its very short lifetime (a few nanoseconds only) as compared to τ1, which is in the range of microseconds.
The steady-state intensity ratio I1:I2 of phosphorescence and autofluorescence is independent from the modulation frequency. For a measurement carried out at two different modulation frequencies, Eq. 4 can be derived from Eq. 3:
 |
(4) |
Measuring the apparent phase shifts Φapp,ω and Φapp,ψ at two modulation frequencies ω and ψ allows the calculation of the respective apparent lifetimes as τapp,ω and τapp,ψ by using Eq. 2. Solving Eq. 4 then results in the oxygen-dependent sensor lifetime τ1. The actual oxygen concentration is calculated by inserting τ1 into Eq. 1.
MATERIALS AND METHODS
Preparation of the microbeads
The oxygen-sensitive probe Pt(II)-tetra-pentafluorphenyl-porphyrin (PtPFPP) was encapsulated in carboxylated microbeads of polystyrene. The hydrophobic and inert nature of polystyrene causes negligible cross-sensitivity and is therefore compatible with living cells. PtPFPP was chosen because of its high photochemical stability (19) and its complete insolubility in water, which prevents leaching from the beads into the cell. The polystyrene microbeads were stained using a procedure of Singer and Haugland (26). In brief, 150 mg of microbeads (surface-carboxylated), dispersed in 5 ml of a water/methanol mixture (50% v/v), was vigorously stirred. Subsequently, 3 mg of PtPFPP, dissolved in 0.5 ml of dichloromethane, was added slowly to the stirred microbead suspension using a syringe pump (0.1 ml/min). After addition was complete the suspension was filtered through glass wool and dialyzed. A dialysis tube with a cutoff of ∼15,000 was used. After dialysis the residue was sonicated and ready for use. The resulting beads had a mean diameter of 300 nm, but because of aggregation, clusters of up to 1 μm could be formed.
Before use, the beads (30 μl of a 10% (w/w) aqueous suspension) were incubated for 10 min in a 1.5 mg ml−1 aqueous protein solution (bovine serum albumin, fraction V, Roth, Karlsruhe, Germany). Subsequently, the microbeads were centrifuged for 5 min at 14,000 rpm and carefully washed in H2O. Finally, the pellet was taken up in 300 μl water and sonicated for 1 h.
Calibration and cross-reactivity tests
The beads were suspended in aqueous test solutions or in cell extract as indicated. For calibration, suspensions were aerated with premixed gas (Messer-Griesheim GmbH, Düsseldorf, Germany) containing various oxygen concentrations (0, 5, 19, 38, 57, 100, 143, 191, and 287% air saturation of oxygen; 350 ppm CO2 supplemented with nitrogen; 100% air saturation of oxygen corresponds to 21% volume content). The phosphorescence lifetimes at the various oxygen concentrations were determined as described below. Unless stated otherwise, measurements were performed at 23°C. Cell sap was collected by grinding tissue in an ice-cooled mortar. Insoluble cell material was removed by centrifugation. To check the oxygen-sensor beads for cross-reactivity, the lifetime values yielded in test solutions were compared with the values measured in pure water.
Microinjection of the microbeads
Side branches of the algae Chara corallina were placed in a petri dish containing Chara pond water (27) supplemented with 100 mM mannitol to reduce cell turgor. The sensor beads were injected into a cell of the branch using a glass needle (Fig. 1). These borosilicate glass microcapillaries (M1B150-3, WPI, Berlin, Germany) were pulled with a vertical 3P-A Patch Pipette Puller (List-Medical, Darmstadt, Germany). Positioning of the microcapillaries and injection into the cells (presumably in the major vacuole of the cell) was performed using an Eppendorf micromanipulator (5171, Eppendorf, Wesseling-Berzdorf, Germany) that was connected to an Optiphot-2 epifluorescence microscope (Nikon, Tokyo, Japan). Injection of the aqueous microbeads suspension took <30 min using a Pneumatic Pico Pump (PV830, WPI, Berlin, Germany) with air pressure of ∼40 psi. The progress of the injection was controlled by observing a constant influx of the beads which resulted in increasing phosphorescence of the cell.
FIGURE 1.

Microinjection of the microbeads in a Chara cell (CC) using a glass microcapillary (M). The scale bar represents 500 μm.
Injection into cells from orange fruit or leaves from eight-week-old Arabidopsis thaliana plants was essentially the same as described above, except that no mannitol was added to the medium.
Measuring setup
As excitation source, a cyan LED lamp (Luxeon Star, Lumileds Lighting, San Jose, CA; wavelength peak at 505 nm) with a convex lens and green bandpass filter (540 ± 30 nm full-width at half-maximum) was positioned under the petri dish. To collect the signal, a glass fiber (200/230 μm hard-clad silica) was positioned at the cell surface using a micromanipulator. The light was guided to a collimator (Edmund Optics, Barrington, NJ) and after passing a 532-nm longpass and a 650-nm bandpass filter, the signal was detected using a red-sensitive photomultiplier tube (Hamamatsu R955, Hamamatsu City, Japan). The current of the photomultiplier was converted into voltage by a preamplifier (Femto DLPCA-200, Berlin, Germany). The phase shift of the signal was measured by a digital lock-in amplifier (Stanford Research SR830, Sunnyvale, CA), which simultaneously served as a sinusoidal frequency synthesizer for the custom-built driver circuit of the green excitation LED. Control of the lock-in amplifier and data evaluation was done on a PC, using Microsoft Visual Basic 6.0. A blue LED (Luxeon Star, Lumileds Lighting, San Jose, CA; wavelength peak at 455 nm) with a blue 510-nm shortpass filter was used as a nonmodulated light source to stimulate photosynthesis. Fig. 2 shows a schematic diagram of the experimental setup.
FIGURE 2.

Measurement setup: the built-in sinusoidal frequency generator of the lock-amplifier drives a cyan LED, which illuminates the sensor-containing cell. An optical glass fiber collects the sensor light and guides it to a photo multiplier. Optical filters minimize the excitation light intensity. A preamplifier converts the current signal into a voltage. Comparing the signals of detector and sinusoidal frequency generator, the lock-in amplifier evaluates the phase shift. A PC converts the phase shift into an oxygen concentration. The blue LED is used to stimulate photosynthesis.
Measurement procedure
A solution of eosin, dissolved in ethanol, which does not cause any detectable phase shift at modulation frequencies in the kHz range, was used to set zero on the apparatus; τeosin = 3.1 ns (24). For the subsequent oxygen measurement, the optical fiber was aligned at the surface of an injected Chara corallina cell, until a position with a maximum sensor signal was found. An optimal position is indicated by a maximum apparent phase shift displayed at the lock-in amplifier. The apparent phase shifts at 4- and 6-kHz modulation frequencies were determined successively. After the lock-in amplifier turned into the chosen frequency, the respective phase shift was read every 0.5 s for a time interval of 8 s and then averaged. Afterwards, the signal/background ratio (I1:I2) and the corresponding actual sensor lifetime τ1 were evaluated by the software by using Eqs. 3 and 4. The corresponding oxygen content was determined by using the calibration curve (Fig. 4 A). Depending on the signal intensities, this method needs up to 1 min, which is long for real-time measurements. To allow a much faster monitoring, the following procedure was developed: At an arbitrary oxygen content c0, the sensor lifetime τ1,c0 and the corresponding ratio (I1,c0:I2) were determined at the beginning of a measurement as described above. If the luminescence lifetime of a molecule is changed by a quencher, the ratio of the steady-state luminescence intensities corresponds to the ratio of the respective lifetimes (28):
 |
(5) |
FIGURE 4.

(A) Correlation of sensor phosphorescence lifetime and oxygen content. Albumin-preincubated PtPFPP microbeads were suspended in desalted water at 23°C and aerated with various oxygen concentrations. The plotted lifetimes are average values of four single measurements. The reproducibility of a single measurement was in the range of ±1 μs. The adapted Stern-Volmer equation Eq. 1 was fitted to the data for x = 0.75 (black line). The inset shows the temperature dependency of the sensor's phosphorescence lifetime determined at 100% air saturation oxygen content. (B) Measurements in Chara corallina cell sap yielded the same lifetimes as in desalted water. The number within the circles show the corresponding oxygen content (% air saturation) at which the phosphorescence lifetime was determined.
Multiplying equation Eq. 5 with 1 / I2 yields
 |
(6) |
If the intensity of background caused by autofluorescence I2 is assumed to be independent of the oxygen concentration, the combination of Eqs. 3 and 6 allows τ1 to be calculated from τapp, ω as measured at one single modulation frequency ω, only. Subsequently, this real-time monitoring was done at 6 kHz. The apparent phase shift was read every 0.5 s and τ1 and the corresponding oxygen concentration were calculated using the calibration curve shown in Fig. 4 A.
RESULTS AND DISCUSSION
For measuring the intracellular oxygen concentrations in photosynthetically active plant cells, oxygen-sensitive PtPFPP dye encapsulated in microbeads was injected into green cells. Chara corallina was used as the test species for characterization of the probe, since cells of this green alga have been widely used for various microinjection studies (29–32). Within the plant kingdom, Chara belongs to the closest relatives of the land plants, with photosynthetic apparatus, storage products, and cell wall components in common (33,34).
As for all plant species, the spectral composition of the emission of autofluorescent light of Chara chlorophyll is similar to the signal of the PtPFPP beads (Fig. 3), preventing background elimination using optical filters. Therefore, we developed a multifrequency phase-modulation technique, which uses the phase shift of the luminescent signal as a measure of the oxygen concentration. Measuring at two different frequencies allows an evaluation of the phase shift of the sensor signal, even if there is a complete spectral overlap with autofluorescence. Compared to ratiometric methods, where the intensity ratio of the signals of the sensor and a nonquenchable reference dye is determined (16,17), measuring the phase shift exhibits a further crucial advantage in that the phase shift of the sensor signal is independent of the sensor concentration. As a result, no reference dye and, therefore, no spectral discrimination within the photodetector setup is required. As compared to time-resolved measurements, at which the sample is excited with a pulse of light and the time-dependent intensity of light emission following the excitation pulse is detected repetitively (24,28), the phase-modulation technique is much faster. When long-lifetime phosphorescence decay curves are recorded, the pulse repetition rate is limited, increasing the time for one single measurement cycle. Especially when the signal intensity is weak, the cycle has to be repeated very often, which will result in overall measurement times of many seconds or even minutes, preventing real-time monitoring.
FIGURE 3.
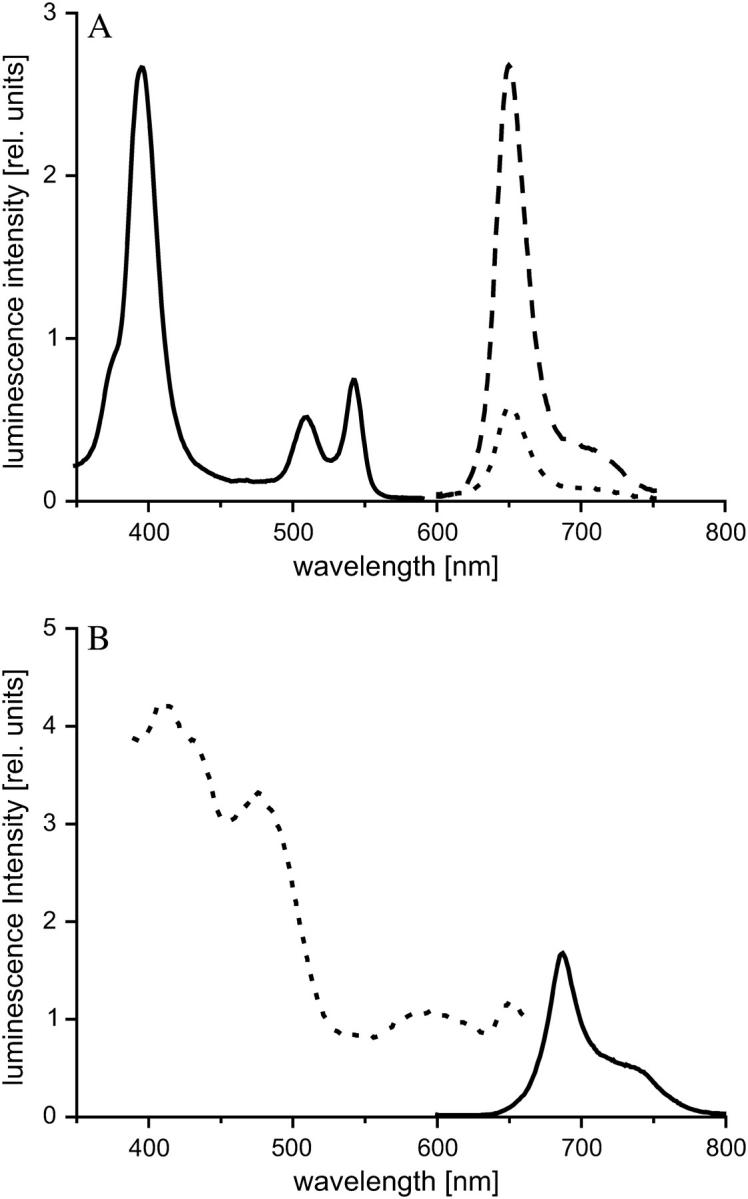
(A) Luminescence spectra of the oxygen-sensor dye PtPFPP embedded in polystyrene microbeads. (Black line, excitation curve, with emission at 650 nm; dotted line, emission curve, with excitation at 509 nm; and dashed line, emission curve, with excitation at 390 nm.) (B) Luminescence spectra of a Chara corallina cell. (Black line, emission curve, with excitation at 509 nm; and dotted line, excitation curve, with emission at 687 nm.) For the oxygen measurements, the cells were illuminated with green light (540 ± 30 nm bandpass filter is put in front of the excitation LED), which keeps the autofluorescence to a minimum.
When PtPFPP microbeads are injected into a plant cell, the apparent lifetime τapp of the luminescent signal that is measured will arise from the superposition of different signal sources. One source is the oxygen sensor with an oxygen-dependent lifetime τ1. At a given modulation frequency ω, the sensor emits a phosphorescence signal 1 with a certain phase shift Φ1. The second signal is composed of several components, all having zero lifetimes: autofluorescence of the plant cells, a fluorescent fraction of the sensor luminescence, and residual excitation light that inevitably reaches the photodetector due to the properties of optical filters. The negligibility of the nanosecond fluorescence lifetime of cell substances (35) was tested by measuring the phase shift arising from the autofluorescence signal of cells without oxygen sensor. At modulation frequencies adequate for PtPFPP, the phase shift was below the detection threshold (0.05°). Superposition of these components causes a modulated background signal 2 with Φ2 = 0, and therefore, τ2 = 0.
Based on the absorption spectra of the PtPFPP microbeads and Chara cells, modulated green light was chosen for excitation of the oxygen sensor even though the phosphorescence intensity of the sensor is weaker as compared to the excitation at its 390-nm absorption maximum (Fig. 3 A). The first reason for this is that the high energy of short wave (near-)UV radiation may cause damage to cells. Secondly, using green light within the range of 500–570 nm causes minimal autofluorescence, since the absorption spectrum of chlorophyll is lowest in this range. As a result, the ratio between sensor signal and autofluorescence is enhanced, which leads to more accurate measurements. Thirdly, green light energizes photosynthesis only very little, and thus photosynthetic oxygen production is minimal.
After illumination, PtPFPP transmits its absorbed light energy to oxygen, thereby decreasing its phosphorescence lifetime τ. Fig. 4 A shows the relation between τ and the oxygen concentration in the solution. A slight temperature dependence was observed, with higher temperatures leading to a slight decrease in phosphorescence lifetime (Fig. 4 A, inset). Several experiments were performed to test whether any other organic substance interacts with the oxygen determination. The microbeads were tested for their sensitivity to changes in pH, presence of glucose, sucrose, or protein (Fig. 5). The test series were carried out under normal oxygen conditions (100% air saturation). In the 4–8 pH range, no influence on the lifetime was observed (Fig. 5 A). Also glucose and sucrose had no influence in a concentration range from 0 to 150 mg ml−1 (Fig. 5 B). However, τ increased by several microseconds when beads were incubated in the protein albumin (Fig. 5 C). Apparently, proteins adsorb at the polystyrene surface and shield the surface-located fraction of the oxygen-sensitive phosphor in the microbead matrix, leading to an overall reduced quenching rate. This extension of the lifetime appeared to be irreversible; no decline in the sensor's lifetime was observed when beads preincubated in albumin were replaced in pure water (Fig. 5 D). Thus the passive binding of albumin is very strong. When preincubated beads were used to measure oxygen in water, the lifetimes that were obtained were identical to those measured in a protein solution and could thus be used for in vivo measurements.
FIGURE 5.

(A) Shows the phosphorescence lifetimes of the oxygen sensor at different pH values, determined at 100% oxygen air saturation, and 24°C. (B) Effect of carbohydrates, determined at 100% oxygen. Sucrose at 23°C (squares), glucose at 25°C (triangles). (C) Effect of protein concentration, determined at 100% oxygen air saturation and 24°C. (D) Illustration of the irreversibility of protein adsorption onto the microbeads. First, phosphorescence lifetime was measured using microbeads that were not pretreated with a protein incubation (1). When these microbeads were then used to measure τ in a 1.5 mg ml−1 albumin solution with the same oxygen concentration as before, the phosphorescence lifetime increased (2). Once the beads were incubated in a protein solution, the phosphorescence lifetime of the beads became independent of the protein concentration of the solution (3). Measurements were done at 57% oxygen air saturation and 24°C.
Subsequently, beads preincubated in albumin were used to compare the fluorescent lifetime in a crude cell extract of Chara, which was aerated with different oxygen concentrations. These measurements showed identical values for τ when compared with results obtained from preincubated microbeads in pure water (Fig. 4 B). Similar results were obtained when an extract from Arabidopsis thaliana leaves was used (data not shown). This shows that the signals obtained from the beads only depend on the oxygen concentration, and are not influenced by any other cell component.
Intracellular oxygen concentration
For measuring intracellular oxygen concentrations, PtPFPP microbeads were injected directly into cells using glass microcapillaries. After injection the capillary was carefully removed, and the cell was given time to recover in darkness. Subsequently, a glass fiber was positioned near the cell wall of the injected cell and luminescence was detected. Fig. 6 A shows the changes in the oxygen content in a Chara corallina cell induced by different light regimes at a constant temperature of 23°C. When the cells were only exposed to the modulated green light source used to excite the oxygen probe, the cellular oxygen concentration measured was ∼250 μmol/l, which is similar to the oxygen saturation concentration of an aqueous solution in normal air (36). When, in addition to the green light source, an LED emitting photosynthetically active blue light was directed to the cell, the oxygen concentration increased to ∼500 μmol/l. After switching off the blue light, the oxygen concentration decreased again until the ambient concentration was reached. These changes were reproducible over a period of several hours. Preliminary experiments in which Arabidopsis thaliana leaf epidermal cells were injected with PtPFPP microbeads gave similar results (data not shown). Nonphotosynthetically active orange fruit cells showed no increase in the oxygen signal upon illumination with blue light (Fig. 6 B), indicating that the blue background light intensity does not affect the measurement apparatus. Interestingly, the oxygen concentration of these cells was less than air saturation, indicating that even single cells that have very good contact with the surrounding air can have hypoxic conditions inside. These measurements show that the multifrequency phase-modulation method enables measurement of in vivo oxygen concentrations, as well as detecting real-time changes due to biochemical processes.
FIGURE 6.

Intracellular oxygen concentrations of a Chara corallina cell (A) and a cell of an orange fruit (B). In addition to the modulated green light used to excite the sensor, both cell types were temporarily exposed to unmodulated blue light to stimulate photosynthesis. In the photosynthesis competent Chara cell, the internal oxygen concentration rapidly increases when the blue light source was switched on. In the nonphotosynthetic orange cell, blue light had no effect on the internal oxygen concentration. The temperature was 23°C.
CONCLUSIONS
For the first time, quantitative real-time oxygen measurements were carried out inside living green cells. As sensor, microbeads with a quenchable phosphorescent dye were injected. Physiological changes in the absolute cellular oxygen concentration were detected by determining oxygen-dependent changes in phosphorescence lifetime of the sensor using a multifrequency phase-modulation technique, which allowed discrimination of the sensor signal and the autofluorescence of the cells despite a spectral overlap. This technical advance opens new possibilities in the current research elucidating the molecular physiology of oxygen sensing in plants as well as the functional investigations of oxygen-binding proteins such as plant hemoglobins (37). For further increase of the spatial resolution, this method can also be adopted to a microscope with a directly built-in photomultiplier. Furthermore, we believe that the described technique can also be adopted for the application of different phosphorescent sensors in the presence of strong plant autofluorescence for measuring other biologically important substances such as Cu2+ (38), Hg2+ (39), and glucose (40).
Acknowledgments
We thank Heidi Held for Chara cultivation and supply. We are grateful to Annette Niehl, Daniela Zöller, and Berit Ebert for helpful suggestions, and we acknowledge Carola Kuhn for her assistance with preliminary experiments.
This work was partly supported by the Deutsche Forschungsgemeinschaft (to P.G.).
Elmar Schmaelzlin and Joost T. van Dongen contributed equally to this work.
References
- 1.Geigenberger, P., A. R. Fernie, Y. Gibon, M. Christ, and M. Stitt. 2000. Metabolic activity decreases as an adaptive response to low internal oxygen in growing potato tubers. Biol. Chem. 381:723–740. [DOI] [PubMed] [Google Scholar]
- 2.van Dongen, J. T., U. Schurr, M. Pfister, and P. Geigenberger. 2003. Phloem metabolism and function have to cope with low internal oxygen. Plant Physiol. 131:1529–1543. [DOI] [PMC free article] [PubMed] [Google Scholar]
- 3.van Dongen, J. T., G. W. Roeb, M. Dautzenberg, A. Froehlich, H. Vigeolas, P. E. H. Minchin, and P. Geigenberger. 2004. Phloem import and storage metabolism are highly coordinated by the low oxygen concentrations within developing wheat seeds. Plant Physiol. 135:1809–1821. [DOI] [PMC free article] [PubMed] [Google Scholar]
- 4.Vigeolas, H., J. T. van Dongen, P. Waldeck, D. Huhn, and P. Geigenberger. 2003. Lipid storage metabolism is limited by the prevailing low oxygen concentrations in oilseed rape. Plant Physiol. 133:2048–2060. [DOI] [PMC free article] [PubMed] [Google Scholar]
- 5.Bologa, K. L., A. R. Fernie, A. Leisse, M. E. Loureiro, and P. Geigenberger. 2003. A bypass of sucrose synthase leads to low internal oxygen and impaired metabolic performance in growing potato tubers. Plant Physiol. 132:2058–2072. [DOI] [PMC free article] [PubMed] [Google Scholar]
- 6.Geigenberger, P. 2003. Response of plant metabolism to too little oxygen. Curr. Opin. Plant Biol. 6:247–256. [DOI] [PubMed] [Google Scholar]
- 7.Evans, D. E. 2004. Aerenchyma formation. New Phytol. 161:35–49. [Google Scholar]
- 8.Klok, E. J., I. E. Wilson, D. Wilson, S. C. Chapman, R. M. Ewing, S. C. Somerville, W. J. Peacock, R. Dolferus, and E. S. Dennis. 2002. Expression profile analysis of the low-oxygen response in Arabidopsis root cultures. Plant Cell. 14:2481–2494. [DOI] [PMC free article] [PubMed] [Google Scholar]
- 9.Baxter-Burrell, A., Z. B. Yang, P. S. Springer, and J. Bailey-Serres. 2002. RopGAP4-dependent Rop GTPase rheostat control of Arabidopsis oxygen deprivation tolerance. Science. 296:2026–2028. [DOI] [PubMed] [Google Scholar]
- 10.Dolferus, R., E. J. Klok, C. Delessert, S. Wilson, K. P. Ismond, A. G. Good, W. J. Peacock, and E. S. Dennis. 2003. Enhancing the anaerobic response. Ann. Bot. (Lond.). 91:111–117. [DOI] [PMC free article] [PubMed] [Google Scholar]
- 11.Armstrong, W., D. Cousins, J. Armstrong, D. W. Turner, and P. M. Beckett. 2000. Oxygen distribution in wetland plant roots and permeability barriers to gas-exchange with the rhizosphere: a microelectrode and modelling study with Phragmites australis. Ann. Bot. (Lond.). 86:687–703. [Google Scholar]
- 12.Buerk, D. G. 2004. Measuring tissue PO2 with microelectrodes. Methods Enzymol. 381:665–690. [DOI] [PubMed] [Google Scholar]
- 13.Chen-Esterlit, Z., S. F. Peteu, H. A. Clark, W. McDonald, and R. Kopelman. 1999. Comparative study of optical fluorescent nanosensors (PEBBLEs) and fiber optic microsensors for oxygen sensing. Proc. SPIE. 3602:156–163. [Google Scholar]
- 14.Xu, H., J. W. Aylott, R. Kopelman, T. J. Miller, and M. A. Philbert. 2001. A real-time ratiometric method for the determination of molecular oxygen inside living cells using sol-gel-based spherical optical nanosensors with applications to rat C6 glioma. Anal. Chem. 73:4124–4133. [DOI] [PubMed] [Google Scholar]
- 15.Brasuel, M., R. Kopelman, J. W. Aylott, H. Clark, H. Xu, M. Hoyer, T. J. Miller, R. Tjalkens, and M. A. Philbert. 2002. Production, characteristics and applications of fluorescent PEBBLE nanosensors: potassium, oxygen, calcium and pH imaging inside live cells. Sensors Mat. 14:309–338. [Google Scholar]
- 16.Monson, E., M. Brasuel, M. A. Philbert, and R. Kopelman. 2003. PEBBLE nanosensors for in vitro bioanalysis. In Biomedical Photonics Handbook. T. Vo-Dinh, editor. CRC Press, Boca Raton, FL.
- 17.Koo, Y.-E. L., Y. Cao, R. Kopelman, S. M. Koo, M. Brasuel, and M. A. Philbert. 2004. Real-time measurements of dissolved oxygen inside live cells by organically modified silicate fluorescent nanosensors. Anal. Chem. 76:2498–2505. [DOI] [PubMed] [Google Scholar]
- 18.Papkovsky, D. B. 2004. Methods in optical oxygen sensing: protocols and critical analyses. Methods Enzymol. 381:715–735. [DOI] [PubMed] [Google Scholar]
- 19.Amao, Y., T. Miyashita, and I. Okura. 2001. Platinum tetrakis(pentafluorophenyl)porphyrin immobilized in polytrifluoroethylmethacrylate film as a photostable optical oxygen detection material. J. Fluor. Chem. 107:101–106. [Google Scholar]
- 20.Papkovsky, D. B. 1993. Luminescent porphyrins as probes for optical (bio)sensors. Sensors Actuators B. 11:293–300. [Google Scholar]
- 21.Demas, J. N., B. A. DeGraff, and P. B. Coleman. 1999. Oxygen sensors based on luminescence quenching. Anal. Chem. News Features. 71:793A–800A. [DOI] [PubMed] [Google Scholar]
- 22.Holst, G., R. N. Glud, M. Kühl, and I. Klimant. 1997. A micro-optode array for fine-scale measurement of oxygen distribution. Sensors Actuators B. 38–39:122–129. [Google Scholar]
- 23.Andrzejewski, D., I. Klimant, and H. Padbielska. 2002. Method for lifetime-based chemical sensing using the demodulation of the luminescence signal. Sensors Actuators B. 84:160–166. [Google Scholar]
- 24.Lakowicz, J. R. 1999. Principles of Fluorescence Spectroscopy, 2nd Ed. Kluwer Academic/Plenum Publishers, New York.
- 25.Gratton, E., and D. M. Jameson. 1985. New approach to phase and modulation resolved spectra. Anal. Chem. 57:1694–1697. [Google Scholar]
- 26.Singer, L. A., and R. P. Haugland. 1994. U.S. Patent. 005573909A.
- 27.Fisahn, J., U. P. Hansen, and W. J. Lucas. 1992. Reaction kinetic model of a proposed plasma membrane two-cycle proton-transport system of Chara-corallina. Proc. Natl. Acad. Sci. USA. 89:3261–3265. [DOI] [PMC free article] [PubMed] [Google Scholar]
- 28.Valeur, B. 2002. Molecular Fluorescence—Principles and Applications. Wiley-VCH, Weinheim, Germany.
- 29.Maszewski, J., and A. J. E. van Bel. 1996. Different patterns of intercellular transport of Lucifer Yellow in young and mature antheridia of Chara vulgaris L. Bot. Acta. 109:110–114. [Google Scholar]
- 30.Pilling, J., H. Bücking, L. Willmitzer, and J. Fisahn. 2004. Inhibition of a ubiquitously expressed pectin methyl esterase Solanum tuberosum L. affects plant growth, leaf growth polarity and ion partitioning. Planta. 219:32–40. [DOI] [PubMed] [Google Scholar]
- 31.Reid, R. J., M. A. Tester, and F. A. Smith. 1997. Voltage control of calcium influx in intact cells. Aust. J. Plant Physiol. 24:805–810. [Google Scholar]
- 32.Scherp, P., and K. H. Hasenstein. 2003. Microinjection—a tool to study gravitropism. Adv. Space Res. 31:2221–2227. [DOI] [PubMed] [Google Scholar]
- 33.Karol, K. G., R. M. McCourt, M. T. Cimino, and C. F. Delwiche. 2001. The closest living relatives of land plants. Science. 294:2351–2353. [DOI] [PubMed] [Google Scholar]
- 34.Lewis, L. A., and R. M. McCourt. 2004. Green algae and the origin of land plants. Am. J. Bot. 91:1535–1556. [DOI] [PubMed] [Google Scholar]
- 35.Brody, S. S. 2002. Fluorescence lifetime, yield, energy transfer, and spectrum in photosynthesis, 1950–1960. Photosynth. Res. 73:127–132. [DOI] [PubMed] [Google Scholar]
- 36.Denny, M. W. 1993. Air and Water: The Biology and Physics of Life's Media. Princeton University Press, Princeton, NJ.
- 37.Ott, T., J. T. van Dongen, C. Gunther, L. Krusell, G. Desbrosses, H. Vigeolas, V. Bock, T. Czechowski, P. Geigenberger, and M. K. Udvardi. 2005. Symbolic leghemoglobins are crucial for nitrogen fixation in legume root nodules but not for general plant growth and development. Curr. Biol. 15:531–535. [DOI] [PubMed] [Google Scholar]
- 38.Wang, Y., J. J. Wu, Y. F. Wang, L. P. Qin, and W. J. Jin. 2005. Selective sensing of Cu(II) at ng ml−1 level based on phosphorescence quenching of 1-bromo-2-methylnaphthalene sandwiched in sodium deoxycholate dimer. Chem. Commun. 2005:1090–1091. [DOI] [PubMed] [Google Scholar]
- 39.Liu, J.-M., A.-H. Wu, H.-H. Xu, Q.-H. Wang, L.-D. Li, and G.-H. Zhu. 2005. Determination of trace mercury by solid substrate room temperature phosphorescence quenching method based on lead carboxymethyl cellulose (Pb(CMC)2) particles containing luminescent salicyl fluorones molecules. Talanta. 65:501–504. [DOI] [PubMed] [Google Scholar]
- 40.Papkovskii, D. B., A. P. Savitskii, and A. I. Yaropolov. 1990. Optical biosensors for determination of oxygen and glucose based on phosphorescence quenching of metalloporphyrins. J. Anal. Chem. USSR. 45:1045–1048. [Google Scholar]