

Abstract
Clustering is one of the most powerful tools in computational biology. The conventional wisdom is that events that occur in clusters are probably not random. In protein docking, the underlying principle is that clustering occurs because long-range electrostatic and/or desolvation forces steer the proteins to a low free-energy attractor at the binding region. Something similar occurs in the docking of small molecules, although in this case shorter-range van der Waals forces play a more critical role. Based on the above, we have developed two different clustering strategies to predict docked conformations based on the clustering properties of a uniform sampling of low free-energy protein-protein and protein-small molecule complexes. We report on significant improvements in the automated prediction and discrimination of docked conformations by using the cluster size and consensus as a ranking criterion. We show that the success of clustering depends on identifying the appropriate clustering radius of the system. The clustering radius for protein-protein complexes is consistent with the range of the electrostatics and desolvation free energies (i.e., between 4 and 9 Å); for protein-small molecule docking, the radius is set by van der Waals interactions (i.e., at ∼2 Å). Without any a priori information, a simple analysis of the histogram of distance separations between the set of docked conformations can evaluate the clustering properties of the data set. Clustering is observed when the histogram is bimodal. Data clustering is optimal if one chooses the clustering radius to be the minimum after the first peak of the bimodal distribution. We show that using this optimal radius further improves the discrimination of near-native complex structures.
INTRODUCTION
In the last decade, clustering has become a ubiquitous tool in computational structural biology. Early on, clustering was used to detect common three-dimensional structural motifs in proteins (1). The underlying principle behind this commonality is that evolution has developed thermodynamically accessible folding units that tend to be preserved among large sets of protein families. More recently, clustering has become a very useful tool for protein structure prediction (2), and at every level of homology modeling—i.e., structure (3), sequence (4), and alignment (5). However, it is not fully understood whether the clustering is solely determined by the existence of many structural neighbors around the native state, or if the result at least partially depends on the particular simulation method used in the calculations. In fact, one cannot fail to note that, to a large extent, the success of clustering in structure prediction is due to the lack of an appropriate free-energy estimate of model structures; thus, recurrence of structural motifs is often the most reliable determinant of a good structure.
Most macromolecular interactions require a rapid and highly specific association process. A successful reaction between proteins requires the appropriate encounter of a reactive patch. This is often achieved by long-range electrostatic and/or desolvation forces that bias the approach of the molecules to favor reactive conditions. This steering leads to the clustering of ligands near their binding region, thus speeding up the reactions. Quantitative analyses of the protein binding free energy (6–11) have confirmed this rationale by establishing a direct relationship between clustering and the prediction of protein interactions.
Clustering of bound conformations near the native state has also been observed in protein-small molecule interactions, both experimentally and computationally. X-ray and NMR structures of proteins, determined in aqueous solutions of organic solvents, show that the organic molecules cluster in locations near the active site of enzymes, delineating the binding pockets (12–16; see also Ref. 17 for a cluster analysis of bound water molecules). All other bound molecules are either in crystal contacts, occur only at high ligand concentrations, or are in small pockets that can only accommodate a single molecule rather than an entire cluster. This evidence strongly suggests that clustering low free-energy docked conformations should again be beneficial in identifying the active site in proteins, particularly when considering “consensus sites”, i.e., the surface regions in which six or seven different small compounds cluster.
In this article we discuss the application of simple clustering strategies to the above two problems. Considering a free-energy surface with multiple minima, it is obvious that conformations with free energies below a certain threshold will form a number of clusters (see Fig. 1) and that most of these clusters will remain largely invariant for threshold values within a certain free-energy range. Accordingly, many docking and conformational search algorithms use clustering simply for reducing the number of conformations. We emphasize that clustering is much more central to the strategies we describe here, because looking for large clusters is the major tool of finding near-native conformations. We show that clustering provides significant improvements for the prediction of protein complex structures over the traditional re-scoring and ranking of the conformations using some type of potential. More interestingly, we find that the clustering radius is not arbitrary but reflects the dominant terms of the interaction free energy and the size of the main attractors in the binding free-energy landscape. Without any a priori knowledge of the complex structure, we develop a methodology to predict an optimal clustering radius and show that this radius further improves the discrimination of the native state. A rigorous clustering analysis should differentiate between anecdotal (or artificial) clustering and one due to the biophysical mechanism of the problem at hand.
FIGURE 1.

Sketch of a free-energy landscape of protein-protein association.
METHODS
Protein-protein docking: screening, filtering, and clustering a homogeneous sampling of the binding free-energy landscape
Docked conformations are generated using the ClusPro server (18). The algorithm evaluates a simple shape complementarity scoring function on some 109 putative structures using the program DOT (19), of which the top 20,000 are retained for filtering by electrostatic and desolvation potentials. The desolvation free energy is calculated using an atomic-contact potential (20). The electrostatic interactions are obtained by a simple Coulombic potential with the distance-dependent dielectric of 4r. Usually we retain N structures with the lowest values of the desolvation free energy, and 3N structures with the lowest values of the electrostatic energy (21). The reason for retaining three times more electrostatic than desolvation candidates is that electrostatics is highly sensitive to small perturbations in the coordinates, and hence yields many more outliers than the slowly varying atomic-contact desolvation potential. For typical applications, we found that N = 500, implying a total of 2000 (500 desolvation and 1500 electrostatic) low free-energy receptor-ligand structures, is an optimal number for retaining the most true positives from the original 20,000 structures.
Clustering method
The clustering algorithm, used for ranking and discrimination of protein-protein complex structures, clusters the 4N (default 2000) receptor-ligand filtered structures according to the root-mean-squared deviations (RMSDs) of the ligand atoms that are within 10 Å of any atom on the fixed receptor. We use a simple greedy algorithm to find the structures with the largest number of neighbors within a certain clustering radius RC (the default value is RC = 9 Å). The structure with the highest number of neighbors within the selected cluster radius is considered as the center of the first ranked cluster. The members of this cluster are removed, and we select the next structure with the highest number of neighbors from the remaining ligands, usually generating and analyzing the top 30 clusters. The clustering and docking method has been implemented as a public server named ClusPro at http://structure.bu.edu (18), and the algorithm has been used with success in the first Critical Assessment of PRedicted Interactions (CAPRI) experiment (22,23).
Pairwise RMSD distribution of docked conformations
To analyze the clustering properties of free-energy filtered docked conformations, we compute the pairwise RMSD histogram of all docked conformations. To understand this simple analysis, consider a set of points in the plane, and construct the histogram of pairwise distances, i.e., plot the number of points that are within a distance r to any other point as a function of r. If the points are randomly distributed, the plot is smooth with no characteristic length scale. However, if the points cluster within a radius R (see, e.g., Fig. 2 A), then the distribution will have a peak, followed by a minimum, at ∼r = R. Fig. 2 B shows the distributions both for a set of random points, and the set of points that cluster with a radius of five units.
FIGURE 2.
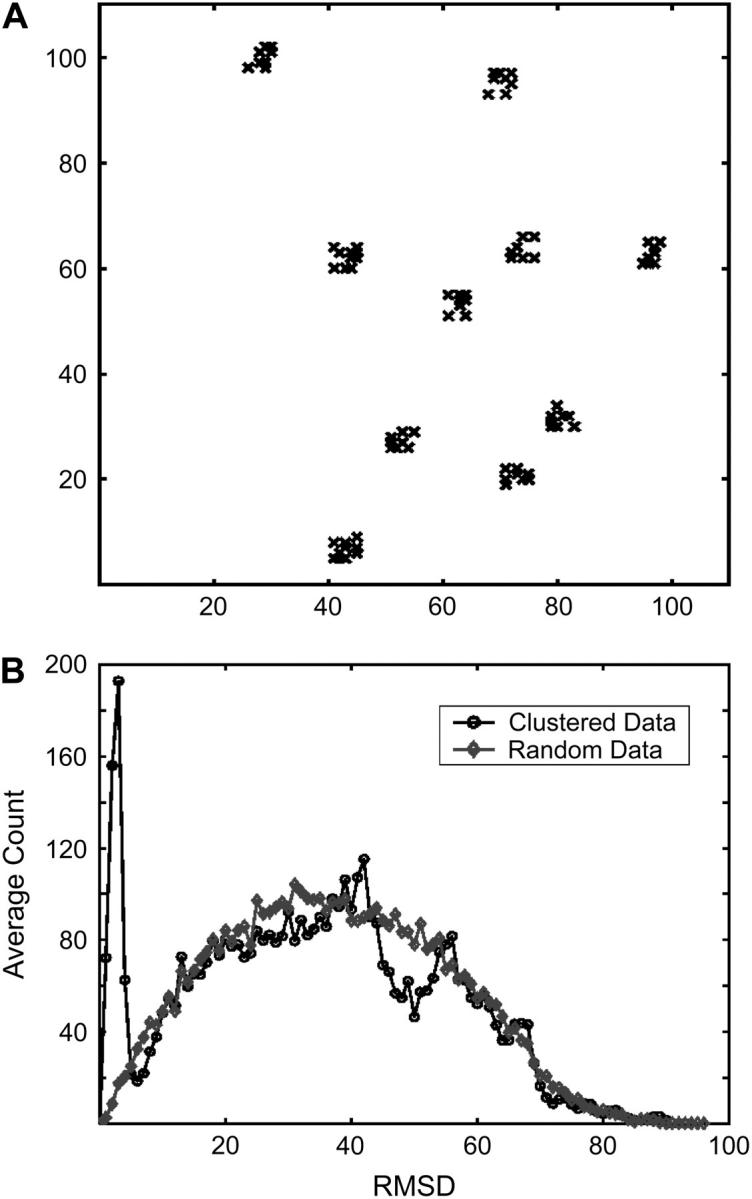
(A) Distribution of a random set of points forming clusters of size 5 (any dimension) on a two-dimensional square surface. (B) Histogram of pairwise RMSD between points (bin of size 1) for the points in A has a bimodal distribution with the minimum between the two peaks corresponding to the clustering radius of the data set; also shown is the histogram for a random set of points (not shown).
Computation of the optimal clustering radius in protein docking
Choosing a clustering radius larger than R = 5 units (the minimum between the two peaks of the bimodal distribution in Fig. 2 B, and the actual size of the clusters in Fig. 2 A) would result in clusters of smaller clusters, whereas a smaller radius would split the actual clusters into smaller groups. However, if the size of the cluster is indicative of an intrinsic property of the data set (as we have argued in the Introduction), then the optimal clustering radius must be at the minimum of the bimodal distribution expected from a data set that aggregates into local clusters. This definition is quite general and should apply to any given data set that forms clusters.
Clustering parameter Δ
For protein docking, a typical distribution of the pairwise RMSD of free-energy filtered data sets of docked conformations is shown in Fig. 3. The optimal clustering radius can readily be computed from distribution as the minimum after the peak at ∼7 Å. To quantify the quality of the clustering in Fig. 3 we define the parameter Δ that measures the depth of the separation between the two peaks of the distribution. If Δ = 0, there is no separation of length scales between clusters; if Δ = 1, the separation of length scales and clustering are optimal.
FIGURE 3.

Pairwise RMSD distribution of docked conformations for the complex forming 1ATN. The clustering parameter Δ = 1 − fmin/fmax, where fmin corresponds to the depth of the minimum between the first and second peak and fmax corresponds to the height of the first peak (see text).
Protein mapping using organic solvents
Clustering is also used in computational solvent mapping, a powerful protein binding-site analysis tool. The method of organic solvent mapping was introduced by Ringe and co-workers (12,13), who determined protein structures in aqueous solutions of organic solvents, and in each case found only a limited number of organic solvent molecules bound to the protein. When five or six structures of a protein determined in different organic solvents were superimposed, the organic molecules tended to cluster in the active site, forming consensus sites that delineated important subsites of the binding pocket (12). Thus, the clustering of the probes that may differ in size and polarity naturally occurs in the experiment. We have developed an algorithm to map proteins computationally rather than experimentally (24–26). The mapping of a protein starts with a rigid body search to place ligand molecules at a large number of favorable positions using the docking program GRAMM (Global RAnge Molecular Matching) (27). GRAMM performs an exhaustive six-dimensional search through the relative intermolecular translations and rotations using a Fast Fourier Transform correlation technique and a simple scoring function that measures shape complementarities and penalizes overlaps. Again, a few thousand conformations of each probe are retained for the refinement step that involves the minimization of a free-energy function consisting of van der Waals, electrostatics, and desolvation terms. Although the local minimization moves the ligand conformation slightly away from the discrete states determined by the grid, the changes are very small.
Clustering of small molecules
Similarly to the protein-protein docking, we filter the generated structures, but in the case of small molecules this step also involves clustering. Initially, the two most distant of the minimized probe conformations are designated as hubs for clustering the remaining conformations. A new hub, the most distant probe from the current hubs, is designated when necessary until all of the probes are clustered such that the maximum distance between a cluster's hub and any of its members (the cluster radius) is less than half of the average distance between all existing hubs. The minimized probe conformations are grouped into clusters such that the maximum distance between a cluster's hub and any of its members (the cluster radius) is smaller than half of the average distance between all the existing hubs. Clusters with <20 entries are removed. The clusters are ranked on the basis of their average free energies 〈ΔG〉i = ΣjpijΔGj, where pij = exp(ΔGj/RT)/Qi and Qi = Σj exp(−ΔGj/RT) is a partition function obtained by summing the Boltzmann factors over the conformations in the ith cluster only. For each probe we retain a number (usually five) of the lowest free-energy clusters. We note that the goal of clustering in this filtering step is simply to reduce the number of isolated minima among the low free-energy conformation retained for further analysis. The clusters of the retained clusters (called consensus sites) are defined as the positions at which the clusters overlap for a number of different probes. The position at which the maximum number of different probes overlap will be referred to as consensus-site number 1, the position with the next highest number of probes consensus-site number 2, and so on (24).
RESULTS AND DISCUSSION
Clustering protein-protein docked conformations
Based on the biophysics of the protein binding process, the set of low-lying free-energy receptor-ligand complexes are expected to cluster around low free-energy attractors. In practice, clustering might not occur near the bound conformation since the expected binding free-energy funnel is often blurred when sampling the space of receptor and ligand complexes of independently resolved protein structures (unbound).
Comparing free energy versus clustering ranking of docked conformations
To gauge the benefits of clustering alone on the prediction of protein-protein complexes we have clustered a benchmark set of docked conformations from Weng's lab (28). The conformations, which are publicly available at http://zlab.bu.edu/∼rong/dock/benchmark.shtml, were generated using the software ZDOCK (29), which includes a scoring function similar to that developed in Camacho et al. (21). Namely, the data consists of a set of 2000 conformations ranked according to surface complementarity, Coulombic electrostatics, and the atomic-contact potential's desolvation potential.
Table 1 shows a direct comparison of the free-energy-based ranking used by the program ZDOCK and the clustering results of the same set of 2000 docked conformations using ClusPro. The results (published in detail in Ref. 18) show that clustering alone improves the discrimination of near-native structures by a factor of 3 or more. We note that these results consider protein structures to be rigid bodies. Table 1 includes 42 different protein complexes for which there was a relevant number of hits within 10 Å RMSD from the native complex structure. The clustering radius was set to RC = 9 Å. Strikingly, as long as there are at least 10 hits in the set of 2000 structures, ClusPro is always able to rank a near-native structure within the top 50 predictions.
TABLE 1.
Success rate for predicting a near-native (<10 Å binding site RMSD) complex structure for a set of 42 protein-protein complexes based on free energy alone and after clustering using the server ClusPro
| Successful prediction | Ranking based on free energy* | Ranking based on clustering |
|---|---|---|
| Top 1 | 5% | 31% |
| Top 10 | 14% | 74% |
| Top 30 | 19% | 93% |
| Top 50 | 31% | 100% |
Based on GSC score in Chen and Weng (29).
Evidence of clustering in free-energy filtered receptor-ligand complexes
To show that clustering is more than a simple averaging procedure, we analyze the clustering properties of 2000 free-energy filtered receptor-ligand complexes from several interacting proteins as obtained by the default options of the server ClusPro that includes the program DOT (19) for screening surface complementarity. Fig. 4 shows the number of ligands that are within a given distance of any other ligand, measured in terms of binding site RMSD. Fig. 4 A corresponds to the analysis of the top 200 complexes that have the lowest desolvation free energies, and Fig. 4 B to the top 200 complexes with the most favorable electrostatic energies. As in Fig. 2, the distributions show the marker of a data set that cluster around local basins. However, it is also important to emphasize that real decoy sets are far noisier than Fig. 2 A. Nevertheless, the plots in Fig. 4 also show that far more docked conformations are within 5–10 Å RMSD than would be expected from a random distribution. The recurrent peak observed below 10 Å for both the desolvation and/or electrostatic filtered data confirms that these free-energy attractors effectively cluster docked conformations around local free-energy minima. Strikingly, those complexes that have no hits near the binding site tend not to have the clustering peak—e.g., Target 9 (the LicT homodimer; see Ref. 30) of CAPRI, for which the server failed to retain complexes near the native complex structure.
FIGURE 4.
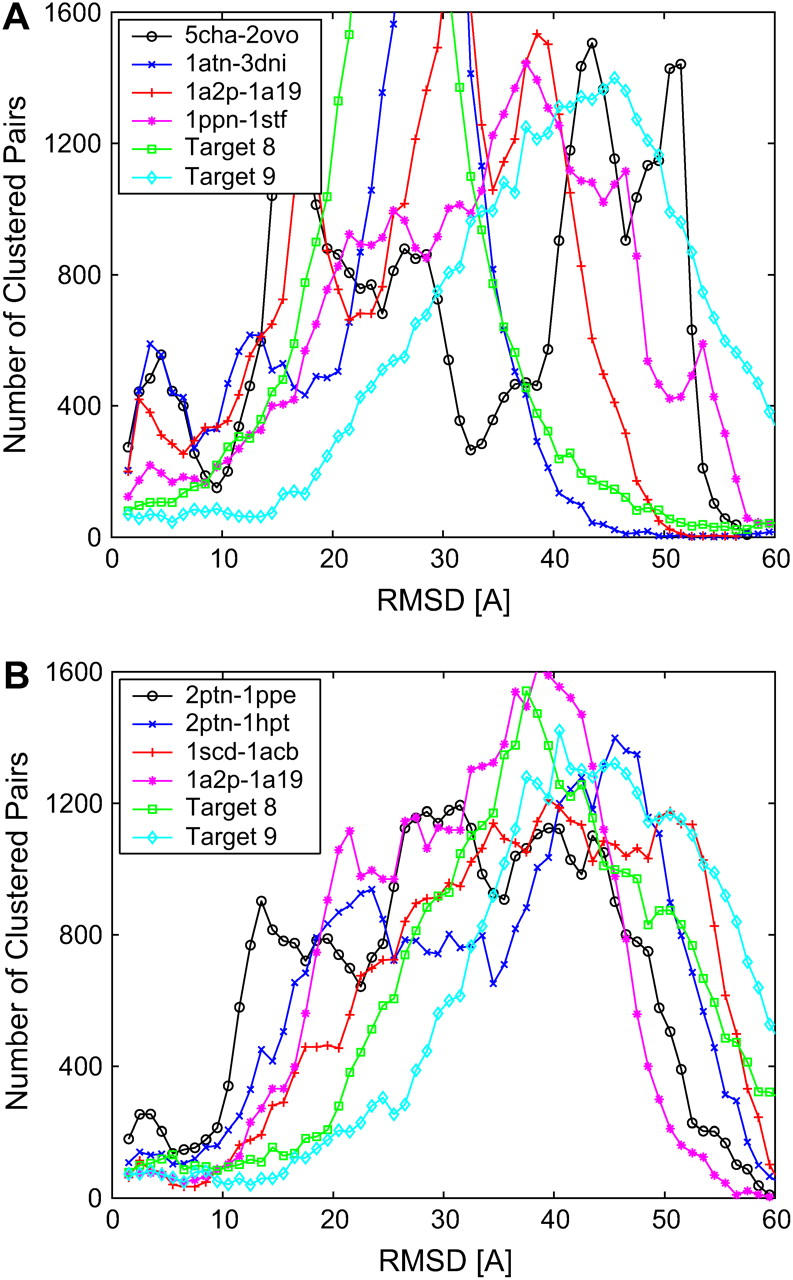
Distribution of the ligand binding site RMSD of the best 200 (A) desolvation and (B) electrostatic receptor-ligand complexes as a function of cluster radius (in Å) for four unbound-unbound complexes and two CAPRI targets (bin size is 1 Å). The docked conformations were generated by the ClusPro server (see Ref. 18).
The characteristic clustering radius—i.e., the minimum after the first peak—varies between 5 and 10 Å. The fact that sometimes clustering is observed in the desolvation free energy and sometimes in the electrostatic free energy is consistent with the complementarity of these interactions (8). We conclude that the distribution of pairwise RMSD of free-energy filtered structures generally reflects the clustering around broad free-energy minima. The size of the peak pertaining to intracluster RMSDs is directly proportional to the quality of the discrimination by our method. For five of the complexes in Fig. 4, ClusPro found a near-native ligand conformation in the highest ranked cluster. Other complexes ranked fourth- and seventh-best the cluster containing the near-native ligand conformation. CAPRI Target 8 (Nidogen-G3/Laminin; see Ref. 31) was ranked third. Due to the relatively small and rather polar interface of Target 8, only the clustering of the electrostatic energy (Fig. 4 B) produced a discernible peak, whereas the clustering of the desolvation free energy (Fig. 4 A) did not.
Typical cluster size is 9 Å RMSD for protein-protein interactions
The size of the attractor at the binding site is ∼9 Å, a distance consistent with the range of the desolvation and electrostatic interactions. The half-value of the desolvation potential is reached at 6 Å atomic separation, vanishing at distances larger than 7 Å. Similarly, the half-value of long-range Coulombic interactions (distance-dependent dielectric 4r) is ∼5 Å, slowly decaying to near-zero at ∼10 Å (9). Fig. 4 A shows that the size of the desolvation free-energy clusters is ∼6–10 Å, suggesting the presence of relatively broad hydrophobic patches. In all likelihood, desolvation forces will dominate the binding process of these complexes, like for the case of protease inhibitor complex 5cha-2ovo. The clustering peak for the electrostatically filtered data in Fig. 4 B has a range between 5 and 7 Å, somewhat smaller than the range for desolvation interactions. This is due to the rapid decay of the distance-dependent electrostatic field, and also due to the fact that, for unbound structures, the electrostatic field is noisy. From the analysis of Fig. 4, we conclude that, in average, the optimal clustering distance of desolvation and electrostatic filtered complexes is 9 Å. We note that this is the default clustering radius that we set for the automated docked predictions in the ClusPro server.
Optimal clustering radius improves discrimination of near-native docked conformations
The recurrent bimodal distribution observed in the clustering of the pairwise RMSD of filtered low free-energy docked conformations (Fig. 4) confirms that these conformations indeed aggregate around local minima. Namely, they distribute around the free-energy landscape as in the sketch in Fig. 2 A. Although we have already shown that clustering alone significantly improves the discrimination of near-native structures, we now proceed to demonstrate that one could do even better by extracting from the data set the optimal clustering radius that characterizes the free-energy landscape.
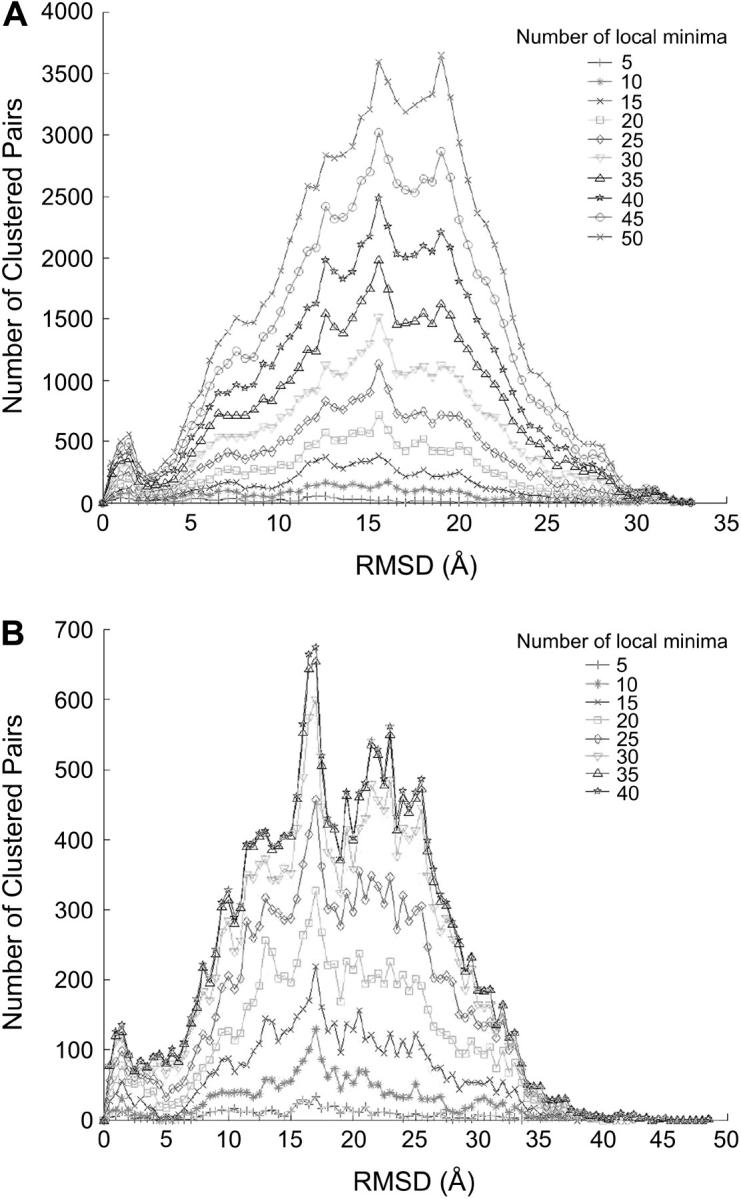
Similar to the analysis presented in Table 1, we use Weng's benchmark of 2000 docked conformations of 40 independently crystallized receptor and ligand structures to showcase how the optimal clustering radius can improve discrimination of near-native structures. Fig. 5 A shows the pairwise RMSD distribution for five complexes every 1 Å (see Methods), and the data points are interpolated using a cubic spline function. The pairwise RMSD is calculated on 1200 conformations corresponding to the top 300 desolvation and three-times more (900) electrostatic complexes. As suggested by Fig. 1, clustering too many structures (high free energies) would only add noise to the procedure. On the other hand, too few conformations might lead to many small clusters. We have already established that keeping 2000 low free-energy conformations led to a reasonable sampling of the binding pocket (21). In Fig. 5 B, we show that, indeed, the clustering property is maintained by keeping between 1000 and 2000 docked conformations.
FIGURE 5.

(A) Histograms of the pairwise RMSD of the top 1200 (900 best electrostatic and 300 best desolvation) conformations for different protein complexes. Only the relevant region, <15 Å, is shown. (B) Histograms of pairwise RMSD for different numbers of the top conformations of 1UDI complex. The data points are fitted by a cubic spline interpolation.
Four of the complexes analyzed in Fig. 5 A show a clear bimodal distribution, the first peak occurring for clustering radius of <9 Å. A fifth complex, PDB code 1BRC, shows a plateau between 3 and 8 Å. The ligand in this complex is known to have a distorted interface in the unbound crystal structure (see, e.g., Ref. 32); thus it is not surprising to see that docked conformations in this system do not cluster well.
In Table 2, we show both the ranking of the best predictions (<10 Å RMSD from the crystal) using the default clustering radius of 9 Å (see details in Ref. 18) and the ranking based on the optimal clustering radius as defined by the minimum of the bimodal. Note that from plots like in Fig. 5, it is straightforward to compute the radius and clustering parameter Δ. Clustering predictions using the optimal radius (ranging between 4 and 10 Å) yields better predictions overall than a fixed radius (default 9 Å); the average ranking is 7 and 8.5, respectively (excluding the outlier 2PCC). Moreover, the deeper the separation between the peaks of the bimodal distribution is the better the predictions. In particular, for Δ ≥ 0.4, the ranking of near-native predictions is much better for optimal than for the default clustering radius, with an average ranking in this case of 4.3 and 8.8, respectively. As the peaks start to overlap and Δ decreases below 0.4, we observe only a partial improvement.
TABLE 2.
Ranking of best near-native prediction using the default clustering radius of 9 Å and the optimal radius as defined by the minimum of the bimodal distribution
| Complex | 9 Å rank | Optimal rank | Ratio |
|---|---|---|---|
| 2PCC | 42 | 48 | 0.745 |
| 1MEL | 2 | 1 | 0.7 |
| 1ATN | 2 | 1 | 0.617 |
| 1STF | 1 | 1 | 0.615 |
| 1UDI | 10 | 1 | 0.587 |
| 1AVW | 1 | 1 | 0.587 |
| 2TEC | 1 | 1 | 0.563 |
| 2BTF | 7 | 3 | 0.561 |
| 2PTC | 3 | 3 | 0.52 |
| 2KAI | 25 | 8 | 0.514 |
| 1QFU | 39 | 11 | 0.492 |
| 1UGH | 5 | 1 | 0.489 |
| 1BRS | 15 | 16 | 0.441 |
| 1MDA | 13 | 12 | 0.431 |
| 2SIC | 2 | 1 | 0.423 |
| 1BQL | 6 | 3 | 0.406 |
| 1AHW | 1 | 2 | 0.389 |
| 1CHO | 1 | 1 | 0.384 |
| 1WQ1 | 1 | 3 | 0.383 |
| 1IAI | 15 | 22 | 0.381 |
| 1TAB | 11 | 8 | 0.364 |
| 4HTC | 3 | 1 | 0.346 |
| 1NCA | 1 | 2 | 0.343 |
| 1NMB | 10 | 6 | 0.311 |
| 1BVK | 4 | 11 | 0.304 |
| 2SNI | 11 | 7 | 0.302 |
| 1CSE | 9 | 2 | 0.286 |
| 1MLC | 14 | 2 | 0.243 |
| 1SPB | 1 | 1 | 0.208 |
| 1DQJ | 26 | 37 | 0.206 |
| 1FBI | 17 | 32 | 0.138 |
| 2JEL | 6 | 13 | 0.108 |
| 1ACB | 3 | 1 | 0.102 |
| 1JHL | 30 | 29 | 0.098 |
| 1TGS | 1 | 1 | 0.062 |
| 1BRC | 1 | 1 | 0.033 |
| 1PPE | 1 | 1 | 0.005 |
| 1WEJ | 32 | 25 | 0 |
| 1DFJ | 1 | 1 | 0 |
| 1CGI | 1 | 1 | 0 |
| Best clustering | 10 cases | 19 cases |
Results are for Weng's benchmark data set (see Ref. 28 for a detailed list of the names and PDBs of the proteins involved). Near-native predictions are defined as a ligand that is <10 Å away from the crystal structure.
Protein mapping using organic solvents
As described in Methods, computational solvent-mapping places small organic molecules containing various functional groups (i.e., molecular probes) on a protein surface and finds favorable positions using empirical free-energy functions. The goal of the analysis is to find the hot-spots of the protein where the highest number of different organic probe molecules cluster. Since such consensus sites, defined by the largest clusters, are generally located in the ligand binding sites of proteins, the method has been used for identification and characterization of active sites (24–26,33).
Clustering of small molecular probes
Table 3 shows the top three consensus sites for 11 enzymes that we have recently mapped. We list the total number of different probes used for the mapping of each protein, the number of clusters at the consensus sites, and the distance of the center of the consensus site from the substrate-binding site of the enzyme. According to this table, the largest consensus site is located at the active site for all enzymes but haloalkane dehalogenase (26). The latter binds very small ligands, such as ethylene dichloride, and the binding site is in the middle of a long and narrow channel. Since some of the probes are bigger than the substrate, they are unable to enter the channel, and we find the largest consensus sites at the two ends of the deep internal channel by which the substrate must traverse to the active site.
TABLE 3.
Number of different probes in the largest clusters obtained by computational mapping
| Enzyme | PDB code | No. of probes mapped | Cluster rank | No. of probes in cluster | Distance to ligand (Å) |
|---|---|---|---|---|---|
| 2lym | 8 | 1 | 7 | 2.3 | |
| Lysozyme | 2 | 6 | 10.9 | ||
| 3 | 5 | 3.2 | |||
| 2tlx | 4 | 1 | 4 | 0.6 | |
| Thermolysin | 2 | 3 | 3.8 | ||
| 3 | 3 | 17.5 | |||
| 1ebg | 6 | 1 | 6 | 0.4 | |
| Enolase | 2 | 5 | 10.3 | ||
| 3 | 4 | 20.7 | |||
| 1rnt | 6 | 1 | 7* | 0.4 | |
| Ribonuclease T1 | 2 | 5 | 15.2 | ||
| 3 | 4 | 11.6 | |||
| 2ypi | 6 | 1 | 5 | 0.5 | |
| Triosephosphate isomerase | 2 | 4 | 20.1 | ||
| 3 | 3 | 5.7 | |||
| 1fbc | 6 | 1 | 7* | 1.1 | |
| Fructose-1,6-bisphosphate | 2 | 6 | 0.5 | ||
| 3 | 6 | 10.8 | |||
| 1tng | 6 | 1 | 6 | 0.3 | |
| Trypsin | 2 | 5 | 17.1 | ||
| 3 | 5 | 15.3 | |||
| Haloalkane dehalogenase† | 2dhc | 6 | 1 | 7* | 10.2 |
| 2 | 6 | 9.3 | |||
| 3 | 4 | 12.4 | |||
| 4 | 3 | 0.6 | |||
| 1dz4 | 8 | 1 | 8 | 0.6 | |
| Cytochrome P450 Cam | 2 | 5 | 10.5 | ||
| 3 | 3 | 20.7 | |||
| 1fag | 8 | 1 | 8 | 0.8 | |
| Cytochrome P450 BM3 | 2 | 8 | 17.3 | ||
| 3 | 6 | 9.4 | |||
| 1og5 | 8 | 1 | 5 | 0.4 | |
| Cytochrome P450 2C9 | 2 | 4 | 13.1 | ||
| 3 | 4 | 9.4 |
Two DMSO positions included in cluster.
The active site is located in the middle of a narrow channel and can accommodate only the three smallest probes (Cluster 4). Clusters 1 and 2 are at the two ends of the channel.
Evidence of clustering in docking of small molecular probes
Fig. 6 shows docked conformations of several small molecules (e.g., acetone, urea, phenol, isopropanol) and cytochrome p450-cam (1dz4). One of the largest clusters is located on top of the heme (drawn in yellow), with several other clusters distributed around the molecule, as well as some isolated probes. The clustering of small molecules is again consistent with hits concentrating in favorable minima as shown in Fig. 2 A.
FIGURE 6.

Clustering of seven small molecular probes on the surface of cytochrome p450-cam (1dz4). The active site is right above the heme drawn in yellow. For each probe, we kept the 20 top free-energy structures.
The clustering analyses of the resulting docked structures on two proteins, p450-cam (see Fig. 6) and lysozyme (2lym; Table 3), is shown in Fig. 7. As was seen with the protein-protein docking results, clustering again reveals a recurrent peak below 2–3 Å RMSD. It is important to note that GRAMM was used for the seven molecules docked to p450-cam, and the multi-start simplex method, CS-Map (24), was used for the nine probes docked to lysozyme (see Table 3).
FIGURE 7.
Distribution of the RMSD between multiple small molecular probes on the surface of (A) lysozyme (2lym) and (B) cytochrome P450-cam (1dz4) as a function of cluster radius (bin size is 0.25 Å). The number of included structures for each of seven probes varies from 5 to 50; therefore, the results of clustering 35–350 total small molecules are shown. The characteristic intercluster peak is robust with respect to the number of structures retained.
Cluster size is 2 Å RMSD for small molecule docking
As suggested by Figs. 6 and 7, small molecules tend to reside in small crevices and pockets on the protein surface. This surface complementarity yields very favorable van der Waals interactions, which is the dominant term of the binding free energy. Hence, it is not surprising to find that the characteristic cluster size revealed by the distribution of clustered molecules is on the order of 2 Å RMSD. For cluster radii larger than 5 Å, the sharp increase in the distribution reflects the inclusion of intercluster RMSDs.
CONCLUSIONS
Clustering is one of the most powerful tools in computational biology. The conventional wisdom is that events that occur in clusters are probably not random. To a large extent, experience has validated this assumption. However, often enough one finds cases where researchers overestimate the value of their correlations. In this article, we analyze clustering properties of docked protein structures. We show that clustering docked protein conformations can significantly enhance the discrimination of near-native docked conformations.
The most novel aspect of this article is that we show that clustering is not a tool of last resort but in fact it is an intrinsic property of a well sampled free-energy landscape. This is quite evident from the recurrent bimodal distribution observed in the histograms of the pairwise RMSD of docked conformations generated by ClusPro/ZDOCK and computational mapping for protein-protein and protein-small molecule docking, respectively. We show that this distribution, which does not involve any biochemical information, is an important property of a data set that clusters. The clustering radius is consistent with the range of the interactions dominating the binding process, and is well approximated by the minimum between the two peaks of the bimodal distribution. This radius leads to an optimal discrimination of nativelike complex structures when the normalized depth between the two peaks of the distribution Δ is larger than 0.4.
Our analysis strongly suggests the existence of many structural neighbors around the native state and other local free-energy minima. This clustering is not the result of the particular computational method employed to sample the landscape, but in fact it is due to the biophysics of protein association.
Acknowledgments
We thank S. Comeau for facilitating the top desolvation and electrostatics complexes used in the clustering analysis of protein-protein docking.
The research has been partially supported by grant No. DBI-0213832 from the National Science Foundation, and grants No. GM64700 and No. GM61867 from the National Institutes of Health. C.J.C. has also received support from National Science Foundation grant No. MCB-0444291.
Dima Kozakov and Karl H. Clodfelter contributed equally to this work.
References
- 1.Vriend, G., and C. Sander. 1991. Detection of common three-dimensional substructures in proteins. Proteins. 11:52–58. [DOI] [PubMed] [Google Scholar]
- 2.Shortle, D., K. T. Simons, and D. Baker. 1998. Clustering of low-energy conformations near the native structures of small proteins. Proc. Natl. Acad. Sci. USA. 95:11158–11162. [DOI] [PMC free article] [PubMed] [Google Scholar]
- 3.Bystroff, C., V. Thorsson, and D. Baker. 2000. HMMSTR: a hidden Markov model for local sequence-structure correlations in proteins. J. Mol. Biol. 301:173–190. [DOI] [PubMed] [Google Scholar]
- 4.Karplus, K., C. Barrett, and R. Hughey. 1998. Hidden Markov models for detecting remote protein homologies. Bioinformatics. 14:846–856. [DOI] [PubMed] [Google Scholar]
- 5.Prasad, J. C., S. Comeau, S. Vajda, and C. J. Camacho. 2003. Consensus alignment for reliable framework prediction in homology modeling. Bioinformatics. 19:1682–1691. [DOI] [PubMed] [Google Scholar]
- 6.Schreiber, G., and A. R. Fersht. 1996. Rapid, electrostatically assisted association of proteins. Nat. Struct. Biol. 3:427–431. [DOI] [PubMed] [Google Scholar]
- 7.Gabdoulline, R. R., and R. C. Wade. 1997. Simulation of the diffusional association of barnase and barstar. Biophys. J. 72:1917–1929. [DOI] [PMC free article] [PubMed] [Google Scholar]
- 8.Camacho, C. J., Z. P. Weng, S. Vajda, and C. DeLisi. 1999. Free energy landscapes of encounter complexes in protein-protein association. Biophys. J. 76:1166–1178. [DOI] [PMC free article] [PubMed] [Google Scholar]
- 9.Camacho, C. J., S. R. Kimura, C. DeLisi, and S. Vajda. 2000. Kinetics of desolvation-mediated protein-protein binding. Biophys. J. 78:1094–1105. [DOI] [PMC free article] [PubMed] [Google Scholar]
- 10.Camacho, C. J., and S. Vajda. 2001. Protein docking along smooth association pathways. Proc. Natl. Acad. Sci. USA. 98:10636–10641. [DOI] [PMC free article] [PubMed] [Google Scholar]
- 11.Fernandez-Recio, J., M. Totrov, and R. Abagyan. 2004. Identification of protein-protein interaction sites from docking energy landscapes. J. Mol. Biol. 43:629–640. [DOI] [PubMed] [Google Scholar]
- 12.Mattos, C., and D. Ringe. 1996. Locating and characterizing binding sites on proteins. Nat. Biotechnol. 14:595–599. [DOI] [PubMed] [Google Scholar]
- 13.Allen, K. N., C. R. Bellamacina, X. Ding, C. J. Jeffery, C. Mattos, G. A. Petsko, and D. Ringe. 1996. An experimental approach to mapping the binding surfaces of crystalline proteins. J. Phys. Chem. 100:2605–2611. [Google Scholar]
- 14.English, A. C., S. H. Done, L. S. Caves, C. R. Groom, and R. E. Hubbard. 1999. Locating interaction sites on proteins: the crystal structure of thermolysin soaked in 2% to 100% isopropanol. Proteins. 37:628–640. [PubMed] [Google Scholar]
- 15.English, A. C., C. R. Groom, and R. E. Hubbard. 2001. Experimental and computational mapping of the binding surface of a crystalline protein. Protein Eng. 14:47–59. [DOI] [PubMed] [Google Scholar]
- 16.Liepinsh, E., and G. Otting. 1997. Organic solvents identify specific ligand binding sites on protein surfaces. Nat. Biotechnol. 15:264–268. [DOI] [PubMed] [Google Scholar]
- 17.Sanschagrin, P. C., and L. A. Kuhn. 1998. Cluster analysis of consensus water sites in thrombin and trypsin shows conservation between serine proteases and contributions to ligand specificity. Protein Sci. 7:2054–2064. [DOI] [PMC free article] [PubMed] [Google Scholar]
- 18.Comeau, S. R., D. Gatchell, S. Vajda, and C. J. Camacho. 2004. ClusPro: an automated docking and discrimination method for the prediction of protein complexes. Bioinformatics. 20:45–50. [DOI] [PubMed] [Google Scholar]
- 19.Ten Eyck, L. F., J. Mandell, V. A. Roberts, and M. E. Pique. 1995. Surveying molecular interactions with DOT. In Proceedings of the 1995 ACM/IEEE Supercomputing Conference. A. Hayes and M. Simmons, editors. ACM Press, New York.
- 20.Zhang, C., G. Vasmatzis, and J. L. Cornette. 1997. Determination of atomic desolvation energies from the structures of crystallized proteins. J. Mol. Biol. 267:707–726. [DOI] [PubMed] [Google Scholar]
- 21.Camacho, C. J., D. W. Gatchell, S. R. Kimura, and S. Vajda. 2000. Scoring docked conformations generated by rigid-body protein-protein docking. Proteins. 40:525–537. [DOI] [PubMed] [Google Scholar]
- 22.Camacho, C. J., and D. Gatchell. 2003. Successful discrimination of protein interactions. Proteins. 40:525–537. [DOI] [PubMed] [Google Scholar]
- 23.Mendez, R., R. Leplae, L. De Maria, and S. J. Wodak. 2003. Assessment of blind predictions of protein-protein interactions: current status of docking methods. Proteins. 52:51–67. [DOI] [PubMed] [Google Scholar]
- 24.Dennis, S., T. Kortvelyesi, and S. Vajda. 2002. Computational mapping identifies the binding sites of organic solvents on proteins. Proc. Natl. Acad. Sci. USA. 99:4290–4295. [DOI] [PMC free article] [PubMed] [Google Scholar]
- 25.Kortvelyesi, T., S. Dennis, M. Silberstein, L. Brown III, and S. Vajda. 2003. Algorithms for computational solvent mapping of proteins. Proteins. 51:340–351. [DOI] [PubMed] [Google Scholar]
- 26.Silberstein, M., S. Dennis, L. Brown III, T. Kortvelyesi, K. Clodfelter, and S. Vajda. 2003. Identification of substrate binding sites in enzymes by computational solvent mapping. J. Mol. Biol. 332:1095–1113. [DOI] [PubMed] [Google Scholar]
- 27.Vakser, I. A. 1995. Protein docking for low-resolution structures. Protein Eng. 8:371–377. [DOI] [PubMed] [Google Scholar]
- 28.Chen, R., J. Mintseris, J. Janin, and Z. Weng. 2003. A protein-protein docking benchmark. Proteins. 52:88–91. [DOI] [PubMed] [Google Scholar]
- 29.Chen, R., and Z. Weng. 2003. A novel shape complementarity scoring function for protein-protein docking. Proteins. 51:397–408. [DOI] [PubMed] [Google Scholar]
- 30.Graille, M., C. Z. Zhou, V. Receveur, B. Collinet, N. Declerck, and H. van Tilbeurgh. 2005. Activation of the LicT transcriptional antiterminator involves a domain swing/lock mechanism provoking massive structural changes. J. Biol. Chem. 280:14780–14789. [DOI] [PubMed] [Google Scholar]
- 31.Takagi, J., Y. Yang, J. H. Liu, J. H. Wang, and T. A. Springer. 2003. Complex between nidogen and laminin fragments reveals a paradigmatic β-propeller interface. Nature. 424:969–974. [DOI] [PubMed] [Google Scholar]
- 32.Rajamani, D., S. Thiel, S. Vajda, and C. J. Camacho. 2004. Anchor residues in protein-protein interactions. Proc. Natl. Acad. Sci. USA. 101:11287–11292. [DOI] [PMC free article] [PubMed] [Google Scholar]
- 33.Sheu, S.-H., T. Kaya, D. J. Waxman, and S. Vajda. 2005. Exploring the binding site structure of the PPAR-γ ligand binding domain by computational solvent mapping. Biochemistry. 44:1193–1209. [DOI] [PubMed] [Google Scholar]