Abstract
Simulation and modeling is becoming more and more important when studying complex biochemical systems. Most often, ordinary differential equations are employed for this purpose. However, these are only applicable when the numbers of participating molecules in the biochemical systems are large enough to be treated as concentrations. For smaller systems, stochastic simulations on discrete particle basis are more accurate. Unfortunately, there are no general rules for determining which method should be employed for exactly which problem to get the most realistic result. Therefore, we study the transition from stochastic to deterministic behavior in a widely studied system, namely the signal transduction via calcium, especially calcium oscillations. We observe that the transition occurs within a range of particle numbers, which roughly corresponds to the number of receptors and channels in the cell, and depends heavily on the attractive properties of the phase space of the respective systems dynamics. We conclude that the attractive properties of a system, expressed, e.g., by the divergence of the system, are a good measure for determining which simulation algorithm is appropriate in terms of speed and realism.
INTRODUCTION
Improved experimental technology has led to the possibility of studying increasingly large biochemical systems in vivo. However, the experimental results are often very complex, which is of course due to the underlying complexity of the biochemistry in the living cell itself. This has resulted in the more and more heavy use of computational means to support experimental investigations. Simulation and modeling are now being employed regularly to understand the dynamic properties of a biochemical network. The integration of experimental and computational approaches for the investigation of biochemical systems has been termed systems biology. One problem of computational investigations is that the choice of, e.g., the simulation method relies on rather heuristic, if any, rules. However, the more intensive use of these methods asks for reliable and analytical decisions.
Simulations of biochemical systems have mostly been performed by integrating ordinary differential equations (ODEs) or stochastic algorithms. When using ODEs one computes continuous concentrations of the participating species. The integration is very fast, but of course it is only suitable when the participating molecule numbers are high enough to be approximated as concentrations. For low particle numbers, stochastic algorithms that compute discrete particle numbers are more accurate, but also computationally expensive. The decision regarding which of these methods to employ to get a realistic result and at the same time to use the fastest possible method for this goal has commonly been made using intuition because there are no reliable and rational rules.
To compensate for some of the computational expenses of the stochastic methodologies, approximate stochastic methods (1,2) and hybrid methods (3–5) have been developed recently. The approximate stochastic methods try to speed up the stochastic simulation by sacrificing exactness whereas the hybrid methods treat parts of the system deterministically and other parts stochastically. The hybrid methods need to partition the system into a deterministic and a stochastic subsystem. Again, this is so far mostly done rather heuristically by considering the velocity of reactions or the particle numbers of involved species.
This heuristics is partially justified because there are already a lot of heuristics and simplifications involved when setting up the model itself. One example of this is the inclusion or negligence of spatial dimensions in the model. If space is considered as well, the system can be described by ODEs, partial differential equations, or the respective stochastic algorithm. However, even though space doubtlessly plays a very important role in the functioning of the cell, many models are built assuming homogeneity of the system. This is due to multiple reasons. First of all, even modern experimental technology still prevents the observation of spatially localized concentration changes in the cell for many species. Therefore, spatially resolved experimental data are still rare. Second, many questions concerning, e.g., biochemical mechanisms in small cells like the or leukocytes hepatocytes discussed below can be answered to some extent with the homogeneity assumption (e.g., (6)) saving computational time. Still, neglecting the spatial dimension of the system is almost always a severe simplification.
Nevertheless, the simplifications and assumptions made while setting up a model are usually thought through and actively done by the scientist who is studying the respective biochemical system. However, the choice of the suitable simulation method is often more passively done because explicit knowledge about when which method is the appropriate one is largely missing. Gonze et al. related the appropriateness of deterministic simulations to the rate constants in a model of the circadian rhythm (7). However, a generalization of this result for any model is hard to infer.
Therefore, we think that it is of general interest to find a rational basis to actively decide for or against a specific simulation method. This basis should allow the scientist to select the best methodology for his/her specific model with all its assumptions and simplifications.
We therefore studied the transition between stochastic and deterministic behavior in a common model system, namely calcium oscillations, to find a measure that supports this decision process. The findings should not only be applicable for the specific system studied, but also for other systems as well.
Calcium ions act as second messengers in a variety of cell types (8). They influence cellular functions such as excitability, contraction, metabolism, or exocytosis directly via the modification of enzymatic functions or gene expression (8). Calcium ions are therefore an integral part of the information-processing machinery in living organisms.
Due to its central importance, the function of calcium as second messenger has been studied intensively, e.g., in hepatocytes. In this cell type, the principal chain of events occurring during calcium signal transduction is rather well known. Upon binding of agonist, e.g., a hormone to its specific receptor at cell membrane level, a receptor-coupled G-protein is activated. Its Gα-subunit in turn activates phospholipase C (PLC), which then leads to the production of IP3, which diffuses through the cell and binds to receptors at the endoplasmic reticulum. This leads to the liberation of calcium from endoplasmic reticulum and in some cases to the inflow of calcium from extracellular space.
The rise of calcium concentration in the cytosol is, however, not uniform. In most cases, the calcium concentration oscillates in response to receptor stimulation. Information is encoded in the frequency of these oscillations (e.g., (9–12)). Moreover, there are indications that qualitative differences in the shape of the oscillations are also important for conveying information through the cell. The shape of the oscillations varies from simple periodic (spiking) oscillations to more complex oscillations with secondary oscillations (bursting) and depends on the agonist, which stimulates calcium signal transduction. Stimulation of hepatocytes with, e.g., vasopressin results in spiking calcium oscillations (13). When stimulated with ATP, bursting oscillations are observed (14). These differences in dynamic behavior offer an explanation for the differences in physiological response, which occur when different stimuli are applied. Recently, it has been shown how diverse different calcium signals can be easily decoded by calcium-binding proteins making use of the cooperative nature of calcium binding (15).
Many models have been developed to explain the occurrence of calcium oscillations in the cell (for review, see Dupont et al. and others (16,17)). Most of these models focus on the stimulation of simple periodic oscillations (spiking). Only few models are able to display periodic (18–21), let alone aperiodic bursting oscillations (20,21) in nonexcitable cells. One of these models is able to display simple and complex behavior, depending on the kinetics of the receptor complex and thus depending on the agonist-specific receptor, as occurs in real cells (20).
The number of receptors and ion channels in the cell can be very low (in the range of 103–105 per cell), which leads to the question of whether the deterministic approaches used for modeling and simulating this system are valid and to what degree they are valid.
Stochastic simulations of calcium oscillations have been performed in the case of spiking oscillations (e.g., (22,23)). However, in these cases, no detailed comparison to deterministic simulations has been done. In the case of bursting calcium oscillations, no simulations on discrete particle basis of a system displaying deterministic bursting have been reported at all. However, Falcke et al. showed that bursting behavior can arise during the stochastic simulation of spiking (24,25). Falcke and others also studied under which conditions a deterministic description of calcium concentrations based on channel kinetics is appropriate (25–27). Knowledge like this is necessary to decide which simulation method should be used for a particular system and its particular behavior.
With this in mind, we have studied the stochastic simulation of spiking and bursting calcium oscillations and the transition from stochastic to deterministic behavior. We present experimental data on bursting calcium oscillations that exemplify the need to perform stochastic simulations. For the computational side we used tools developed recently to automatically convert the corresponding differential equations to the stochastic discrete equations and to perform the simulations. We observed a transition at particle numbers in the range of actual particle numbers in the cell.
The transition became apparent, when we compared the results obtained by stochastic, discrete simulations according to Gillespie (28) and the numerical integration of ODEs. For high particle numbers the resulting simulations were basically the same. However, gradually lowering the number of particles, some significant differences between both computational approaches emerged. Therefore, we defined a transition range as the approximate number of particles at which significant differences between stochastic and deterministic simulation start to occur (the solutions do not match anymore). Minute fluctuations of the trajectory are not considered. It is of special interest to analyze whether this transition range depends on the complexity of calcium oscillations. Our results show that the transition range indeed changes with changing dynamics of the system. Thus, the transition range cannot be generally determined for a system being valid for all parameter values, but is dependent on the individual dynamics of a certain parameter set. However, it is not the degree of complexity (e.g., complex periodic versus simple periodic behavior) that determines the transition range. Our results show that it is rather the attractive property of the respective phase space that plays a more important role than the complexity of Ca2+ oscillations. The attractive properties of the phase space have been quantified by the sum of Lyapunov exponents (the divergence). Our results indicate that at lower divergence the transition from stochastic to deterministic behavior occurs at lower particle numbers, which means that the system is well characterized by ODEs at realistic particle numbers. At higher divergence values the transition occurs at significantly higher particle numbers, which indicates the need to employ stochastic modeling. These findings are in accordance with the experimental observation that apparently stochastic behavior is more common in bursting calcium oscillations during high agonist doses, which corresponds to high divergence value in the corresponding model. The results were also verified with other models and should apply for many types of biochemical models.
MATERIALS AND METHODS
Computations
Deterministic simulations were performed by numerically integrating ODEs with the Rosenbrock and LSODE algorithm.
For the stochastic simulations, we used the stochastic algorithm developed by Gillespie (28). A reaction propensity aμ is assigned to each reaction on a particle level:
 |
(1) |
where
 |
(2) |
and
 |
(3) |
In the above, the reaction index μ ranges from 1 to M, because we have M reactions in the system. The rate kμ includes any complex factors that might arise from the kinetics of the reaction. Each reaction μ has Kμ reactants, i.e., substrate molecules, taking part. There are Lμ different types of reactants and for each type,  is the stoichiometric number, i.e., the number of identical reactant molecules.
Thus  The numbers Yj refer to the total particle number present, in the volume of interest V, of each reactant j.
The propensity aμ determines the probability of a reaction of the specific type within the next infinitesimal time step. This probability is therefore proportional to the reaction rate, factors arising from the kinetics, the molecularity, and a factor involving the total number of each particle that potentially could react. Instead of solving the master equation, the Gillespie algorithm simulates the reaction trajectory as follows:
- First, the sum of all propensities for the M possible individual reactions is calculated:

(4) - The stochastic time step is calculated:
Here ξ1 is denoting a uniformly distributed random number in the range ]0, 1].
(5) - Finally, the reaction taking place is determined. For this purpose, a second uniformly distributed random number ξ2 is generated and the reaction μ chosen according to the following criteria:

(6)
The corresponding reaction is realized, i.e., the number of the participating molecules is increased or decreased according to the stoichiometry, and the time is incremented by Δt. The whole process (1–3) is repeated as many times as necessary to reach the desired simulation time. On the basis of this algorithm, software was implemented, which is able to automatically convert a system of differential equations into the corresponding stochastic system and to perform the stochastic simulations (e.g., STODE, which is freely available from the authors (http://projects.villa-bosch.de/bcb/software) or Copasi (http://www.copasi.org)).
Experimental
Single hepatocytes were isolated from fed, male Wistar-strain rats (150–250 g) by collagenase perfusion as described previously (29). Briefly, the hepatic portal vein was cannulated and an initial Ca2+-free perfusion was followed by perfusion with collagenase (0.04% w/v) and Ca2+ (3.8 mM) for 15 min. The perfusion rate was 30 ml/min throughout. The cells were harvested and incubated at 37°C at low density (103 cells per milliliter) in 2% type IX agarose in William's medium E (WME). Single hepatocytes were prepared for microinjection with the bioluminescent Ca2+ indicator aequorin, as described previously (30). The injected cell was transferred to a perfusable cup held at 37°C, positioned under a cooled, low-noise photomultiplier, and continuously superfused with WME, to which agonists were added. Photon counts were sampled every 50 ms by computer. At the end of an experiment, the total aequorin content of each cell was determined by discharging the aequorin by lysing the cell. The data were normalized retrospectively by computer, by calculating the photon counts per second divided by the total counts remaining. The computed fractional rate of aequorin consumption could then be plotted as [Ca2+]i using in vitro calibration data and exponential smoothing with time constants: for resting [Ca2+]i, 12 s; for transients, 1 s.
Materials
Aequorin was provided by Professor O. Shimomura (Marine Biological Laboratory, Woods Hole, MA). Collagenase was obtained from Roche Diagnostics (Lewes, UK) and WME from Invitrogen (Paisley, UK). Agarose and agonists were purchased from Sigma-Aldrich (Poole, UK).
RESULTS
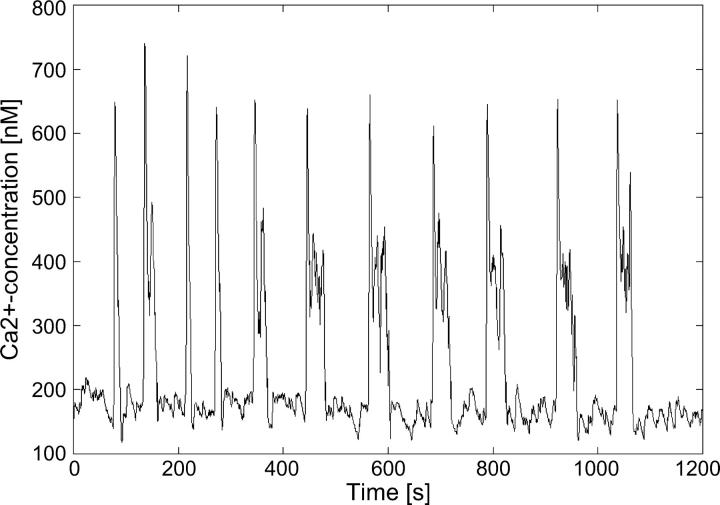
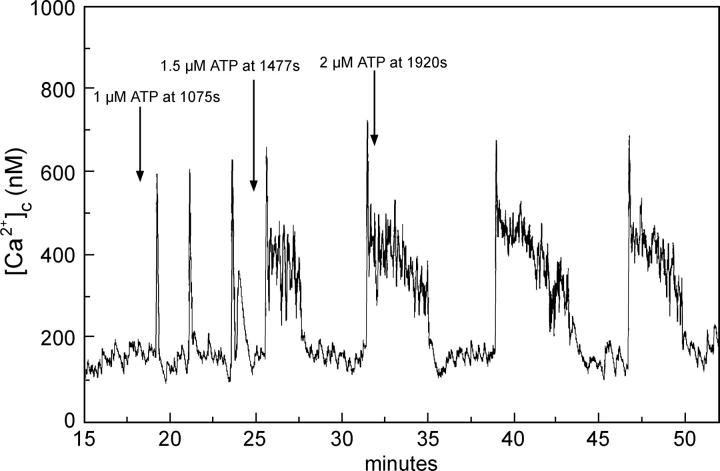
Using ATP as the agonist for the activation of hepatocytes results in bursting calcium oscillations for a wide range of concentrations. An example for a low dose (1.2 μM) of ATP is shown in Fig. 1. Each main spike is followed by a series of secondary oscillations. The overall oscillation is by no means periodic and the number of secondary oscillations varies. Increasing the agonist concentration successively results in bursting oscillations, with increasing amounts and length of secondary oscillations on average (Fig. 2). These bursts are irregular in their nature, meaning that the amplitude of the secondary oscillations are not simply decreasing with time.
FIGURE 1.
Experimentally measured calcium concentration in hepatocytes with 1.2 μM ATP added.
FIGURE 2.
Experimentally measured calcium concentration in hepatocytes with increasing amounts of ATP added as indicated.
Modeling these bursting oscillations in hepatocytes has so far never been able to account for the long stretches of secondary oscillations seen in these time series and only models generating chaotic bursting have been able to account for some of the nonperiodicities visible. Prolonged secondary oscillations might carry important information for the cell because, e.g., a very prolonged elevated level of calcium concentration in the cell can be responsible for apoptosis (8).
For a detailed computational analysis of calcium oscillations in hepatocytes, we restrict ourselves firsthand to using a core model developed by Kummer et al. (20). This model captures the basic dynamic characteristics of the complete model. Later on, we will see that our findings also hold true for more detailed, physiological models. The core model is represented by three ODEs.
 |
(7-9) |
where Gα denotes the active subunit of the G-protein, PLC* the activated form of PLC, and Ca the cytosolic calcium concentration.
Gα is activated upon binding of an agonist (included in k2) and this process is autocatalytic. There is also a small term (k1) for the spontaneous activation of Gα. It is inactivated via two processes, one being activated by Ca (via phosphokinase C) and one by PLC*. PLC is activated by Gα and inactivated by a simple enzymatic reaction. Finally Gα also triggers the increase of calcium concentration in the cytosol and calcium is removed by an active transport mechanism.
Again, it has to be emphasized that this model is a simplified picture and does not include all the processes that are known to occur in the context of calcium signal transduction. Especially, one variable, namely IP3 has been eliminated completely. For a more detailed and more realistic model, see, e.g., Larsen et al. (15). However, the basic dynamical characteristics are captured in this model (as was shown in Kummer et al. (20)) and therefore we use it to study the transition from stochastic to deterministic behavior in dependence on the system dynamics.
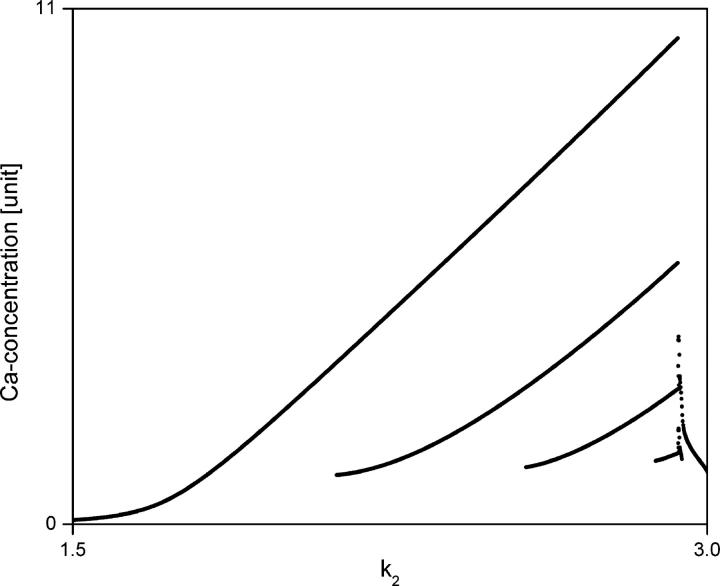
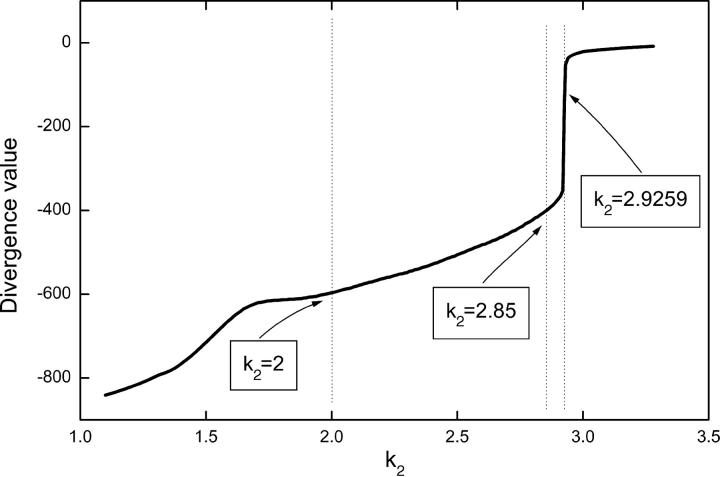
The bifurcation diagram of the model is shown in Fig. 3. At smaller values of k2 the system behavior is characterized by simple periodic spiking Ca2+ oscillations. By increasing the value of k2 periodic bursting Ca2+ oscillations appear, and a period adding route leads to a very small chaotic regime around k2 = 2.9259. Beyond the chaotic regime there is again a small periodic regime before the system settles into a steady state.
FIGURE 3.
Bifurcation diagram of the core model for bursting calcium oscillations (Eqs. 7–9). Parameters are: k1 = 0.212, k3 = 1.52, K4 = 0.19, k5 = 4.88, K6 = 1.18, k7 = 1.24, k8 = 32.24, K9 = 29.09, k10 = 13.58, k11 = 153, K12 = 0.16. Initial conditions are: a = 0.01, b = 0.01, c = 0.01.
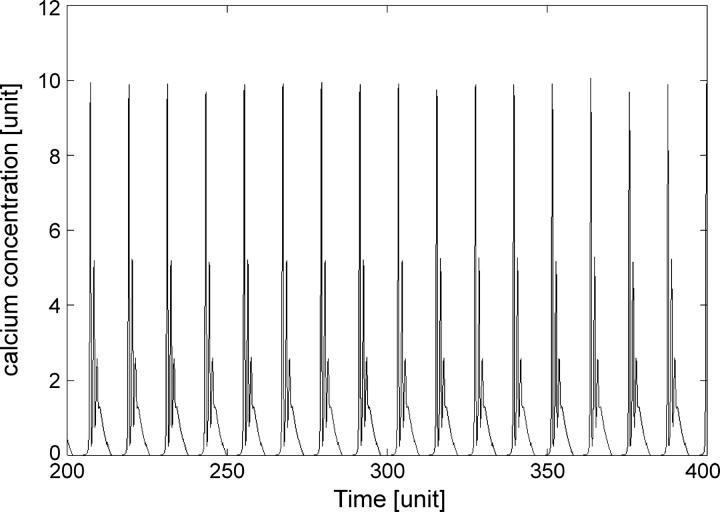
In Fig. 4 we show an example of deterministically simulated periodic bursting oscillations for k2 = 2.85.
FIGURE 4.
Deterministic simulation of periodic bursting of calcium concentration. Parameters as in Fig. 1; k2 = 2.85, Div = −401.9.
We simulated the same time series as obtained by the ODEs (e.g., Fig. 4) on particle basis with the stochastic algorithm described above. We varied the number of participating particles to study the transition from deterministic to stochastic behavior with decreasing particle numbers. In the following, we will emphasize the number of calcium ions in the system. However, we want to point out that the number of particles of the other participating species is in the same range or higher (depending on the parameters) in this simple model system. Therefore, we focus on the species with the lowest particle numbers. This was achieved by changing the volume of the system and leaving the concentration constant. Computationally, this is equivalent to letting the volume constant and changing the particle number in this volume plus adjusting the kinetic parameters such that the same qualitative systems behavior will arise. Otherwise, just changing the particle number in the same constant volume will of course result in completely different behavior.
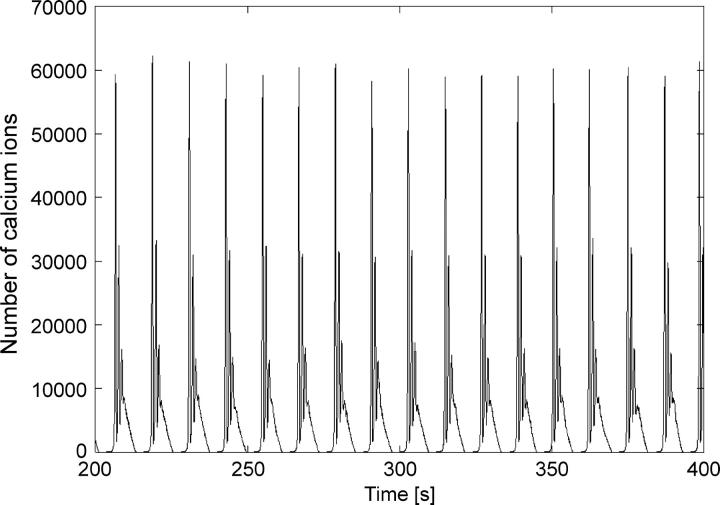
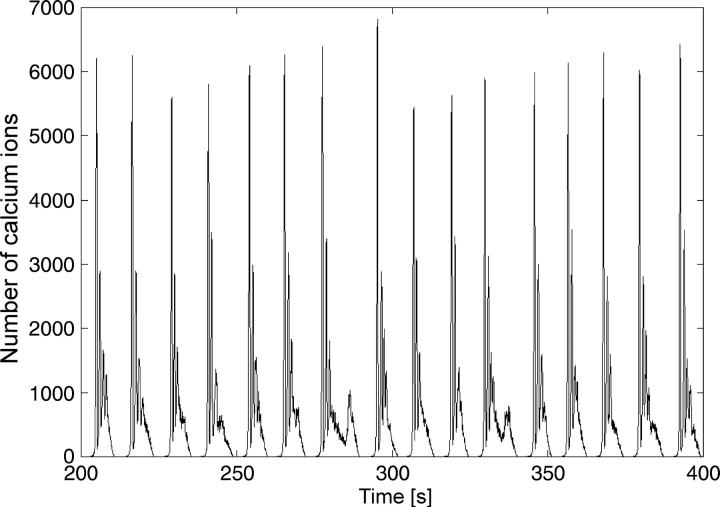
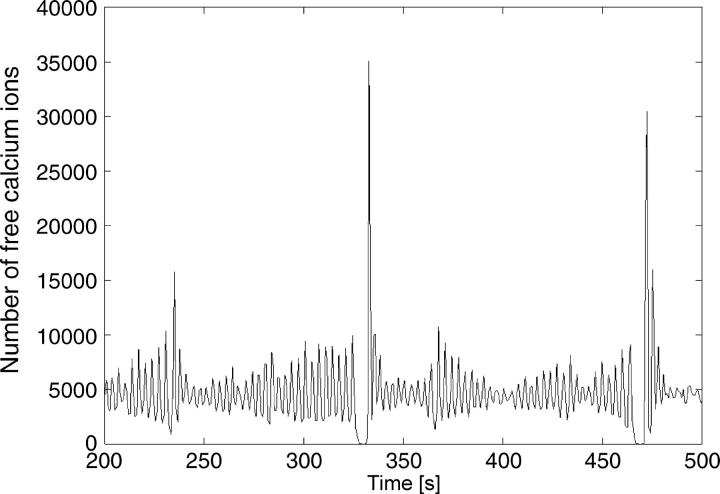
The results of the stochastic simulations for k2 = 2.85 are presented in Figs. 5 and 6 for different particle numbers.
FIGURE 5.
Stochastic simulation of bursting calcium oscillations close to the deterministic limit. Parameters as in Fig. 4.
FIGURE 6.
Stochastic simulation of bursting calcium oscillations with lower particle numbers compared to Fig. 5. Parameters as in Fig. 4.
Fig. 5 shows that for large particle numbers the particle-based simulations approach the deterministic limit, which is in accordance with theory. The question arises, however, of how to determine the transition between stochastic and deterministic behavior. This is usually a continuous convergence and it is difficult to exactly determine the transition. Therefore, it is reasonable to introduce a transition range as the approximate number of particles at which differences between stochastic and deterministic behavior become negligible. To estimate the particle number in the transition range between stochastic and deterministic behavior, we studied the use of standard approaches for estimating differences between noisy signals and the respective deterministic signal. All of these standard approaches like autocorrelation functions, signal/noise ratio, or interspike interval histograms (ISIH) face strong limitations in this case. The reason is that in many cases the stochastic simulation does not result simply in a noisy version of the deterministic limit (as shown below). It is rather apparent that the stochasticity of the system often results in completely different dynamics compared to the deterministic solution. However, the global character of the solution (the attractor) is underrepresented when considering the above-mentioned standard approaches. Thus, on one hand, a noisy limit cycle will result, e.g., in a very different ISIH compared to the deterministic solution even if the coarse limit cycle is the same. On the other hand, a comparison between different attractors will of course also result in a very different ISIH. Thus, it is almost impossible to differentiate between a solution that displays a completely different attractor and a solution that still displays the global attractive properties of the deterministic solution, but has added noise. However, a scientist modeling a system will most certainly choose the faster deterministic simulation, if the global picture of the simulation is accurate. A better method would be to use a similarity measure of the global attractors resulting from the different simulations as such. Few approaches for such a similarity measure are described in literature so far (e.g., (31,32)). These need extensive sets of data that are hard to create in stochastic simulations due to the computational expense. Therefore, for this study, we restrict ourselves to matching the solutions in a graphical and/or visual way. However, we want to include and develop such global similarity measures in future studies.
For spiking (k2 = 2.0) and periodic bursting oscillations (k2 = 2.85) with ten-thousands of particles, only small fluctuations in the amplitude are observed. However, decreasing the particle number to thousands leads to a system already showing significant stochastic influence (Fig. 6). Stochastic influences are big variations in the amplitude and period as well as prolonged secondary oscillations during bursting behavior like those seen in the experimental investigations. The transition from deterministic to stochastic behavior occurs in this case in the range of tens of thousands of particles.
For chaotic bursting Ca2+ oscillations at k2 = 2.9259 deterministic-like behavior was observed only down to a number of particles in the range of hundreds of thousands. Decreasing the particle numbers down to tens of thousands already showed significant stochastic influences, e.g., a phase space that corresponds more to a noisy limit cycle rather than to a chaotic attractor, i.e., hardly any amplitude variations. Decreasing the particle numbers even further leads to additional prolonged secondary oscillations. Of course, there is no possibility to simply match the deterministic and the stochastic simulation in this case like done above. Therefore, and to get an estimate, we relied on visual inspection taking, e.g., prolonged secondary oscillations as signs for stochasticity. These signs ceased to appear in the range of hundreds of thousands of particles in the system in the parameter regime where chaos is displayed in the deterministic limit.
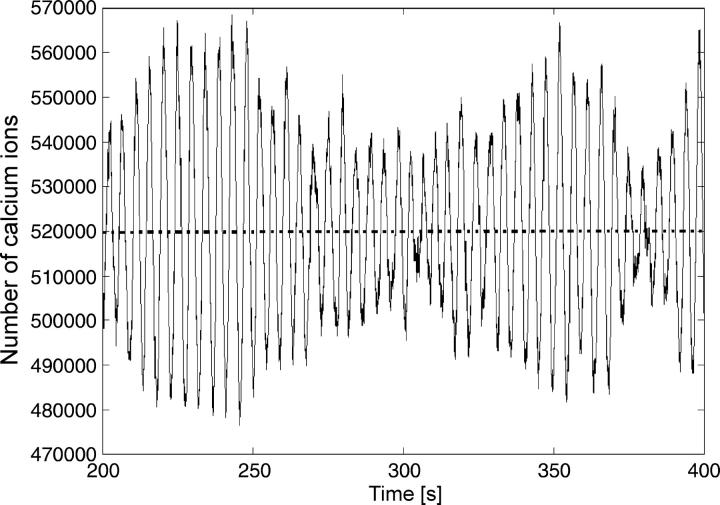
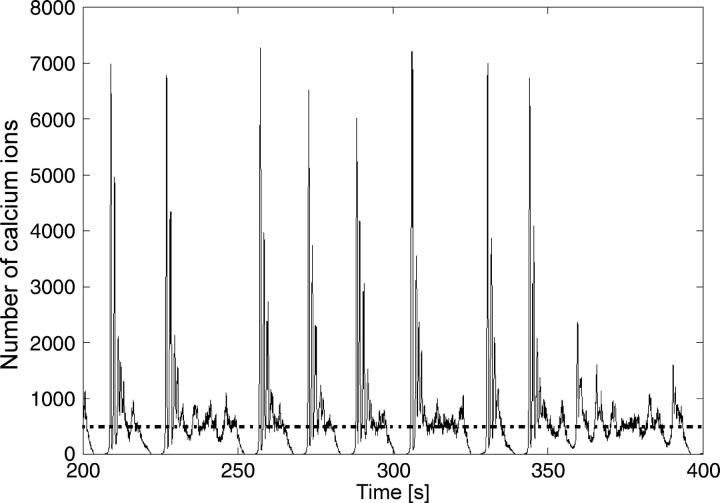
For the steady state at k2 = 3.0, we observe that even higher numbers of particles are needed to approach the deterministic limit (Figs. 7 and 8). The deterministic limit is not reached with particle numbers in the high hundred-thousands, which is well above the physiological range. Moreover, for lower particle numbers, qualitative behavior is observed that again displays most of the characteristics of the complex periodic regime (Fig. 8).
FIGURE 7.
Stochastic simulation of calcium behavior corresponding to parameters for which the deterministic solution is a steady state (k2 = 3.0) with particle numbers far above physiological concentrations. The dashed line indicates the deterministic steady state.
FIGURE 8.
Stochastic simulation of calcium behavior corresponding to parameters for which the deterministic solution is a steady state (k2 = 3.0) with lower particle numbers compared to Fig. 7. The dashed line indicates the deterministic steady state.
The above findings are summarized in Table 1. For different values of k2, which correspond to different behaviors of the system, the number of particles is estimated at which the transition between stochastic and deterministic behavior appears.
TABLE 1.
Transition ranges in dependence on k2
| k2 | Number of particles | Behavior |
|---|---|---|
| 2.0 | Ten-thousands | Periodic spiking |
| 2.85 | Ten-thousands | Periodic bursting |
| 2.9259 | Hundred-thousands | Chaos |
| 2.99 | Millions | Regular oscillations |
| 3.0 | Greater than millions | Steady state |
To explain the results presented in Table 1 we estimate the attractive properties of the phase space for different values of k2. The hypothesis is that the stochastic influences could be more pronounced in case of weaker attractive properties of the phase space. Hence, in a weaker attractive phase space a higher number of particles would be needed to reach the deterministic limit. We use the sum of Lyapunov exponents (the divergence) for estimating the attractive properties of the phase space. By varying the parameter value of k2 and corresponding to the different types of oscillations described above, different values of divergence (Fig. 9) were computed. Fig. 9 shows that the value of divergence approaches zero with increasing values of k2. By comparing Fig. 9 with Table 1, we observe that the sensitivity of the system to stochastic influences increases with increasing divergence. This means that for a dynamic state representative of a highly negative divergence value the system is well described by deterministic methods even for relatively low (thousands) particle numbers whereas higher particle numbers are needed to approach the deterministic limit if the divergence of the system is close to zero.
FIGURE 9.
Divergence value of the core model for bursting calcium oscillations. Parameters as in Fig. 3.
To verify that these findings are not restricted to our small core model, we additionally analyzed a completely different model of Ca2+ oscillations proposed by Shen and Larter (18). Likewise, a model of the peroxidase-oxidase reaction (33) was studied (data not shown). This system describes the oxidation of NADH catalyzed by peroxidases. We observed again that the number of particles required to obtain results matching the corresponding deterministic solutions is directly related to the divergence of the attractors, as already described above. A divergence value close to zero implies that the attractor is weak and can easily be altered by the stochastic fluctuations.
Finally, we studied the influence of calcium buffers in the cell. For this purpose, we included a simple linear equation for the binding and release of calcium to protein buffers with the latter being present in large quantities compared to calcium and therefore assumed to have a constant concentration. Thus, the equations for calcium concentration reads:
 |
(10) |
with P representing the calcium concentration bound to protein buffers.
The inclusion of this simple term leads to a decrease in divergence, because the partial derivation of the equation describing the evolution of the calcium concentration becomes more negative and this feeds into the sum of the Lyapunov exponents. This means that according to our hypothesis the sensitivity toward stochasticity should decrease as well. Indeed, this is the case. However, even with ∼80% of the calcium being bound to these buffers, the systems behavior is still strongly influenced whenever the divergence of the system is large (e.g., for k2 = 3). Fig. 10 shows that in this case the high-frequent part of the noise in the system is filtered out by the participating buffer (compared to Fig. 6). Nevertheless, the system is still not running into a steady state as it would be when calculated deterministically, but rather it shows complex bursting oscillations.
FIGURE 10.
Stochastic simulation of calcium behavior corresponding to the core model with parameters as in Fig. 3, including binding of calcium ions to protein buffers (Eq. 10; k13 = 10, k14 = 1). Please note that the total calcium ion concentration is by far higher because ∼80% are bound to protein buffers in this case.
DISCUSSION
We studied the transition from deterministic to stochastic behavior in simulations of Ca2+ oscillations on a particle basis. We mainly used the model developed by Kummer et al. (20) and studied here in detail the dependency of the transition on the system properties. We observed that the transition from stochastic to deterministic behavior depends heavily on the attractive properties of the corresponding attractors in phase space, quantified by the divergence. We conclude that the divergence plays a more important role in determining the transition range from stochastic to deterministic behavior than the complexity of the Ca2+ oscillations. The transition occurs at higher particle numbers if the corresponding value of the divergence is close to zero compared to the particle numbers needed when the system has a highly negative divergence. Comparing the ranges of particle numbers sensitive to stochastic influences, we observe that oscillations characterized by a divergence close to zero show a 10–100-fold larger sensitivity compared to the oscillations with highly negative divergence in the presented case study.
The real particle numbers in calcium signal transduction correspond roughly to the transition number in the cases with low divergence, namely simple periodic and complex periodic oscillations. This is especially true for a model in which calcium buffers are included. However, the number of particles needed to reach the deterministic limit in cases with high divergence values (chaotic, regular oscillations, steady state) is far above the concentrations of receptors, channels, and calcium ions in the real cell, even if buffers are included in the model. This is also in accordance with the experimental observation that at high agonist concentrations that correspond to high divergence values in our model, more apparent stochastic influences are visible. Therefore, one can argue on the one hand, that the stochastic influence during simple periodic and complex periodic behavior should not be tremendous, because the real particle numbers are not well below the transition range. On the other hand, pronounced stochastic effects should be present in the real system for high agonist concentrations (corresponding to a high value of k2). However, because the studied model is rather qualitative in its nature, more studies with more realistic models are needed to clarify this point in sufficient detail. The important issue here is that the transition from stochastic to deterministic behavior for certain systems dynamics in general occurs clearly above physiological concentrations and the resulting stochasticity in the system might be of physiological importance. This is especially true for physiological effects that result from the prolonged secondary oscillations of the bursting calcium oscillations as described above. Interestingly, such prolonged secondary oscillations have often been observed experimentally (e.g., (34)). If the elevated level of calcium concentration is sustained for considerable time, it will result in different biochemical responses in the cell, e.g., in cell death (35).
Our findings, showing that transition from stochastic to deterministic behavior occurs at higher particle numbers if the corresponding value of the divergence is close to zero, can also be explained intuitively. If the contractive properties of an attractor in phase space are weak, then the attractor can be more easily deformed, if perturbed continuously, which is the case when studying stochastic simulations. Recently, it has been shown that Ca2+ oscillations are more flexible in response to external forcing if the divergence takes values close to zero (36,37). Moreover, it has been shown that the flexibility of Ca2+ oscillations does not significantly depend on the type of Ca2+ oscillations. Therefore, we argue that in the case of determining the transition from stochastic to deterministic behavior the divergence plays a major role.
In the studied systems, no noise-induced chaos has been found as reported in a number of cases (for a review, see Gao et al. (38)). However, it has been observed in earlier studies that adding noise to a periodic bursting calcium oscillation could result in deterministic chaotic oscillations (39).
Our results show that it is not sufficient to decide in favor of or against the stochastic simulation of a system on the basis of knowing the number of particles for a certain model in general, but it rather demands taking into account the specific dynamics of the model and the attractive properties of a particular oscillatory regime. Moreover, relatively large concentrations (corresponding to nanomolar and millimolar), which often are simulated deterministically, already show a pronounced sensitivity toward stochasticity. Therefore, a careful analysis of this sensitivity should preclude a decision for a certain simulation method in the case of simulating calcium oscillations. Because our results are very general in their nature, this holds for other simulations of biochemical systems as well. Calculating the divergence of the system as one measure for the decision in favor of or against a specific simulation methodology could be easily automated. This could be included in corresponding software packages to aid the user in his/her decision process. Moreover, calculating the divergence on the basis of deterministic simulations is computationally fast compared to many trials of stochastic simulations that would be needed to just try out which method is more appropriate. It is also possible to compute the sensitivity of the divergence with respect to different parameters of the system, which gives a more general view on how robust the decision for or against a specific simulation method is when parameters are changed. However, we also would like to point out, that the absolute values of the divergence might be insufficient as a basis for the decision process, if a system contains, e.g., very positive and very negative Lyapunov exponents at the same time (which was not the case in the studied examples). In this case, a weighting of these individual components might be necessary, which is a topic of our future research. In addition, bistable systems require also a special treatment. Such systems will display both stable solutions when different runs of stochastic simulations are performed whereas, e.g., the initial conditions have to be changed in the deterministic approach to gain the same kind of information. However, the appearance of the individual solution is again subject to similar criteria as described above. Moreover, in the case of a stable steady-state solution with no proximity to any other type of solution (e.g., oscillations), there are cases where the amplitude of the noise due to a stochastic simulation around this steady state stays the same, independent of the divergence of the system (as in the simple system A ⇔ B with influx of A and efflux of B, if all rates are altered such that their ratio stays the same). However, due to the attractive properties of the respective steady state, which is again dependent on the divergence, the individual trajectory is able to stay away from the steady state much longer if the divergence is high compared to a system with rates corresponding to a low divergence. Thus, if simulating a short time span representing a real world example, the stochastic simulation of the system with low divergence will quickly fluctuate around the steady state whereas the system with high divergence might deviate from the steady state for the whole time. Therefore, the computation of the divergence again adds to the knowledge in differentiating between the two simulation methods.
Finally, we want to emphasize that inclusion of a spatial dimension will be an important issue in the future. Particle numbers in small discrete volumes will be even lower than considering the particle numbers for the whole cell. We think that at least for systems described by diffusively coupled ODEs, our findings will still be applicable, but this will be a matter of future investigations.
Acknowledgments
We acknowledge Carel van Gend for fruitful discussions.
Ursula Kummer and Jürgen Pahle thank the Klaus Tschira Foundation and the German Federal Ministry of Education and Research for funding. Anne K. Green and C. Jane Dixon thank the Wellcome Trust for funding.
References
- 1.Gillespie, D. T. 2001. Approximate accelerated stochastic simulation of chemically reacting systems. J. Chem. Phys. 115:1716–1733. [Google Scholar]
- 2.Resat, H., H. S. Wiley, and D. A. Dixon. 2001. Probability-weighted dynamic Monte Carlo method for reaction kinetics simulations. J. Phys. Chem. B. 105:11026–11034. [Google Scholar]
- 3.Haseltine, E. L., and J. B. Rawlings. 2002. Approximate simulation of coupled fast and slow reactions for stochastic chemical kinetics. J. Chem. Phys. 117:6959–6969. [Google Scholar]
- 4.Puchalka, J., and A. M. Kierzek. 2004. Bridging the gap between stochastic and deterministic regimes in the kinetic simulations of the biochemical reaction networks. Biophys. J. 86:1357–1372. [DOI] [PMC free article] [PubMed] [Google Scholar]
- 5.Vasudeva, K., and U. S. Bhalla. 2004. Adaptive stochastic-deterministic chemical kinetic simulations. Bioinformatics. 20:78–84. [DOI] [PubMed] [Google Scholar]
- 6.Olsen, L. F., U. Kummer, A. L. Kindzelskii, and H. R. Petty. 2003. A model of the oscillatory metabolism of activated neutrophils. Biophys. J. 84:69–81. [DOI] [PMC free article] [PubMed] [Google Scholar]
- 7.Gonze, D., J. Halloy, and A. Goldbeter. 2004. Emergence of coherent oscillations in stochastic models for circadian rhythms. Phys. A. 342:221–233. [Google Scholar]
- 8.Berridge, M. J., M. D. Bootman, and P. Lipp. 1998. Calcium: a life and death signal. Nature. 395:645–648. [DOI] [PubMed] [Google Scholar]
- 9.Li, W. H., J. Llopis, M. Whitney, G. Zlokarnik, and R. Tsien. 1998. Cell-permeant caged InsP3-ester shows that Ca2+ spike frequency can optimize gene expression. Nature. 392:936–944. [DOI] [PubMed] [Google Scholar]
- 10.Dolmetsch, R. E., K. Xu, and R. S. Lewis. 1998. Calcium oscillations increase the efficiency and specificity of gene expression. Nature. 392:933–936. [DOI] [PubMed] [Google Scholar]
- 11.De Koninck, P., and H. Schulman. 1998. Sensitivity of CaM kinase II to the frequency of Ca2+ oscillations. Science. 279:227–230. [DOI] [PubMed] [Google Scholar]
- 12.Oancea, E., and T. Meyer. 1998. Protein kinase C as a molecular machine for decoding calcium and diacylglycerol signals. Cell. 95:307–318. [DOI] [PubMed] [Google Scholar]
- 13.Woods, N. M., K. S. R. Cuthbertson, and P. H. Cobbold. 1986. Repetitive transient rises in cytoplasmic free calcium in hormone-stimulated hepatocytes. Nature. 319:600–602. [DOI] [PubMed] [Google Scholar]
- 14.Dixon, C. J., N. M. Woods, K. S. R. Cuthbertson, and P. H. Cobbold. 1990. Evidence for two Ca2+-mobilizing purinoreceptors on rat hepatocytes. Biochem. J. 269:499–502. [DOI] [PMC free article] [PubMed] [Google Scholar]
- 15.Larsen, A. Z., L. F. Olsen, and U. Kummer. 2004. On the encoding and decoding of calcium signals in hepatocytes. Biophys. Chem. 107:83–99. [DOI] [PubMed] [Google Scholar]
- 16.Dupont, G., S. Swillens, C. Clair, T. Tordjmann, and L. Combettes. 2000. Hierarchical organization of calcium signals in liver cells. Biochim. Biophys. Acta. 1498:134–152. [DOI] [PubMed] [Google Scholar]
- 17.Schuster, S., M. Marhl, and T. Höfer. 2002. Modelling of simple and complex calcium oscillations. Eur. J. Biochem. 269:1333–1355. [DOI] [PubMed] [Google Scholar]
- 18.Shen, P., and R. Larter. 1995. Chaos in intracellular Ca2+ oscillations in a new model for non-excitable cells. Cell Calcium. 17:225–232. [DOI] [PubMed] [Google Scholar]
- 19.Houart, G., G. Dupont, and A. Goldbeter. 1999. Bursting, chaos and birhythmicity originating from self-modulation of the inositol 1,4,5-triphosphate signal in a model for intracellular Ca2+ oscillations. Bull. Math. Biol. 61:507–530. [DOI] [PubMed] [Google Scholar]
- 20.Kummer, U., L. F. Olsen, C. J. Dixon, A. K. Green, E. Bornberg-Bauer, and G. Baier. 2000. Switching from simple to complex oscillations in calcium signaling. Biophys. J. 79:1188–1195. [DOI] [PMC free article] [PubMed] [Google Scholar]
- 21.Marhl, M., T. Haberichter, M. Brumen, and R. Heinrich. 2000. Complex calcium oscillations and the role of mitochondria and cytosolic protein. Biosystems. 57:75–86. [DOI] [PubMed] [Google Scholar]
- 22.Kraus, M., and B. Wolf. 1993. Cytosolic calcium oscillators: critical discussion and stochastic modeling. Biol. Signals. 2:1–15. [DOI] [PubMed] [Google Scholar]
- 23.Prank, K., U. Ahlvers, F. Baumgarte, H. G. Musmann, A. von zur Mühlen, C. Schöfl, and G. Brabant. 1998. Methoden der medizinischer Informatik, Biometrie und Epidemiologie in der modernen Informationsgesellschaft. [in German] Jahrestagung der Deutschen Gesellschaft für Informatik, Biometrie und Epidemiologie, Bremen, Germany.
- 24.Falcke, M. 2003. On the role of stochastic channel behavior in intracellular Ca2+ dynamics. Biophys. J. 84:42–56. [DOI] [PMC free article] [PubMed] [Google Scholar]
- 25.Falcke, M. 2004. Reading the patterns in living cells: the physics of Ca2+ signaling. Adv. Phys. 53:255–440. [Google Scholar]
- 26.Falcke, M. 2003. Deterministic and stochastic models of intracellular Ca2+ waves. N. J. Phys. 5:1–28. [Google Scholar]
- 27.Shuai, J. W., and P. Jung. 2002. Stochastic properties of Ca2+ release of inositol-1,4,5,-trisphosphate receptor clusters. Biophys. J. 83:87–97. [DOI] [PMC free article] [PubMed] [Google Scholar]
- 28.Gillespie, D. T. 1976. A general method for numerically simulating the stochastic time evolution of coupled chemical reactions. J. Comput. Phys. 22:403–434. [Google Scholar]
- 29.Dixon, C. J., P. H. Cobbold, and A. K. Green. 1995. Actions of ADP, but not ATP, on cytosolic free Ca2+ in single rat hepatocytes mimicked by 2-methylthioATP. Br. J. Pharmacol. 116:1979–1984. [DOI] [PMC free article] [PubMed] [Google Scholar]
- 30.Cobbold, P. H., and J. A. C. Lee. 1991. Aequorin measurements of cytoplasmic free calcium. In Cellular Calcium: A Practical Approach. J. G. McCormack, and P. H. Cobbold, editors. I.R.L. Press, Oxford, UK. 55–81.
- 31.Kantz, H. 1994. Quantifying the closeness of fractal measures. Phys. Rev. E. 49:5091–5097. [DOI] [PubMed] [Google Scholar]
- 32.Koussoulos, N. T. 2001. Spectral moments and the analysis of chaotic systems. Int. J. Bifur. & Chaos. 11:2051–2059. [Google Scholar]
- 33.Olsen, L. F., A. Lunding, and U. Kummer. 2003. Mechanism of melatonin-induced oscillations in the peroxidase-oxidase reaction. Arch. Biochem. Biophys. 410:287–295. [DOI] [PubMed] [Google Scholar]
- 34.Green, A. K., P. H. Cobbold, and C. J. Dixon. 1995. Cytosolic free Ca2+ oscillations induced by diadenosine 5′,5‴-P1,P3-triphosphate and diadenosine 5′,5‴-P1,P4-tetraphosphate in single rat hepatocytes are indistinguishable from those induced by ADP and ATP respectively. Biochem. J. 310:629–635. [DOI] [PMC free article] [PubMed] [Google Scholar]
- 35.Nicotera, P., G. Bellomo, and S. Orrenius. 1992. Calcium-mediated mechanisms in chemically induced cell death. Annu. Rev. Pharmacol. Toxicol. 32:449–470. [DOI] [PubMed] [Google Scholar]
- 36.Marhl, M., and S. Schuster. 2003. Under what condition signal transduction pathways are highly flexible in response to external forcing? A case study on calcium oscillations. J. Theor. Biol. 224:491–501. [DOI] [PubMed] [Google Scholar]
- 37.Perc, M., and M. Marhl. 2003. Sensitivity and flexibility of regular and chaotic calcium oscillations. Biophys. Chem. 104:509–522. [DOI] [PubMed] [Google Scholar]
- 38.Gao, J. B., C. C. Chen, S. K. Hwang, and J. M. Liu. 1999. Noise-induced chaos. Int. J. Mod. Phys. B. 13:3283–3305. [Google Scholar]
- 39.Kummer, U., G. Baier, and L. F. Olsen. 2000. Robustness in a model for calcium signal transduction dynamics. In Proceedings of BTK2000: Animating the Cellular Map. J. S. Hofmeyr, J. M. Rohwer, and J. L. Snoep, editors. Stellenbosch University Press, Stellenbosch, South Africa. 171–176.


