

Abstract
The lack of a calcium channel agonist (e.g., BayK8644) for CaV2 channels has impeded their investigation. Roscovitine, a potent inhibitor of cyclin-dependent kinases 1, 2, and 5, has recently been reported to slow the deactivation of P/Q-type calcium channels (CaV2.1). We show that roscovitine also slows deactivation (EC50 ∼53 μM) of N-type calcium channels (CaV2.2) and investigate gating alterations induced by roscovitine. The onset of slowed deactivation was rapid (∼2 s), which contrasts with a slower effect of roscovitine to inhibit N-current (EC50 ∼300 μM). Slow deactivation was specific to roscovitine, since it could not be induced by a closely related cyclin-dependent kinase inhibitor, olomoucine (300 μM). Intracellularly applied roscovitine failed to slow deactivation, which implies an extracellular binding site. The roscovitine-induced slow deactivation was accompanied by a slight left shift in the activation-voltage relationship, slower activation at negative potentials, and increased inactivation. Additional data showed that roscovitine preferentially binds to the open channel to slow deactivation. A model where roscovitine reduced a backward rate constant between two open states was able to reproduce the effect of roscovitine on both activation and deactivation.
INTRODUCTION
The study of L-type calcium channel (CaV1 family) gating and permeation has been greatly facilitated by drugs (e.g., BayK8644, +202–791) that increase channel open time over a wide range of voltages. However, such drugs are ineffective toward the CaV2 family of calcium channels (P/Q-type, N-type, and R-type), which has been one factor limiting studies of these channels. This changed recently with a study by Yan et al. (1) showing that the cyclin-dependent kinase (cdk) inhibitor roscovitine slowed the deactivation of high voltage-activated calcium channels that were insensitive to L-channel blockers. Interestingly the effect of roscovitine did not appear to involve cyclin-dependent kinases since intracellular roscovitine was ineffective and calcium current deactivation was slowed by roscovitine in neurons lacking activated cdk5 (the dominant neuronal cdk) (2). The roscovitine effect was blocked by ω-conotoxin MVIIC (ωCMVIIC), which led the authors to conclude the affected channels were P/Q-type (1). However, the micromolar concentrations of ωCMVIIC used in that study also block N-type channels (3,4). An additional issue not addressed by the original publication was how roscovitine influenced channel gating to slow deactivation. We demonstrate that roscovitine slows deactivation of N-type calcium channels by binding to the open state, and develop a Markov model that reproduces the kinetic effects of roscovitine, which includes the effect on N-current generated during an action potential.
MATERIALS AND METHODS
Cells
Paravertebral sympathetic ganglia were isolated from adult bullfrogs (Rana catesbeiana) and neurons were dissociated with collagenase/dispase digestion and trituration (5–7). The method of sacrifice was approved by the Institutional Animal Care and Use Committee. Cells were maintained in L-15 medium supplemented with 10% fetal bovine serum and penicillin/streptomycin at 4°C until use (usually 2–14 days).
Electrophysiology
Neurons were voltage-clamped using the whole-cell configuration of the patch-clamp technique. Pipettes were pulled from Schott 8250 glass (Garner Glass, Claremont, CA) on a Sutter P-97 puller (Sutter Instruments, Novato, CA). Series resistance ranged from 1.3 to 2.5 MΩ and was compensated at 90–95%. Currents were recorded using an Axopatch 200A amplifier (Axon Instruments, Foster City, CA) and digitized with a MacAdios II analog-digital converter (GW Instruments, Somerville, PA). Experiments were controlled by a Macintosh Quadra 800 computer (Apple Computer, Cupertino, CA) running S3 data acquisition software written by Dr. Stephen Ikeda (National Institutes of Health, National Institute on Alcohol Abuse and Alcoholism, Bethesda, MD). Leak current was subtracted online using a P/4 protocol. All recordings were carried out at room temperature. Whole-cell currents were digitized at 50 kHz after analog filtering at 10 kHz, except for envelope tail and triple pulse inactivation protocols that were digitized at 10 kHz after analog filtering at 10 kHz.
Action potential waveforms (Fig. 8 a) were generated by a series of voltage ramps that reproduce the bullfrog sympathetic neuron action potential (8). The following is a list of the voltage range and duration of the nine voltage ramps used in this waveform: −60 to −25 mV in 1.1 ms, −25 to +37 mV in 0.5 ms (the fast rising phase), +37 to +38 mV in 0.1 ms, +38 to +37 mV in 0.1 ms, +37 to −70 mV in 1.5 ms (the falling phase), −70 to −79 mV in 0.5 ms, −79 to −80 mV in 1 ms, −80 to −81 mV in 1 ms, and −81 to −60 mV in 11 ms (the after-hyperpolarization phase).
FIGURE 8.

Roscovitine increases the duration of AP-induced N-current. (A) Whole-cell currents recorded before (thin trace) and during (thick trace) application of 100-μM roscovitine. The initial outward current is gating current that is activated during the rising phase of the AP. The gating current has not been studied, but is likely generated by gating charge movement in sodium, calcium, and potassium channels. The AP waveform used to generate these currents is described in Materials and Methods. (B) Simulated currents using Scheme 3. The control current is shown as a thin trace and current in 100-μM roscovitine is shown as a dashed trace. The thick trace is the roscovitine-modified current decreased by 30% to account for the inhibitory action of roscovitine on the whole-cell current.
Solutions
The internal solution contained 61.6 mM NMG·Cl, 6.0 mM MgCl2, 14 mM Creatine·PO4, 2.5 mM NMG·HEPES, 5 mM Tris2·ATP, 10 mM NMG2·EGTA, and 0.3 mM Li2·GTP. The extracellular solution contained 117.5 mM NMG·Cl, 10 mM NMG·HEPES, and 3 mM BaCl2. In some external solutions 3 mM BaCl2 was replaced by either 10 mM CaCl2 or 30 mM BaCl2. The NMG·Cl concentration of these solutions was reduced to maintain osmolarity, which was 240 mOsm for the external solutions and 200 mOsm for the internal solution. All solutions were titrated to pH 7.2 with NMG base. Test solutions were applied from a gravity-fed perfusion system with seven inputs and a single output. The minimum exchange time for this system was ∼2 s.
Data analysis
Data were analyzed using Igor Pro (WaveMetrics, Lake Oswego, OR) running on a Macintosh computer. Step currents were measured as the average of 10 points at the end of the 10-ms voltage step. Tail currents were measured as the average of three points starting 0.3 ms into the repolarizing pulse and late tail currents were measured the same way, beginning 2.5 ms into the repolarizing pulse. The late tail current was used as an index of the roscovitine effect and the time was chosen to be ≥3× the fast deactivation time constant (τD). Activation τ (τA) was estimated by fitting a single-exponential function to the current after a 0.3-ms delay (9). The value τD was estimated from either single- or double-exponential fits to tail currents starting 0.3 ms into the repolarizing step. Control tail currents and tail currents in roscovitine concentrations ≥100 μM were fit using a single exponential. Tail currents in roscovitine concentrations <100 μM were fit using a double exponential with one τ fixed to control and the other τ fixed to that measured in 100 μM roscovitine. In addition, envelope tail currents in roscovitine were fit with double exponentials with τ s fixed to control and 100-μM roscovitine (after a 10-ms step to +70 mV). The voltage dependence of deactivation was determined by fitting a single-exponential equation to the τD-voltage relationship. Group data were calculated as mean ± SD throughout the article. Paired t-test was used for in-cell comparison.
Computer simulations
Simulated currents were generated using Axovacs 3 (written by Stephen W. Jones, Case-Western Reserve University) running on a Dell Inspiron 5150 computer (Dell Computer, Round Rock, TX). Voltage-dependent rate constants (kx) in the model were calculated from
 |
(1) |
where Ax is the rate constant at the characteristic voltage (Cx), zx is the charge moved, and R, T, and F are the gas constant, absolute temperature, and Faraday's constant, respectively. Currents were simulated in response to both voltage steps and an action potential. The action potential (Fig. 8 b) was generated in Axovacs by combining Hodgkin-Huxley m3h sodium current and n4 potassium current models with our N-channel model. The N-channel conductance was reduced to 1/400th of that of the sodium and potassium channels so that the shape of the Hodgkin-Huxley action potential (AP) was not altered by the inclusion of the N-channel model. The ionic conditions for the AP simulation were [Na+]o=150, [Na+]i = 10, [K+]o = 5, and [K+]i = 140.
Chemicals
All experiments utilized R-roscovitine that was obtained from Calbiochem (La Jolla, CA). Olomoucine was obtained from LC Labs (Woburn, MA). All other chemicals were obtained from Sigma (St. Louis, MO). Control solutions contained up to 0.6% DMSO to control for the DMSO concentration of roscovitine and olomoucine solutions. For experiments using a range of roscovitine concentrations (e.g., dose-response measurements), the DMSO concentration of all solutions was set to that in the solution with the highest roscovitine concentration. The DMSO in the control solutions had no effect on the whole-cell calcium currents.
RESULTS
To determine if roscovitine could affect N-type channels we utilized bullfrog sympathetic neurons in which N-channels generate ∼90% of the whole-cell calcium current (7,10). Thus, large roscovitine effects can be attributed to N-channels (11,12). Fig. 1 shows two roscovitine effects on N-current. The initial effect was a slowing of deactivation, which was followed by a slower inhibition that can be observed in the step current. The roscovitine effect on deactivation was quantified by measuring tail current (at 2.5 ms) after fast deactivation was nearly complete (Fig. 1). This roscovitine effect is nearly complete within ∼5 s after initiating application (3-s interval between steps). On the other hand, step current inhibition is still incomplete at the end of the 60-s application. The different time courses for these two effects suggest they are mediated by distinct mechanisms. This idea was supported by applying the cdk inhibitor olomoucine (300 μM), which inhibited N-current (19 ± 4%, n = 4), but failed to induce slow deactivation (change in late tail current = 6 ± 5%) (Fig. 1). Distinct mechanisms for slow deactivation and inhibition were further supported by their different dose-response relationships, which were measured during roscovitine applications ranging from 1 to 300 μM (Fig. 2). The roscovitine-induced slow deactivation data were fit with a single-site binding isotherm to obtain the concentration yielding the half-maximal response (EC50), which was 52.9 ± 15.8 μM (mean ± SD) from five cells. From the same cells, the EC50 for inhibition was 294.1 ± 173.8 μM. Unfortunately, the duration of roscovitine application in this set of experiments was too short to reach steady state for the inhibition of N-current. Thus, additional experiments measured inhibition at the end of longer roscovitine applications (≥3 min), and the fitting of these data yielded an EC50 = 140 μM for the inhibition of step current (n = 3–7, not shown). However, recovery of current after these long roscovitine applications was often poor, which complicated the interpretation of inhibition induced by roscovitine. This poor recovery likely resulted from rundown of calcium current, which was difficult to control for because of the long drug applications. Thus, the slow development of inhibition complicates its accurate measurement, but clearly distinguishes inhibition from slowed deactivation.
FIGURE 1.

Roscovitine (Rosc) slows N-channel deactivation, but the closely related cdk inhibitor olomoucine (Olo) does not. (A) Currents generated in a 3 mM Ba2+ external solution show a decrease in step current amplitude (open squares) and a slowing of tail current deactivation in response to 100-μM roscovitine, but only the decreased step current in response to 300-μM olomoucine. Slow deactivation is measured as the amplitude of the late tail current (solid circles). (B) Currents before and upon recovery from roscovitine and olomoucine are shown (thin lines) along with the roscovitine- and olomoucine-affected currents (thick lines) in the top and bottom panels, respectively. All data from the same cell. The // in A indicates an approximately 3.5-min gap.
FIGURE 2.

Dose-response relationships for the roscovitine-induced slow deactivation and step current inhibition. (A) Step current (upper panel) and late tail currents (lower panel) show the inhibition and slowed deactivation effects of roscovitine, respectively. The currents were measured as described in Materials and Methods. Note the slow inhibition of the late tail current after the initial enhancement during 300-μM roscovitine. (B) Example currents from the time course shown in A. The control currents are from the step just before roscovitine application and the currents in roscovitine (thick traces) are shown just before switching back to the control solution, except for 300-μM roscovitine, which shows the current at peak enhancement of the late tail current (∼9 s into the roscovitine application). (C) The maximal late tail enhancement (solid circles) and step current inhibition (open squares) from the same cell shown in A and B are plotted versus roscovitine concentration. The smooth lines are fits using single-site binding isotherms to yield the indicated half-maximal concentration (EC50).
The concentrations required to obtain N-current effects appear high compared to the published affinities of roscovitine for cdk 1, 2, and 5 (IC50 ∼ 0.16–0.7 μM) (2). However, these values were obtained in low concentrations of ATP (1 μM), which competes with roscovitine for kinase binding (13). At physiological ATP levels, IC50 for roscovitine block of cell division (cdk block) is ∼40 μM (14), which is similar to the EC50 we measure for slow deactivation. In addition, other kinases such as extracellular signal-regulated kinase 1, and glycogen synthase kinase 3 (IC50 ∼ 30 and 130 μM, respectively; see Ref. 2) have lower affinity for roscovitine, which could make them candidates for mediating roscovitine-induced N-current inhibition (EC50 > 100 μM). We tested for possible kinase involvement by introducing 100 μM roscovitine into the pipette solution to inhibit intracellularly located kinases. No slowing of deactivation or excessive current reduction (inhibition) was observed during whole-cell dialysis of up to 30 min with roscovitine (n = 5; not shown). In addition, the extracellular application of 100 μM roscovitine induced a 6.6 ± 3.0-fold increase in late tail current in cells dialyzed with roscovitine compared to 7.8 ± 4.8-fold increase in control cells dialyzed with 0.2% DMSO (n = 4 ns, not significantly different). Thus, internal roscovitine failed to abrogate the ability of extracellularly applied roscovitine to slow N-channel deactivation, which suggests that kinase inhibition is not involved in roscovitine's effect on calcium channel gating (1). The step current inhibition induced by externally applied roscovitine (100 μM) was extremely small in this set of experiments, 10.4 ± 14.3% with intracellular roscovitine versus 0.6 ± 2.8% with intracellular DMSO control cells (n = 4 ns). Thus, these experiments failed to resolve the possibility that kinases mediate roscovitine-induced N-current inhibition.
The inability of olomoucine to slow deactivation further supports the absence of kinase involvement (see Ref. 1, Fig. 1). Thus, slow deactivation appears to be specific for roscovitine. However, N-current inhibition, which is induced by both roscovitine and olomoucine, could be mediated by kinase block. Further work is needed to test possible kinase-mediated inhibition. These data together with different time courses and EC50 for inhibition versus slow deactivation point to distinct mechanisms for these roscovitine effects. For this reason, we focus the remainder of this article on the effect of roscovitine to slow N-current deactivation.
Roscovitine effects on N-channel kinetics
We examined N-current kinetics and steady-state voltage dependence to investigate gating changes associated with slow deactivation. Analysis of N-current kinetics was carried out in 100-μM roscovitine, which induced slow deactivation in the majority of N-channels, but only inhibited a relatively small percentage of channels. Steady-state current measurements (Fig. 3, a and b) showed a slight left-shift in voltage dependence of N-channel activation. This shift was quantified by fitting double Boltzmann equations to the activation-voltage relationship (activation curve; Fig. 3 b). The major component (slope = 7.2 mV) had an average shift in the half-activation voltage (V1/2) of −3.5 ± 0.8 mV (n = 7, p < 0.01 using paired t-test). Even though this shift was small it was consistent, in that it was observed in all seven cells examined. The shift was fully reversible and could also be observed in the current-voltage relationship (Fig. 3 a), which led us to believe it is a real effect of roscovitine. The steepness of the activation curve does not appear to change in roscovitine (Fig. 3 b).
FIGURE 3.

Roscovitine induces small changes in N-current activation. The effect of 100-μM roscovitine (solid circles) is shown on the current-voltage relationship (A), the activation curve measured from tail currents (B), and τA (C) from a representative cell. The solid lines in B are double Boltzmann fits to the tail current activation curve. For the first Boltzmann, the V1/2 is −18.7, −20.9, and −17.3 mV, and the slope is e-fold for 7.0, 7.5, and 7.5 mV for control, roscovitine, and recovery, respectively, and for the second Boltzmann the respective values are V1/2 = 21.7, 30.5, and 23.6, and slope = 9.8, 12.2, and 10.4. For each fit the fractional amplitudes were held at 0.9 and 0.1 for the first and second components, respectively. (D) Currents from the same cell used for A–C showing the slower activation at hyperpolarized voltages, the increased inhibition at more depolarized voltages, and slower deactivation after all voltage steps. The asterisks indicate current in roscovitine and the dashed current traces (−10 to +30 mV) are scaled roscovitine currents shown to permit comparisons of activation between control (thin traces) and roscovitine currents. Currents after recovery from roscovitine are not shown, but recovery is shown in A–C. Outward currents at the onset of the depolarizing step have been blanked. These data were recorded in 3 mM Ba2+.
N-current activation was slowed most obviously at hyperpolarized voltages (Fig. 3, c and d). The activation τ (τA) was quantified by fitting activation with a single-exponential function after a 0.3-ms delay (9). This method revealed a roscovitine-induced increase in τA at negative voltages that decreased monotonically with depolarization. The τA in roscovitine was compared to the average τA before and upon recovery from roscovitine and showed an increase of 63% at −30 mV, 22% at −10 mV, 10% at +10 mV, and 6% at +30 mV (n = 5, p < 0.01 paired t-test for each voltage, except +30 mV where p > 0.05 ns). The larger τA were consistently measured from roscovitine currents at voltages <+20 mV in each of the five cells examined. The time course for the roscovitine-induced increase in τA is similar to that observed for the enhancement of late tail current (not shown), which supports its association with slowed deactivation and not with the inhibitory effect of roscovitine.
The most prominent kinetic effect of roscovitine was to slow N-channel deactivation (Fig. 4). Roscovitine increased τD at each voltage examined, but it also decreased the voltage dependence of the τD so that deactivation kinetics could be resolved over a wider range of voltages. The voltage dependence of τD was measured by fitting a single-exponential equation to the τD-voltage relationship to obtain the τD voltage constant (ν), which represents the ΔV for an e-fold change in τD. The mean ν in control (average of control and recovery from roscovitine) was −26.0 ± 2.0 mV compared to ν = −67.2 ± 11.6 mV in 100-μM roscovitine (n = 7, p < 0.01 paired t-test). Thus, a reduction in the voltage dependence of deactivation appears to be a major effect of roscovitine.
FIGURE 4.
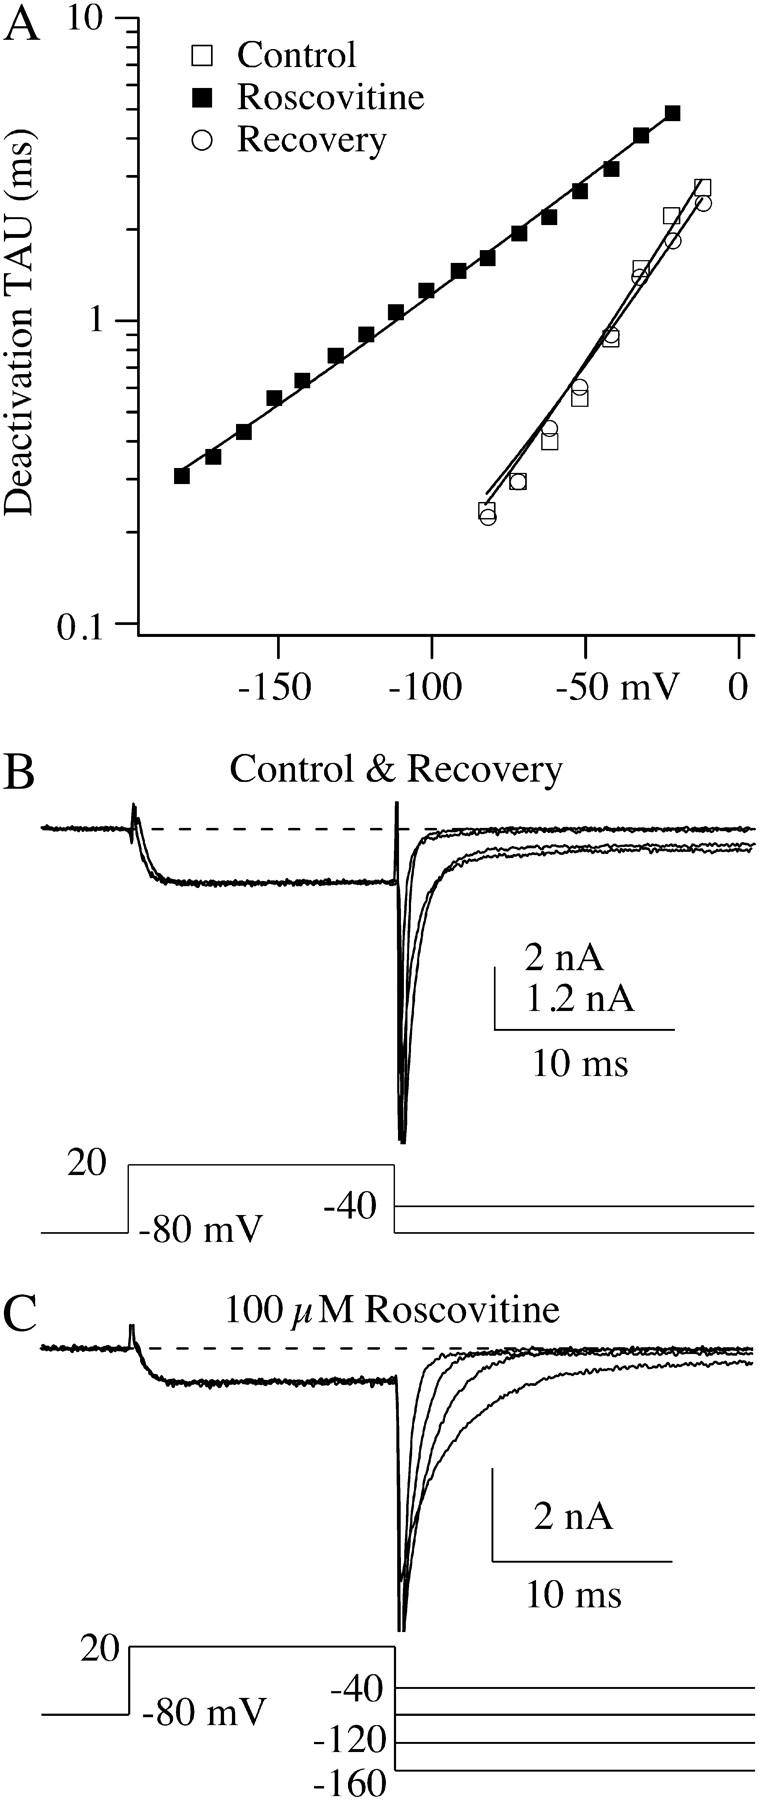
Roscovitine reduces the voltage dependence of deactivation. All data shown are from a representative cell. (A) τD measured from single-exponential fits to tail currents is plotted versus the tail voltage. Currents were activated by a 15-ms step to +20 mV, and the duration of the repolarization step was 20 ms. The y axis was log-transformed to highlight the decrease in deactivation voltage dependence. The smooth lines are single-exponential fits from which the voltage constant (ν) can be determined. In control and recovery ν = 26.3 mV and 28.9 mV, respectively. ν increased to 55.7 mV in 100-μM roscovitine. (B) Currents in control and after recovery from roscovitine are shown at two tail voltages (−40 and −80 mV). The recovery current is scaled to match that of control to facilitate comparison of the deactivation kinetics. The smaller scale value (1.2 nA) refers to the recovery current. (C) Tail currents in 100-μM roscovitine can be resolved to voltages as negative as −160 mV. Note that deactivation at −160 mV in roscovitine is slower than that at −80 mV in control.
The final kinetic process investigated was inactivation. The main mechanism for N-channel inactivation over 500-ms voltage steps has been attributed to inactivation from intermediate closed-states (15,16), which has recently been referred to as U-type inactivation, because of the U-shaped voltage dependence (17) (Fig. 5 c). Using a triple pulse protocol (20 ms prepulse, 500 ms inactivating pulse and 20 ms postpulse), we found that inactivation at 0 mV was increased from 27.3 ± 3.7% to 51.3 ± 3.7% by 100-μM roscovitine (Fig. 5, a and c). Inactivation in roscovitine still declined with depolarization >0 mV, which is characteristic of a U-type mechanism (Fig. 5 c). Interestingly, roscovitine failed to affect inactivation at voltages hyperpolarized to activation (compare Fig. 5, b and c). One explanation for this phenomenon is that roscovitine preferentially binds to open channels to affect gating.
FIGURE 5.
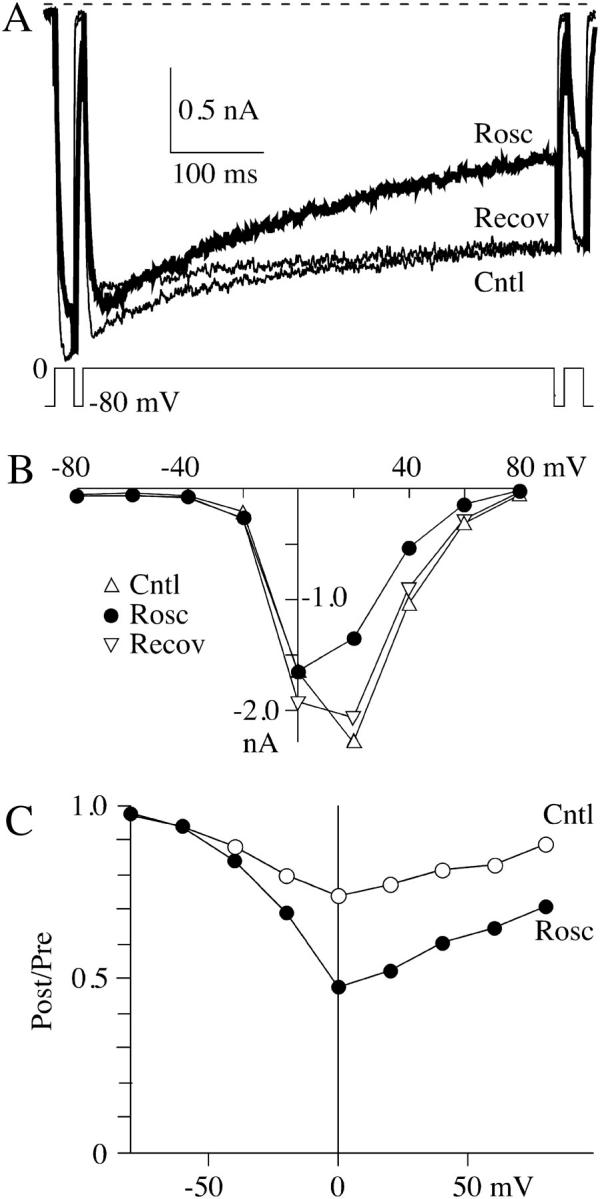
Roscovitine increases N-channel inactivation. (A) A triple pulse protocol was used to examine the effect of roscovitine on inactivation. The prepulse and postpulse were 20-ms steps to 0 mV, whereas the 500-ms inactivation pulse was to voltages ranging from −80 to +80 mV (20-mV increments). The increased inactivation induced by 100 μM roscovitine can be observed during the 500-ms step to 0 mV. The external solution contained 30 mM Ba2+. (B) A plot of peak current measured during the 500-ms step versus the step voltage. The peak current was measured as the average ±2.5 ms around the peak. (C) The ratio of the postpulse current to prepulse current is plotted versus the inactivation step voltage. This relationship in control shows the characteristic U-shaped voltage dependence of N-current inactivation. The addition of 100-μM roscovitine increased inactivation at voltages >−40 mV. The voltage-generating maximal inactivation did not appear to be altered by roscovitine. Control was calculated as the average of the post-/pre- ratio before and upon recovery from roscovitine. The data in all panels are from the same cell.
Roscovitine preferentially binds to the open state
We tested the idea that roscovitine binds to open channels by using an envelope tail protocol to measure the time-course of the development of slowed deactivation in roscovitine (Fig. 6). The prediction is that roscovitine-induced slow deactivation should become larger with longer open channel durations. The tail current (at −30 mV) in control was quantified by fitting with a single exponential, and a plot of the fit amplitude versus the +70 mV step duration increased monotonically as expected for channel activation (Fig. 6, a and c). The tail current in roscovitine was quantified by fitting with double-exponential equations to obtain the amplitude of the fast and slow components of deactivation. The amplitude of each component in roscovitine was plotted with that from control currents in Fig. 6 c. Brief steps (<1 ms) in 100-μM roscovitine activate channels that primarily deactivate rapidly, as in control. However, the amplitude of this control-like component peaks at ∼1 ms and declines with increasing step duration. This decline is accompanied by an increase in the amplitude of slowly deactivating current, which is consistent with open channels being converted from control to roscovitine-bound. A second prediction of the open-state binding hypothesis is that development of slow tail current should depend on roscovitine concentration. As predicted, the development of slowly deactivating current was slower with lower roscovitine concentrations (Fig. 6 d). This concentration-dependence was quantified by fitting single-exponential equations (after a 0.3-ms delay) to the development time-course measured in three roscovitine concentrations. A plot of the inverse envelope τ versus roscovitine concentration was linear, and the data were fit with the equation
 |
(2) |
to obtain kon (slope) = 3.8 × 10⁻³ μM−1 ms−1 and koff (y-intercept) = 0.23 ms−1 (Fig. 6 e). From these values we calculated KD = 60 μM, which is very close to the EC50 measured from the enhancement of late tail current (53 μM, Fig. 2). Thus, these data are consistent with a model where roscovitine binds to open channels to affect the kinetics.
FIGURE 6.

N-channels must open before roscovitine can bind to affect deactivation kinetics. Currents generated during a tail current envelope paradigm are shown from the same cell in both control (A) and 100-μM roscovitine (B). The +70 mV step durations shown are 0.3, 0.8, 2.0, and 9.0 ms for both control and roscovitine. Exponential fits to the tail currents are superimposed on the tail currents. These fits were single-exponential equations for control, whereas double exponentials were used for tail currents in roscovitine. The currents were recorded 30 mM Ba2+. (C) The amplitudes of the exponential fits are plotted versus step duration. These amplitudes were fit to a single exponential (after a 0.3-ms delay) to obtain an estimate of the activation τ for each component. For control (open circles) the activation τ was 0.4 ms. The single-exponential fit to control data was scaled (*0.4, dashed line) to show that the fast deactivation component (control-like τD, solid circles) in roscovitine activated with the same time course as that in control. The amplitude of this component peaked at ∼1 ms and monotonically declined with longer step pulses. The amplitude of the slowly deactivating current in roscovitine (solid squares) increases monotonically with step duration after a brief delay (∼0.3 ms). These data and their single-exponential fit are replotted in D along with data from 10- and 30-μM roscovitine to illustrate the concentration-dependence of activation of the slowly deactivating tails. The time constants for each fit are indicated. (E) A plot of the roscovitine-induced inverse envelope τ versus roscovitine concentration is well fit by a linear regression (see text). The slope of this line is 0.0038 μM−1 ms−1 and the y-intercept is 0.23 ms−1, which yields KD = 60 μM. Data in A–D are from the same cell, and data in E are the average of three cells.
Modeling roscovitine effects on N-current
We were interested in determining gating transitions that could be affected by roscovitine to slow deactivation. Thus, we generated several models to determine the simplest that could reproduce our data. We have excluded inactivation from these models since we currently do not have enough data to model N-channel inactivation in either control or roscovitine. The determination of roscovitine's effect on inactivation requires further study.
The first models we investigated were those where roscovitine bound with high affinity (60 μM) to both closed and open channels to affect C ↔ O transitions. Some of these models were able to reproduce much of our data, but were unable to reproduce the envelope tail current data (Fig. 6). The next model type considered was one where roscovitine bound to the open state and unbinding was required before the channel could close (Scheme 1). Initially, all rate constants in Scheme 1 were voltage-dependent, except for voltage-independent k45 and k54. The primary problem with this model was that τD in roscovitine would reach a limit at negative potentials where O → C transitions became fast relative to RO → O, but no such limit was observed in our recordings down to −180 mV. The τD limit was overcome by making the roscovitine dissociation rate constant (k54) voltage-dependent, but this model showed a voltage-dependent EC50 for roscovitine binding which we do not observe in our data (compare +20 mV in Fig. 2 with +70 mV in Fig. 6). This led us to models where roscovitine could bind to multiple states with different affinities (Schemes 2 and 3). For both schemes, the horizontal transitions are voltage-dependent and the vertical transitions are roscovitine binding and unbinding steps.
SCHEME 1.

[R] indicates roscovitine concentration.
SCHEMES 2 and 3.


The rate constant (A, s−1) and charge moved (z) for each transition are given in Table 1. The binding rate constants have units of μM−1 s−1.
The control currents generated by both these models compare very well with whole-cell N-current (Fig. 7). Steady-state activation is better fit by Scheme 2, but Scheme 3 better fits the τD data. For both models, the τA measured from simulated currents corresponds well at potentials ≤ 0 mV with those from control whole-cell data, but at more depolarized voltages the simulated currents activated faster than whole-cell currents (Fig. 7 b). The whole-cell τA appears to approach an asymptote of ∼0.4 ms at voltages >+30 mV. Consistent with this idea, the envelope tail protocol using +70 mV steps yields τA = 0.34 ± 0.05 ms (n = 3) for control (Fig. 6 c). We currently do not know the reason for this apparent τA asymptote, but one possibility is that there is a voltage-independent transition on the pathway to channel opening. Another possibility is that the transient outward gating current obscures the true time-course of channel activation at depolarized voltages where inward currents are small. However, the limitation of current size should be overcome by using the envelope tail protocol. Due to the uncertainty regarding the apparent τA asymptote, the models have not been adjusted to fit τA at depolarized voltages. Fortunately, this should not affect the ability of the model to reproduce the roscovitine data, since roscovitine does not affect the τA at V > 0 mV (Fig. 3 c).
FIGURE 7.

A model of roscovitine binding to open N-channels can reproduce the whole-cell data. All solid lines are either experimental data or fits to that data (n = 3–7 cells). The data from Scheme 2 simulations are indicated by the open symbols and Scheme 3 simulation data are shown by solid symbols. (A) The activation-voltage relationships measured from simulated tail currents are nicely described by the major (80% of maximum current) and steeper (slope = 7.1 mV) component of double Boltzmann fits to whole-cell data (smooth lines). (B) Roscovitine slows activation of simulated currents at hyperpolarized voltages. τA was from single-exponential fits to currents starting 0.3 ms into the voltage step and is plotted versus step voltage. For comparison, τA from whole-cell data is also shown (control, thin line; roscovitine, thick line). (C) τD measured from simulated tail currents (10-ms step to +50 mV, followed by 14-ms step to the tail voltage) are plotted for control (squares) and 100-μM roscovitine (circles). The smooth lines are single-exponential fits to whole-cell τD-voltage relationship in both control and 100-μM roscovitine. These fits were obtained from τD averaged from seven cells. (D) The inverse envelope τ are plotted versus roscovitine concentration. The solid line is the regression fit to Scheme 3 simulated data (solid circles), whereas the dashed line (long dashes) is the fit to Scheme 2 simulated data (open circles). The indicated KD was calculated from the same fit parameters as in Fig. 6. The regression fit from Fig. 6 E is superimposed (short dashes) for comparison with the simulated data.
Scheme 2 was the model we believed would reproduce roscovitine's effect on N-current. For this model roscovitine preferentially binds to the open state (KD = 100 μM), but can bind with low affinity (KD = 1 mM) to the neighboring closed state. Thus, there would be little or no closed-state binding at our test concentration (100 μM). This model could reproduce fairly well the voltage dependence of steady-state activation and τD (Fig. 7, a and c). The roscovitine-induced shift in activation V1/2 was 2.3 mV vs. 4 mV and the τD ν in roscovitine was −70.4 mV compared to −59.2 mV for Scheme 2 versus whole-cell data, respectively. Surprisingly, we could not find parameters that could reproduce both the roscovitine EC50 and the effect on τA. The reason is that these two parameters are inversely related in the model so that parameters that reproduced the experimentally measured EC50 (∼50 μM) caused τA to become unacceptably large (>6 ms at −20 mV), whereas parameters that reproduced τA gave an unacceptably low EC50. The values presented for Scheme 2 represent our best compromise (Table 1), where both EC50 (117 μM) and τA (4 ms at −20 mV) are closest to their measured values (Fig. 7). This inverse correlation between roscovitine EC50 and τA in Scheme 2 appeared to result from channels moving from C4 → O5 to replace those moved from O5 to RO7. Thus, a higher EC50 reduced the number of channels entering RO7, which reduced its influence on τA. This led us to develop a model that would reduce the effect of roscovitine binding on τA. This was accomplished in Scheme 3 by linking the high affinity binding to a second open state (O5 → RO7). Scheme 3 was slightly better than Scheme 2 at reproducing the roscovitine-induced shift in the activation-voltage relationship and the τD ν. The shift in activation V1/2 was 3.7 mV (vs. 4 mV) and the τD ν was −51.0 mV (versus −59 mV) in roscovitine. However, the real benefit of Scheme 3 was that it could reproduce both the roscovitine EC50 (47 μM) and the effect on τA (Fig. 7). Using the envelope tail current protocol, we confirmed that Scheme 3 could reproduce the open-state binding parameters calculated from whole-cell current (Fig. 7 d). Scheme 3 was also able to reproduce the concentration-dependent delay in slow tail activation (see Fig. 6 d, 10 μM roscovitine). Since roscovitine binds to the open state, the development of slow deactivation is both concentration- and time-dependent. At low roscovitine concentrations (10 μM), binding is sufficiently slow to generate a measurable delay to detection of slow deactivation. Binding was rapid enough at higher concentrations (e.g., 100 μM) that we could not detect a delay in either simulated or recorded currents. Our modeling of roscovitine's effect on N-current has revealed the surprising possibility that N-channels gate with two open states.
TABLE 1.
Rate parameters for Scheme 2 and 3 models
|
Scheme 2
|
Scheme 3
|
|||
|---|---|---|---|---|
| A | z | A | z | |
| k12 | 5000 | 0.9 | 5000 | 0.8 |
| k21 | 1700 | −0.9 | 500 | −0.8 |
| k23 | 4000 | 0.9 | 4000 | 0.9 |
| k32 | 1700 | −0.9 | 500 | −0.9 |
| k34 | 10,000 | 0.6 | 3000 | 0.9 |
| k43 | 1000 | −0.6 | 250 | −0.9 |
| k45 | 10,000 | 0.3 | 2000 | 0.6 |
| k54 | 3000 | −0.3 | 1000 | −0.6 |
| k46 | 2[R] | — | 4[R] | — |
| k64 | 2000 | — | 4000 | — |
| k57 | 2[R] | — | 4[R] | — |
| k75 | 200 | — | 200 | — |
| k67 | 10,000 | 0.3 | 2000 | 0.6 |
| k76 | 300 | −0.3 | 50 | −0.6 |
A (s−1) is the rate constant at the characteristic voltage (10 mV) and z is the charge moved. [R] is the roscovitine concentration (μM). The units of A for k46 and k57 are μM−1 s−1.
Action potential-induced currents
The physiological impact of slower N-channel deactivation is the increase in Ca2+ influx during an action potential (AP). Calcium channel activation is slow relative to that of sodium channels so that peak calcium current is observed during the repolarization phase of the AP (18,19). However, N-channels normally close before the after-hyperpolarization where driving force is particularly large, which greatly limits the amount of Ca2+ that crosses the membrane. Thus, the Ca2+ influx through roscovitine-modified N-channels should be greatly enhanced as a result of the reduced voltage dependence of deactivation. Fig. 8 shows the effect of roscovitine on N-current generated by an AP waveform along with simulations using Scheme 3. Roscovitine greatly prolonged N-current during the AP, but also inhibited the peak current (Fig. 8 a). Both these effects were expected based on the voltage-step data. Roscovitine also induced a slight right-shift in peak current as expected from the slower activation. This shift was small because τA is normalized at voltages ≥0 mV (Fig. 3 c). The reduced voltage dependence of deactivation results in complete N-current deactivation ∼8 ms after the AP peak compared to ∼1 ms in control. Integration of the AP-induced currents showed that roscovitine increased Ca2+ influx by 39.2 ± 6.1% (p < 0.01, n = 4) even though peak current was inhibited.
The simulated control current using Scheme 3 is very similar to the whole-cell AP-induced currents (Fig. 8 b, thin current traces). The current peaks at approximately the same point during AP repolarization and is completely deactivated by the start of the after-hyperpolarization phase. Roscovitine induced a 17% increase in peak current (Fig. 8 b, dashed line trace), a slight right shift in peak current, and a dramatic increase in the duration of AP-induced current. This current was reduced by 30% (Fig. 8 b, thick line trace) to facilitate comparison with the whole-cell current, since roscovitine induced an ∼30% inhibition of whole-cell current in this set of experiments. Complete deactivation of the simulated current occurred ∼7 ms after the AP peak, which is similar to that observed with the whole-cell currents in roscovitine.
DISCUSSION
We have demonstrated that N-type calcium channels can be modulated by roscovitine. The dominant effect is to slow N-channel deactivation with relatively small effects on the time-course and voltage-dependence of activation. The slowed deactivation appears to result from roscovitine binding to open channels, and Scheme 3 nicely reproduces the effect of roscovitine on both activation and deactivation. Yan et al. (1) showed similar effects of roscovitine on the deactivation of ωCMVIIC-sensitive calcium currents in rat neostriatal neurons. These authors failed to observe a shift in the activation-voltage relationship, but they used a lower roscovitine concentration (50 μM vs. 100 μM) that may have made such a shift more difficult to observe. We also failed to observe a shift when using 30-μM roscovitine (not shown). It appears that a maximal roscovitine effect is needed to observe the small shift (∼4 mV) in the activation curve.
Based on ωCMVIIC sensitivity, Yan et al. (1) concluded that P/Q-channels were the target of roscovitine, but micromolar ωCMVIIC also blocks N-type channels (4). The calcium current in the neostriatal neurons used by Yan et al. (1) is comprised of ∼35% L-type, ∼25% N-type, ∼20% P/Q-type, and ∼20% R-type current (20). Thus, L-type and R-type channels appear to be relatively insensitive to roscovitine, but either one or both of the ωCMVIIC-sensitive channels could be affected. The available evidence supports the modulation of both N- and P/Q-type channels by roscovitine (this article; see also Ref. 21; and unpublished results). Tomizawa et al. (21) showed in the hippocampus that roscovitine could enhance both the Ca2+ influx through P/Q-channels and the rising phase of excitatory postsynaptic potentials (characteristic of increased neurotransmitter release). The excitatory postsynaptic potential enhancement was blocked by ωAgaIVA (specific P/Q-channel blocker), but not ω-conotoxin GVIA (specific N-channel blocker). It is not clear why N-channels did not participate in the enhanced neurotransmitter release, but in our experiments 10-μM roscovitine as used by Tomizawa et al. (21) has only minor effects on N-current (Fig. 2). Thus, it is possible that P/Q-channels have a higher sensitivity to roscovitine.
Kinases are not involved in the roscovitine effect
Roscovitine inhibits several kinases including cdk 1, 2, and 5, extracellular signal-regulated kinase 1 and 2, and glycogen synthase kinase 3 (2). However, the available evidence supports the idea that kinases are not involved in the roscovitine-induced slowing of calcium channel deactivation. The evidence includes the rapid onset of the roscovitine effect (≤2 s), the failure of intracellular roscovitine to modulate current, and the inability of olomoucine to slow deactivation (1, Fig. 1). In addition, the roscovitine-induced slow deactivation was observed in neurons isolated from mice lacking p35, which is the neuron-specific activator of cdk5 (1). However, cdk5 can phosphorylate the intracellular loop between domains I and II of P/Q-channels (21). This phosphorylation inhibits the binding of SNAP-25 and synaptotagmin to the intracellular loop, but it is not clear what effect, if any, this phosphorylation has on channel activity. Phosphorylation of N-type channels by other serine/threonine kinases can affect G-protein-mediated modulation of these channels, but slowed deactivation has never been reported (22).
The N-channel models
Our goal in generating these models was to provide insights into the roscovitine-induced modification of channel gating. Thus, we present the minimal model that allowed us to reproduce the data. All of the models we tested featured open-state roscovitine binding as dictated by the whole-cell data. In the simplest model, slow deactivation resulted directly from roscovitine unbinding (Scheme 1). However, this resulted in a voltage-independent τD at hyperpolarized voltages where roscovitine dissociation became rate-limiting. We overcame this limitation by making roscovitine dissociation voltage-dependent, but this model showed a voltage-dependent EC50 that was not observed in our data. The failure of these linear models led us to uncouple N-channel deactivation from roscovitine dissociation, which was accomplished by allowing roscovitine to bind to multiple states (Schemes 2 and 3). Scheme 2 was the first such model that we tested, and it solved the problems of Scheme 1 by allowing roscovitine-bound channels to close. In this model, slow deactivation resulted from a combination of roscovitine dissociation (at more depolarized voltages) and the smaller closing rate constant (RO7 to RC6). However, we could not find a single set of parameters that would fit both the roscovitine EC50 and τA. As described above, the excessively slow activation appears to result from the movement of channels from O5 into the higher Po RO7, causing channels to move from C4 → O5 to reestablish the proper equilibrium. This final problem was addressed by allowing roscovitine to bind only to open states as in Scheme 1, but an additional open state was added with different roscovitine affinity so that dissociation would not limit N-channel deactivation (Scheme 3). The unbinding rate constant for RO6 → O4 is 20 times larger (yielding KD = 1000 μM) than that for RO7 → O5 (yielding KD = 50 μM). This solved the problem of excessively slow activation because roscovitine binding primarily induced a redistribution of channels among open states with relatively high Po. As a result of the relatively high occupancy of O4 and O5, few channels moved from C3 to O4, which contributed only a small component to activation. Although this activation component was slow, it was too small to greatly affect the time course of activation. As a result, Scheme 3 was able to reproduce the effect of roscovitine on activation and deactivation using parameters that yielded a reasonable EC50.
Once bound, roscovitine appears to reduce a backward rate constant to slow deactivation, but that alone cannot explain the reduced voltage dependence of deactivation (ν). The models of Scheme 2 and Scheme 3 achieve this effect by roscovitine changing the rate-limiting step for channel closing from transitions with high charge movement to transitions that move less charge. In Scheme 2, roscovitine changes the rate-limiting step from C4 → C3 (z = −0.6) to RO7 → RC6 (z = −0.3). In Scheme 3 the rate-limiting step changes from O4 → C3 (z = −0.9) to RO7 → RO6 (z = −0.6). By reducing both the rate- and voltage-dependence of channel closing, roscovitine greatly extends the voltage range over which N-channels can be studied.
One prediction of Scheme 3 is that two open states will be observed in single N-channel recording. Our previous single-channel recordings provided evidence for only a single N-channel open state within the main gating mode (called high Po; see Ref. 23). An additional open state could be observed, but it was attributed to a second gating mode (low Po; see Ref. 23). Neurotransmitter inhibition introduced yet another open state (Reluctant) (24). However, our more recent recordings have surprised us by showing multiple components in open time distributions from recordings of N-channel activity that we have classified as high Po (based on our previously published criteria). These data are consistent with that of Colecraft et al. (25), who show two components to the open time distribution for exogenously expressed N-type and P/Q-type channels. Together these results support the existence of two N-channel open states that may be more easily distinguished in roscovitine.
We showed that inactivation was enhanced by roscovitine, but excluded inactivation from the model. The primary reason is that we currently do not have enough data on development and recovery from inactivation to model this process with confidence. An interesting paradox raised by our observations is that roscovitine appears to enhance U-type (intermediate closed state) inactivation while preferentially binding to the open state. Some possible explanations are that 1), roscovitine remains bound after N-channels close; 2), roscovitine induces an inactivation mechanism not observed in control; and 3), U-type inactivation primarily occurs from the first (intermediate) open state (Scheme 3) instead of intermediate closed states. Thus, roscovitine could provide new insights into mechanisms of N-channel inactivation.
Using roscovitine to study physiological effects of enhanced calcium current
One problem with roscovitine as a calcium channel drug is that it has higher affinity for kinases than for calcium channels, which complicates interpretation of its effects. However, there are kinase inhibitors that do not affect calcium channel gating (e.g., olomoucine), which can easily be used to control for the kinase inhibitory effects of roscovitine. This adds additional experimental complexity, but the protocols are straightforward and the results easily interpreted. In addition, other roscovitine-related compounds are likely to be identified that will be more selective for calcium channels.
A separate issue is that roscovitine does not appear to differentiate between N-type and P/Q-type channels (CaV2.2 and CaV2.1, respectively). In this respect, roscovitine is no different than BayK 8644, which cannot differentiate between different L-type channels (i.e., CaV1.2, CaV1.3, or CaV1.4; see Refs. 26 and 27). However, this has not prevented investigators from using this drug. Moreover, CaV2 channels have specific toxins that permit one to determine the contributions of N- and P/Q-current to any Ca2+-mediated effect.
Roscovitine increases the amount of Ca2+ entering the cell during an AP (Fig. 8), which is likely the mechanism by which neurotransmitter release is increased (1,21). N-type calcium channels are tuned to open during the falling phase of the AP, but close before the potential becomes too hyperpolarized. The closing is driven by the voltage dependence of the open state (23), which ensures that the channels are not open when the driving force on Ca2+ influx is extreme (e.g., −80 mV during the after-hyperpolarization phase). Such a large Ca2+ influx could overwhelm the intracellular Ca2+ homeostasis, which could lead to neuronal death (28). Roscovitine's disruption of this finely tuned mechanism could have both positive and negative effects. The increase in neurotransmitter release could improve neuronal communication, but the increased intracellular Ca2+ could induce neuronal injury.
Acknowledgments
We thank Dr. Stephen W. Jones, Geoffrey G. Schofield, and Haoya Liang for helpful discussions and critiques of early versions of this article.
Mircea Anghelescu's present address is University of South Alabama-Mobile, MSB 3028, 307 University Blvd., Mobile, AL 36688.
References
- 1.Yan, Z., P. Chi, J. A. Bibb, T. A. Ryan, and P. Greengard. 2002. Roscovitine: a novel regulator of P/Q-type calcium channels and transmitter release in central neurons. J. Physiol. (Lond). 540:761–770. [DOI] [PMC free article] [PubMed] [Google Scholar]
- 2.Knockaert, M., P. Greengard, and L. Meijer. 2002. Pharmacological inhibitors of cyclin-dependent kinases. Trends Pharmacol. Sci. 23:417–425. [DOI] [PubMed] [Google Scholar]
- 3.Grantham, C. J., D. Bowman, C. P. Bath, D. C. Bell, and D. Bleakman. 1994. Omega-conotoxin MVIIC reversibly inhibits a human N-type calcium channel and calcium influx into chick synaptosomes. Neuropharmacology. 33:255–258. [DOI] [PubMed] [Google Scholar]
- 4.Hillyard, D. R., V. D. Monje, I. M. Mintz, B. P. Bean, L. Nadasdi, J. Ramachandran, G. Miljanich, A. Azimi-Zoonooz, J. M. McIntosh, L. J. Cruz, J. S. Imperial, and B. M. Olivera. 1992. A new Conus peptide ligand for mammalian presynaptic Ca2+ channels. Neuron. 9:69–77. [DOI] [PubMed] [Google Scholar]
- 5.Kuffler, S. W., and T. J. Sejnowski. 1983. Peptidergic and muscarinic excitation at amphibian sympathetic synapses. J. Physiol. 341:257–278. [DOI] [PMC free article] [PubMed] [Google Scholar]
- 6.Jones, S. W. 1987. Sodium currents in dissociated bull-frog sympathetic neurones. J. Physiol. 389:605–627. [DOI] [PMC free article] [PubMed] [Google Scholar]
- 7.Elmslie, K. S., P. J. Kammermeier, and S. W. Jones. 1992. Calcium current modulation in frog sympathetic neurones: L-current is relatively insensitive to neurotransmitters. J. Physiol. 456:107–123. [DOI] [PMC free article] [PubMed] [Google Scholar]
- 8.Adams, P. R., S. W. Jones, P. Pennefather, D. A. Brown, C. Koch, and B. Lancaster. 1986. Slow synaptic transmission in frog sympathetic ganglia. J. Exp. Biol. 124:259–285. [DOI] [PubMed] [Google Scholar]
- 9.Jones, S. W., and T. N. Marks. 1989. Calcium currents in bullfrog sympathetic neurons. I. Activation kinetics and pharmacology. J. Gen. Physiol. 94:151–167. [DOI] [PMC free article] [PubMed] [Google Scholar]
- 10.Liang, H., and K. S. Elmslie. 2001. Ef-current contributes to whole-cell calcium current in low calcium in frog sympathetic neurons. J. Neurophysiol. 86:1156–1163. [DOI] [PubMed] [Google Scholar]
- 11.Elmslie, K. S., W. Zhou, and S. W. Jones. 1990. LHRH and GTP-γ-S modify calcium current activation in bullfrog sympathetic neurons. Neuron. 5:75–80. [DOI] [PubMed] [Google Scholar]
- 12.Boland, L. M., and B. P. Bean. 1993. Modulation of N-type calcium channels in bullfrog sympathetic neurons by luteinizing hormone-releasing hormone: kinetics and voltage dependence. J. Neurosci. 13:516–533. [DOI] [PMC free article] [PubMed] [Google Scholar]
- 13.Gray, N. S., L. Wodicka, A. M. Thunnissen, T. C. Norman, S. Kwon, F. H. Espinoza, D. O. Morgan, G. Barnes, S. LeClerc, L. Meijer, S. H. Kim, D. J. Lockhart, and P. G. Schultz. 1998. Exploiting chemical libraries, structure, and genomics in the search for kinase inhibitors. Science. 281:533–538. [DOI] [PubMed] [Google Scholar]
- 14.Meijer, L., A. Borgne, O. Mulner, J. Chong, J. Blow, N. Inagaki, M. Inagaki, J. Delcros, and J. Moulinoux. 1997. Biochemical and cellular effects of roscovitine, a potent and selective inhibitor of the cyclin-dependent kinases cdc2, cdk2, and cdk5. Eur. J. Biochem. 243:527–536. [DOI] [PubMed] [Google Scholar]
- 15.Jones, S. W., and T. N. Marks. 1989. Calcium currents in bullfrog sympathetic neurons. II. Inactivation. J. Gen. Physiol. 94:169–182. [DOI] [PMC free article] [PubMed] [Google Scholar]
- 16.Patil, P. G., D. L. Brody, and D. T. Yue. 1998. Preferential closed-state inactivation of neuronal calcium channels. Neuron. 20:1027–1038. [DOI] [PubMed] [Google Scholar]
- 17.Klemic, K. G., G. E. Kirsch, and S. W. Jones. 2001. U-type inactivation of Kv3.1 and Shaker potassium channels. Biophys. J. 81:814–826. [DOI] [PMC free article] [PubMed] [Google Scholar]
- 18.Llinas, R., M. Sugimori, and S. M. Simon. 1982. Transmission by presynaptic spike-like depolarization in the squid giant synapse. Proc. Natl. Acad. Sci. USA. 79:2415–2419. [DOI] [PMC free article] [PubMed] [Google Scholar]
- 19.Park, D., and K. Dunlap. 1998. Dynamic regulation of calcium influx by G-proteins, action potential waveform, and neuronal firing frequency. J. Neurosci. 18:6757–6766. [DOI] [PMC free article] [PubMed] [Google Scholar]
- 20.Yan, Z., and D. J. Surmeier. 1996. Muscarinic (m2/m4) receptors reduce N- and P-type Ca2+ currents in rat neostriatal cholinergic interneurons through a fast, membrane-delimited, G-protein pathway. J. Neurosci. 16:2592–2604. [DOI] [PMC free article] [PubMed] [Google Scholar]
- 21.Tomizawa, K., J. Ohta, M. Matsushita, A. Moriwaki, S.-T. Li, K. Takei, and H. Matsui. 2002. Cdk5/p35 regulates neurotransmitter release through phosphorylation and downregulation of P/Q-type voltage-dependent calcium channel activity. J. Neurosci. 22:2590–2597. [DOI] [PMC free article] [PubMed] [Google Scholar]
- 22.Elmslie, K. S. 2003. Neurotransmitter modulation of neuronal calcium channels. J. Bioenerg. Biomembr. 35:477–489. [DOI] [PubMed] [Google Scholar]
- 23.Lee, H. K., and K. S. Elmslie. 1999. Gating of single N-type calcium channels recorded from bullfrog sympathetic neurons. J. Gen. Physiol. 113:111–124. [DOI] [PMC free article] [PubMed] [Google Scholar]
- 24.Lee, H. K., and K. S. Elmslie. 2000. Reluctant gating of single N-type calcium channels during neurotransmitter-induced inhibition in bullfrog sympathetic neurons. J. Neurosci. 20:3115–3128. [DOI] [PMC free article] [PubMed] [Google Scholar]
- 25.Colecraft, H. M., D. L. Brody, and D. T. Yue. 2001. G-protein inhibition of N- and P/Q-type calcium channels: distinctive elementary mechanisms and their functional impact. J. Neurosci. 21:1137–1147. [DOI] [PMC free article] [PubMed] [Google Scholar]
- 26.Xu, W., and D. Lipscombe. 2001. Neuronal CaV1.3α(1) L-type channels activate at relatively hyperpolarized membrane potentials and are incompletely inhibited by dihydropyridines. J. Neurosci. 21:5944–5951. [DOI] [PMC free article] [PubMed] [Google Scholar]
- 27.Koschak, A., D. Reimer, D. Walter, J. C. Hoda, T. Heinzle, M. Grabner, and J. Striessnig. 2003. Cav1.4α1 subunits can form slowly inactivating dihydropyridine-sensitive L-type Ca2+ channels lacking Ca2+-dependent inactivation. J. Neurosci. 23:6041–6049. [DOI] [PMC free article] [PubMed] [Google Scholar]
- 28.Toescu, E. C. 1999. Activity of voltage-operated calcium channels in rat cerebellar granule neurons and neuronal survival. Neuroscience. 94:561–570. [DOI] [PubMed] [Google Scholar]