

Abstract
Caveolae are present in almost all cells and concentrate a wide variety of signaling molecules, receptors, transporters, and ion pumps. We have investigated the distribution of the ryanodine receptor, the Na+/Ca2+ exchanger, the predominant Na+ channel isoform rH1, and the L-type calcium channel, Cav1.2, relative to the muscle-specific caveolin isoform, caveolin-3, in adult rat ventricular myocytes. Three-dimensional immunofluorescence images were deconvolved and analyzed. Caveolin-3 colocalizes with all of these molecules at the surface of the cell, but there is no significant colocalization between caveolin-3 and either the Na+/Ca2+ exchanger or the Na+ channel in the cell interior. The distribution of the surface colocalization indicates that the caveolae that colocalize with each molecule form distinct populations. This organization indicates that there are multiple populations of caveolae separable by location and occupants. In the interior of the cell, caveolin-3 shows a marked colocalization with a population of ryanodine receptors that are separate from those within the dyad. Because of their location, the signaling molecules contained within these caveolae may have preferred access to the neighboring nondyadic ryanodine receptors.
INTRODUCTION
Caveolae are narrow-necked invaginations of the plasmalemma that are associated with a wide variety of roles including endocytosis, water transport, cholesterol homeostasis, and signal transduction (1). The caveola's characteristic shape is due to the presence of one or more of a family of proteins called the caveolins (2) that form oligomers in cholesterol and sphingolipid-rich areas of the membrane. Caveolae in cardiac myocytes contain the muscle specific isoform, caveolin-3, as their major component (3), although caveolin-2 may also be present (4). Studies using immunohistochemistry (5) and electron microscopy (6,7) have shown that caveolae are located both on the surface and in the t-tubules of the cardiomyocyte, unlike the skeletal myocyte where the caveolae are found only on the surface (5).
Two major roles have been proposed for the caveolae in muscle: t-tubular growth and anchoring signaling complexes. It was originally thought that t-tubules grew through an extension of caveolae (8,9), but observations in caveolin-3 null mice have shown that t-tubules are present, although they have irregular shapes and positions (10).
A wide variety of signaling molecules such as G-proteins, ion channels, and receptors have been colocalized with caveolae by both biochemical and morphological (e.g., immunofluorescence) methods (1). Molecules that have been associated with caveolae in the ventricular myocyte include the Ca2+-ATPase (11); the Na+/K+-ATPase (12); the Na+ channel (13); the Na+/Ca2+ exchanger (NCX) (14); and the β2-adrenergic (15), M2-cholinergic (16), and A1-adenosine (17) receptors. The presence of these molecules raises the possibility that caveolae are involved in either the control or modulation of excitation-contraction coupling, making their position within the t-tubule of prime importance.
Cardiomyocytes labeled with anti-caveolin-3 show distinct differences between the surface and t-tubular caveolae: The surface plasmalemma is intensely stained whereas the interior is much dimmer (5), suggesting that the characteristics, and perhaps the occupants, of the caveolae on the surface might be different from those in the interior. Few of the studies listed above measured the actual value of the colocalization, and none have examined any differences there might be between the colocalization occurring at the surface of the cell versus that within the t-tubules.
Our previous results in rat cardiomyocytes (18) have indicated that although L-type Ca2+ channels (Cav1.2) and ryanodine receptors (RyR) are closely apposed in junctional sarcoplasmic reticulum (SR), neither NCX nor the Na+ channel are located within these domains nor are they located together elsewhere on the sarcolemma. One possible explanation that would be supported by experimental results (13,14) is that these molecules are located in the caveolae, although our earlier results would imply that they would have to be in different groups of caveolae. To test this hypothesis and to measure the degree and distribution of colocalization, we used immunofluorescence, wide field microscopy, deconvolution, and digital image analysis to examine the distribution of caveolin-3 relative to the distributions of Cav1.2, NCX, Na+ channels, and RyR in adult rat ventricular myocytes.
MATERIALS AND METHODS
All chemicals were purchased from Sigma-Aldrich (Oakville, Ontario, Canada) unless otherwise stated. Animal handling was done in accordance with the guidelines of the Canadian Council on Animal Care.
Cell isolation
Ventricular myocytes were isolated from the hearts of adult male Wistar rats weighing between 200 and 250 grams. The methods used are described in detail elsewhere (18), with the following differences: Animals were given 1000 units of heparin (Organon Canada, Toronto, Ontario, Canada) 15 min before sacrifice. Animals were then sacrificed with a peritoneal injection of sodium pentobarbital (80 mg/100 g; MTC Pharmaceuticals, Cambridge, Ontario, Canada). Myocytes were dissociated using 0.5 mg/ml Type II Collagenase (LS004177, Worthington Biochemical, Lakewood, NJ). Cells in which the t-tubular volume was measured were kept alive and cultured for 4 h. All other cells were fixed as previously described (18).
Antibodies
Primary antibodies were polyclonal anti-caveolin-1 (AB3823; Chemicon International, Temecula, CA), monoclonal anti-caveolin-2 (610684; BD Biosciences, Mississauga, Ontario, Canada), monoclonal anti-caveolin-3 (610421; BD Biosciences), an affinity purified polyclonal against Cav1.2 (CNC1, gift of Dr W Catterall (19)), a polyclonal against NCX (gift of Dr. K. Philipson (20)), an affinity purified polyclonal antibody against the predominant isoform of the Na+ channel in rat ventricle (rH1; gift of Dr. S. Cohen (21)), and a monoclonal anti-RyR (MA3-916; Affinity BioReagents, Golden, CO). Secondary antibodies were affinity purified and highly adsorbed to minimize species cross-reactivity and were either goat anti-rabbit or goat anti-mouse conjugated to fluorescein isothiocyanate (FITC) or Texas Red (Jackson ImmunoResearch, West Grove, PA).
Labeling
Immunolabeling is as previously described (18) except for labeling cells with the two monoclonals, anti-caveolin-3, and anti-RyR. The cells were first labeled with the anti-RyR antibody and then with a rabbit anti-mouse Fab fragment (250 μg/ml; Jackson ImmunoResearch) before labeling with an anti-rabbit secondary (Fig. 1 A). Cells were then labeled with anti-caveolin-3 and a Texas Red-tagged anti-mouse IgG. The success of the transformation was tested by omitting the anti-caveolin-3 antibody from the protocol. In these experiments the Texas Red-tagged antibody produced no specific labeling, and the images' mean gray level was 17 times dimmer (Fig. 1, B and C).
FIGURE 1.

Labeling with two monoclonal antibodies. Each panel is a single image plane showing the distribution of RyR. (A) Distribution detected by a FITC-tagged anti-rabbit IgG antibody, after the monoclonal anti-RyR antibody had been transformed with a mouse anti-rabbit Fab fragment. Scale bar is 5 μm. (B) The same cell labeled with a Texas Red-tagged anti-mouse IgG and displayed identically to A shows nothing. (C) Image B, displayed 10× brighter, shows only nonspecific labeling.
Imaging
A detailed description of the image capturing system is given in Scriven et al. (18) except we used a 60×/1.4 oil immersion (Nikon) objective and a 4× projection lens. A typical image stack consisted of 60 two-dimensional images (pixel size 100 nm × 100 nm) acquired through the cell at 250 nm intervals.
Image deconvolution
The algorithm is a constrained, iterative approach originally designed for UNIX systems (22,23). It has been rewritten using FFTW, a free, fast Fourier transform library (24) and implemented as a multiuser client/server system on computers running the Linux system (Red Hat, Durham, NC), either stand alone or configured in a Beowulf cluster.
Analysis
Each image was dark current and background subtracted, flat-field corrected, and then deconvolved. Images of control cells were processed identically. After deconvolution, control images were used to identify a threshold intensity which eliminated >99% of the voxels in these images. Voxels that fell below the threshold were set to zero; all other voxels remained unchanged. Images were aligned using the fiduciary markers and the colocalization measured. Only voxels with identical x, y, and z coordinates were regarded as being colocalized.
Isolating layers within the image
To measure how colocalization varies across the diameter of a cell, we had to identify the coordinates of the cell surface. We used the methodology described in Lifshitz et al. (25) in which a surface is mathematically “shrink wrapped” onto the cell surface. The result is illustrated in Fig. 2 in which a three-dimensional reconstruction of the distribution of the RyR (Fig. 2 A) was rotated about the x and y axes for better visualization (Fig. 2 B), then the fitted surface was superimposed (Fig. 2 C). This allowed us to isolate a series of irregular cylinders with a wall thickness of one voxel. The outermost cylinder was the cell surface, and each successive cylinder was one voxel further in. Fig. 2 D shows the fitted cell surface and a layer 15 voxels deep, cross sections of which can be seen in Fig. 2 E. Colocalization and labeling density were calculated for each of the layers.
FIGURE 2.

Fitting the cell surface and generating the internal layers. (A) RyR distribution (image is 23 × 34 × 23 μm). Scale bar is 5 μm in each dimension. (B) Image in A, rotated about the x and y axes as indicated. (C) Image B, with the fitted surface. (D) The fitted surface from C and an interior layer (No. 15). (E) Two 1-μm-thick segments isolated from D.
Statistics of colocalization
To determine whether the observed colocalizations could have occurred by chance, a series of Monte Carlo simulations were performed in which the volume of interest was randomly populated with the same number of red and green voxels as in the experimental image. The simulations used the Mersenne Twister randomizer (26) to ensure random placement of the data points. The simulation was repeated 1000 times to generate a random distribution that was ranked highest to lowest. If the rank of the observed colocalization was in the top 50 of the random distribution (p < 0.05), it was unlikely to have occurred by chance and was regarded as significant. In the interior of the cell, all of the molecules studied were regarded as being close to or on the t-tubular membrane and thus restricted to the t-tubular volume. The total volume used for the simulation was reduced to the estimated t-tubular volume for these simulations.
Measuring the t-tubular volume
Cells in which the t-tubular volume was to be measured were collected in physiological saline solution (PSS) containing 0.1% fatty-acid-free bovine serum albumin (18), then the external calcium concentration was increased to 1 mM, with intermediate steps of 0.2 mM and 0.5 mM by the addition of CaCl2. The cells were then transferred to a modified M199 solution (50 ml M199; 298 mg HEPES; 0.5 g fatty-acid-free bovine serum albumin; 10 mg L-carnitine) on coverslips covered with laminin (1243217; Roche Diagnostics Canada, Laval, Quebec, Canada) for 4 h at 37°C in an atmosphere of 95% O2/5% CO2. They were then immersed in PSS containing 10 μM Di-8-ANEPPS (D3167; Molecular Probes, Eugene, OR) for 10 min in the dark and washed twice in PSS. Cells were imaged using the XF108-2 filter set (Omega Optical, Brattleboro, VT) through a 60×/1.2 water immersion objective (Nikon); voxel size was 100 × 100 × 250 nm. Images were processed as described above.
We estimated the t-tubule volume by isolating the interior of the cell and counting the ratio of lit to dark voxels. The average volume of t-tubules was 9.4% ± 2.6% (mean ± SD; N = 6). This value is greater than that estimated by Soeller and Cannell (27), but in our case, it represents the number of voxels occupied by the t-tubules inside the cell rather than the actual t-tubular volume.
RESULTS
In Fig. 3, we display longitudinal and cross sections from an adult rat ventricular myocyte stained for caveolin-3. The longitudinal images are sections taken from the surface (Fig. 3 A) and the middle (Fig. 3 B) of the cell. The interior of the cell (Fig. 3 B) shows parallel rows running perpendicular to the long axis of the cell surrounded by a bright exterior membrane. The spacing between the rows was 1.89 ± 0.16 μm (mean ± SD, N = 38), comparable to the length of a sarcomere in a relaxed cell, so that this label is most likely associated with the transverse elements of the t-tubule system, which is located at the Z-lines. The surface (Fig. 3 A) shows a considerably more complex pattern than does the interior. There is a large amount of labeling both at and between the Z-lines, as well as longitudinal elements connecting the Z-lines. The two cross sections (Fig. 3 C) show that caveolin-3 is present throughout the cell but labels most intensely at the cell surface. A plot of the density of the caveolin-3 (number lit voxels/total voxels) versus layer number (Fig. 3 D) corresponds well with the impression given in Fig. 3 C. The highest density of caveolae is at the surface and decreases exponentially to a constant level inside the cell. The outermost (surface) layer is numbered zero and increases as one goes deeper into the cell. Because there is some uncertainty in the exact position of the surface, the layer just outside the surface (−1) is also included in the graph.
FIGURE 3.

Distribution of caveolin-3. The image is 47 × 50 × 16 μm, and the scale bar is 5 μm. (A) Caveolin-3 on the myocyte surface. Image is 4 μm deep. (B) The middle section (3 μm deep) shows that caveolin-3 in the interior is on or near the Z-lines and that the labeling intensity is dimmer than the surface. (C) Two cross sections (1 μm deep). D. Density of caveolin-3 labeling as a function of distance from the cell surface (N = 28).
We tested the myocytes to see if either of the two other caveolins, caveolin-1 and caveolin-2, were present. In neither case could the labeling be distinguished from background, and we conclude that these caveolins are either absent from the cardiomyocyte or are present at levels too low for us to detect.
To determine which of the molecules of interest were colocalized with caveolin-3, we performed a series of dual-labeling experiments in which cells were tagged with anti-caveolin-3 in combination with an antibody to one of Cav1.2, RyR, NCX, or the rH1 isoform of the Na+ channel. Sample images from these experiments are presented in Fig. 4. Cav1.2 is abundantly colocalized with caveolin-3 at the cell surface (Fig. 4 A), most prominently near the Z-lines (small arrow), and just under the cell surface (large arrow) but not in the cell interior. There is also colocalization of NCX (Fig. 4 B) and the Na+ channel (Fig. 4 C) with caveolin-3 at the surface, but there are abundant white voxels between the Z-lines (arrow) in both figures. Both NCX and the Na+ channel appeared to be isolated from caveolin-3 in the cell interior. Surprisingly, there is considerable colocalization of caveolin-3 with RyR (Fig. 4 D). This colocalization was prominent at the Z-lines (arrow) forming distinct bands at the cell surface, but unlike the previous images, there appeared to be abundant colocalization throughout the interior of the cell.
FIGURE 4.
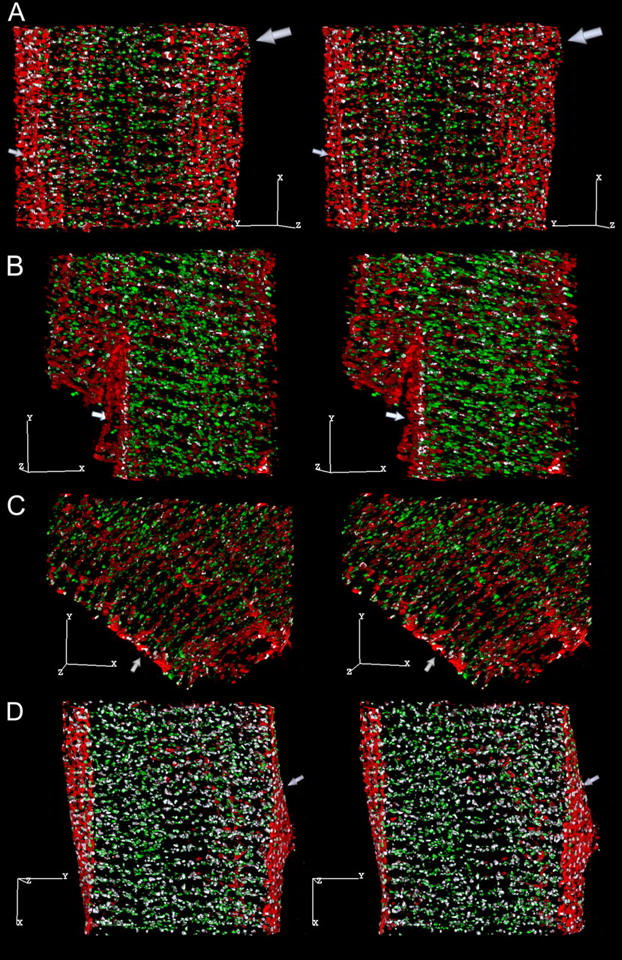
Stereo pairs (6° rotation between images) showing the distribution of caveolin-3 (red) relative to: (A) Cav1.2 (green). The coincident voxels are white, and the scale bar is 5 μm in each dimension in this and all subsequent images. Image dimensions are 22 × 27 × 9.5 μm. There are 14,173 colocalized voxels: 27.5% of the Cav1.2 and 15.7% of the caveolin-3 voxels. The small arrow points to the cell surface, and the large arrow to a region near the surface where the majority of the colocalized voxels appear to be located. (B) NCX (green). Image dimensions are 21 × 22 × 9 μm. There are 8308 coincident voxels: 17.4% of the NCX and 7.8% of the caveolin-3 voxels. The arrow points to colocalized voxels located between the Z-lines on the cell surface. (C) The rH1 isoform of the Na+ channel (green). Image dimensions are 26 × 22 × 6 μm. There are 7785 coincident voxels: 26.2% of the Na+ channel and 10.6% of the caveolin-3 voxels. The arrow points to colocalized voxels between the Z-lines on the cell surface. (D) RyR (green). Image dimensions are 25 × 26 × 10.75 μm. There are 37,414 colocalized voxels: 37.5% of the RyR and 34.5% of the caveolin-3 voxels. The arrow points to a string of colocalized voxels at the Z-line on the cell surface.
A closer examination of the surface shows that the colocalized RyR (Fig. 5 A) and Cav1.2 (Fig. 5 B) lie largely, but not exclusively, on the Z-lines. The distribution of the colocalized NCX and Na+ channel are even more disorganized with ∼40% of the NCX being off the Z-lines (Fig. 5 C), whereas the distribution of the colocalized Na+ channel appears to be random (Fig. 5 D).
FIGURE 5.
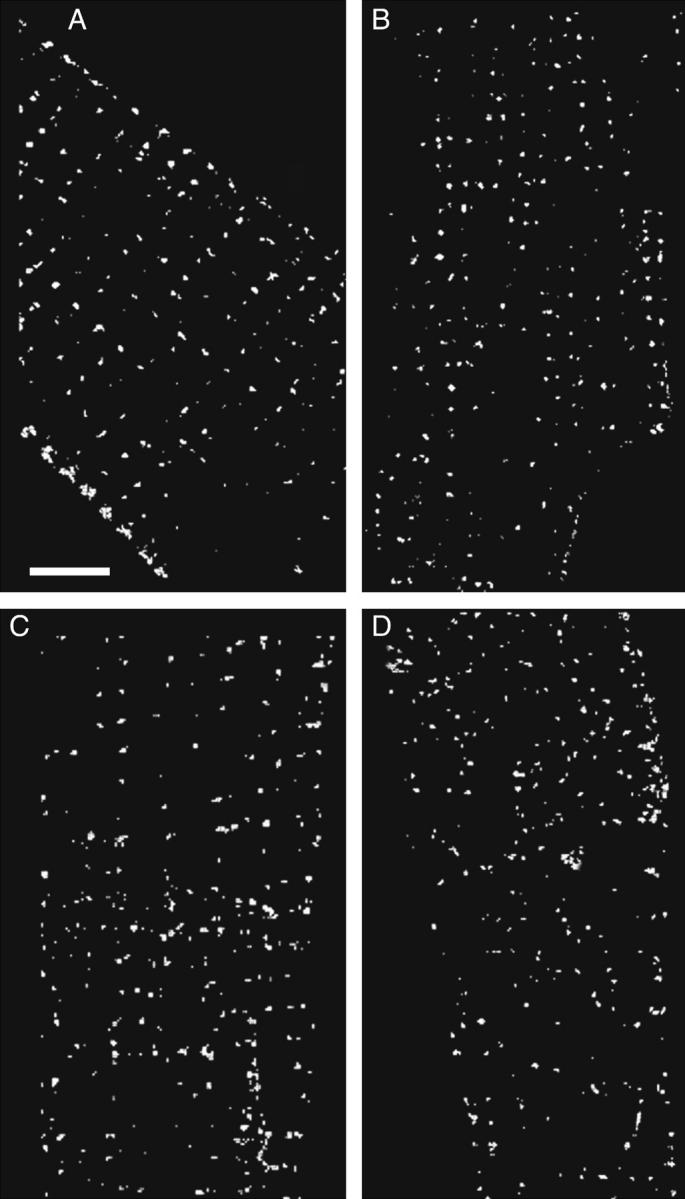
Surface distribution showing colocalization of labeled proteins with caveolin-3. To produce the images, the coordinates of the surface were used to isolate a rind, 1 μm thick, from the cell surface. The resulting images were bisected in x, y to prevent overlap of the front and back surfaces, and only the colocalized voxels were displayed. The scale bar is 5 μm. (A) RyR. (B) Cav1.2. (C) NCX. (D) Na+ channel.
Fig. 6 compares the colocalization measured in the whole cell with the mean values obtained for the surface layers (−1, 0, 1) and three inner layers from the interior (9–11). There is a significant difference between the colocalizations at the surface and in the interior for all four molecules, reflecting the distributions observed in Fig. 4. With the exception of RyR, the majority of the caveolin-3 in the cell interior do not colocalize with the four proteins studied—the average lying between 10% and 15%. The colocalization of NCX and the Na+ channel with caveolin-3 was only significant (using the tests described in the methods) at the surface of the cell but not in the interior (layer 2 and deeper). For this reason we have omitted these two molecules in our examination of colocalization within the cell.
FIGURE 6.

Histogram of colocalization at the surface and the interior of the cell. (A) The percentage of voxels labeled for caveolin-3 that also contained the indicated molecule B. The reverse: the percentage of voxels labeled for the indicated molecule that also contained caveolin-3. (★) denotes a significant difference between the surface and the interior (p < 0.05), (#) denotes a colocalization value significantly greater than predicted by chance (p < 0.05). The number of image pairs examined was Cav1.2 (N = 9); Na+ channel (N = 4); NCX (N = 4); and RyR (N = 11).
Significant interior colocalization was only observed for Cav1.2 and RyR, and a detailed examination is presented in Fig. 7. In those cases where parts of the surface were not in the image, the underlying sections were also excluded from the analysis. Fig. 7 A shows the colocalization of RyR and Cav1.2 with caveolin-3, whereas Fig. 7 B shows the reverse: the colocalization of the caveolin-3 with RyR and Cav1.2. Peak colocalization with caveolin-3 is at the cell surface, and both molecules show a steady decline in colocalization the deeper one goes into the cell. The colocalization of caveolin-3 with RyR is remarkable—after the clearly defined membrane peak, the colocalization increases steadily, reaching a plateau of ∼50% at a depth of eight pixels. Since caveolin-3 is located in the plasma membrane and the RyR is in the SR, this colocalization is interpreted as showing that the molecules are adjacent or close to each other (i.e., < 100 nm apart) rather than in the same place. Statistical significance was calculated as described in Materials and Methods. All of the colocalizations shown in these graphs are significant, satisfying the criteria for the measured t-tubular volume. The density profiles of Cav1.2 and RyR (Fig. 7 C) are quite different from that of caveolin-3 (Fig. 3 D)—after the peak at the membrane, the density remains almost constant with depth, with the density of the Cav1.2 in the interior being almost the same as that of caveolin-3.
FIGURE 7.
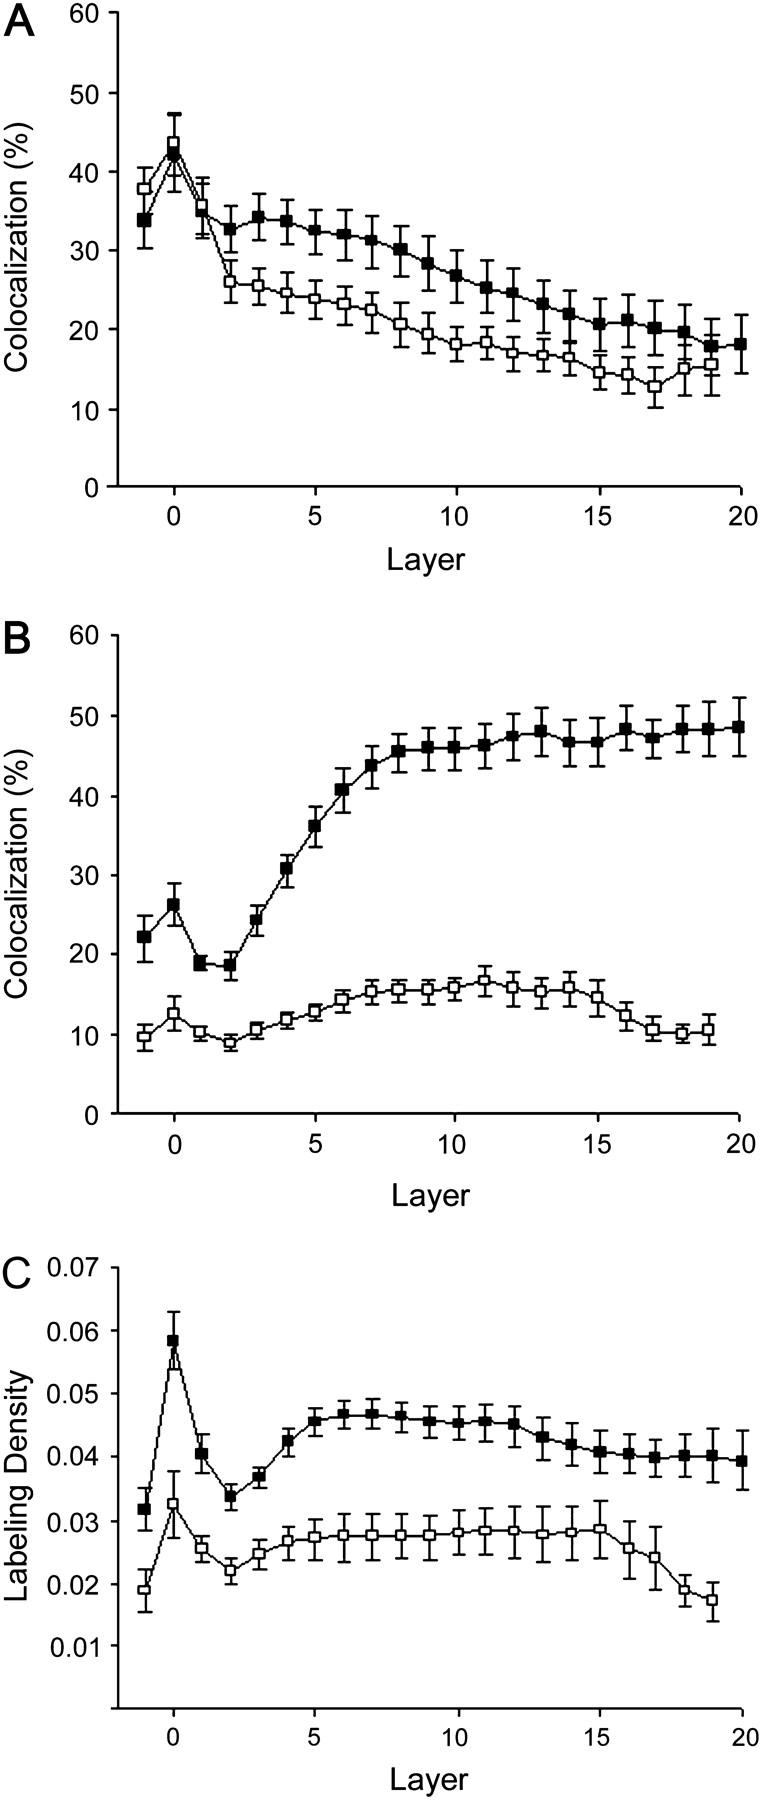
(A) Percentage of voxels labeled for RyR (▪) or Cav1.2 (□) that also contained caveolin-3. (B) The percentage of voxels labeled for caveolin-3 that also contained RyR (▪) or Cav1.2 (□). (C) Labeling density, i.e., number of lit voxels/total voxels, for RyR (▪) and Cav1.2 (□).
DISCUSSION
We have used established imaging protocols and image analysis routines (18) to investigate the distribution of caveolae relative to proteins that regulate ion concentrations in rat ventricular myocytes. Our principal conclusions are a), caveolin-3 strongly colocalizes with a subpopulation of RyR in the interior of the cell; b), there are regional differences in the colocalization of caveolin-3 with various proteins; and c), the majority of the colocalization of Cav1.2, NCX, and the Na+ channel with caveolin-3 occur at or near the cell surface.
Protein distribution
Cells labeled with anti-caveolin-3 fluoresce brightest at the cell surface and intercalated discs, with dimmer fluorescence originating from the transverse elements of the tubular system (Fig. 3). Measurements of the density of caveolin-3, calculated as the number of lit voxels divided by the total number of voxels in the cylinder, show a peak at the surface followed by an exponential decrease as one goes deeper into the interior (Fig. 3 D). These observations agree with the earlier work done by electron microscopists who identified caveolae both on the surface and in the t-tubules (6,28) and found that the density of caveolae is lower in the t-tubules than on the cell surface (6). The density profiles of the calcium channel and the RyR (Fig. 7 C) are quite different from that of caveolin-3 (Fig. 3 D)—after the peak at the membrane, the density remains almost constant with depth. This leads us to believe that the changes in the caveolin-3 density are real and do not represent an artifact due to poor penetration by the antibody. In addition, the caveolin-3 density curve becomes flat rather than continuing to decrease, which one would expect if most of the antibody were being absorbed by the high-density surface sites.
A notable feature of our results is the differing densities of the RyR and Cav1.2 labeling, with Cav1.2 having ∼½ the labeling density of RyR (Fig. 7 C). This result is consistent with our earlier data (18) and with ligand binding assays of these two molecules (29). Although these assays would support our findings, we also investigated whether the differing densities might have arisen from our choice of thresholds. If a significant proportion of the Cav1.2 labeling was dim, i.e., at or below the estimated threshold, both the density and the colocalization of Cav1.2 would depend on our choice of threshold. This was not the case, both the ratio of RyR to Cav1.2 and the colocalization results were robust and showed little variation even when the threshold was varied from one-half to twice its selected value.
Colocalization at the surface
All of the molecules show a statistically significant colocalization with caveolin-3 at or near the surface. About one-half of the RyR and Cav1.2 are colocalized with the caveolae at the surface, dropping to ∼20% in the interior, with similar patterns for NCX and the Na+ channel. RyR and Cav1.2 are mostly colocalized with the caveolae at the mouth of the t-tubules (Fig. 5, A and B), although there is some colocalization between the t-tubules. The colocalizations of RyR and Cav1.2 with caveolin-3 at the surface are almost identical (Figs. 6 and 7), which suggests that the RyR and Cav1.2 are grouped together, probably in the dyads. Our results are consistent with a model in which most of the surface colocalization results from caveolae being close to dyads containing both Cav1.2 and RyR and located just below the surface in the t-tubules, whereas the rest is between caveolae and peripheral couplings that lie between the Z-lines. Because the surface colocalization values are so similar, it would seem that there are few extradyadic Cav1.2 colocalizing with the caveolae on the surface. Franzini-Armstrong and her colleagues (30) have observed clusters of caveolae at the mouth of the t-tubules in frog skeletal muscle, but there has been no confirmation of any similar structure in the cardiomyocyte.
The reverse graph (caveolin-3 versus RyR and Cav1.2; Fig. 7 B) shows a difference in the colocalization of caveolin-3 with RyR compared with that between caveolin-3 and Cav1.2. However, this difference is probably due to the density of Cav1.2 being one-half that of RyR (Fig. 7 C), which, when corrected for, gives the same colocalization values for the two molecules.
The distribution of the colocalized NCX is more disorganized than that of either RyR or Cav1.2, with ∼½ of the colocalization between the Z-lines away from the t-tubules (Fig. 5 C), whereas the distribution of the colocalized Na+ channel on the surface seems to be almost random (Fig. 5 D). These observations suggest that the NCX and Na+ channel are colocalizing with different sets of caveolae and support the contention of our earlier study (18) in which we determined that the two molecules resided in different membrane domains.
Colocalization in the cell interior
Both NCX and the Na+ channel showed some colocalization with caveolin-3 in the interior; however, statistical analysis indicated that these values could have occurred by chance, and it is thus unlikely that there is any association between the caveolae and these two molecules inside the cell. The colocalization of the other two proteins studied, RyR and Cav1.2, was highly significant (p < 0.05), irrespective of the value chosen for the t-tubular volume (either our value of 9% or the 3% of Soeller and Cannell (27)), although there is a great disparity between the degree of colocalization exhibited by the two molecules. In particular, the colocalization between caveolin-3 and the RyR was high, with values of 70% being observed in some cases, which implies that the majority of the interior caveolae are colocalized with RyRs. The reverse is not true; the percentage of RyR that colocalizes with caveolin-3 varies from 40% at the surface to 20% in the interior.
Although there are no caveolae within the dyad (7), the RyR and Cav1.2 colocalizations might be explained by the caveolae being close to the dyads. However, since the RyR and Cav1.2 in the dyad are within 20 nm of each other, caveolae that are close enough to the dyad to colocalize with RyR should colocalize with Cav1.2 to an equal extent, which is not the case (Fig. 7 B). On average, only one-third as many of the interior caveolae colocalize with Cav1.2 as with RyR. Even if we correct for the different densities of these two molecules and if we assume that all of the Cav1.2 and their associated RyR are located in dyads, this would imply that a substantial portion of the colocalization between the caveolae-3 and RyR is occurring with RyR not colocalized with Cav1.2 and which are therefore outside the dyads. In an earlier article (18), we showed that ∼40% of the voxels labeled for RyR in a cardiomyocyte do not colocalize with calcium channels and it is likely that it is these channels, or a subset of them, that are colocalizing with caveolin-3.
We propose that the RyR that colocalize with the caveolae represent a separate domain whose characteristics are modulated by the signaling molecules residing in the caveolae. There is indirect evidence that such a subpopulation of receptors exist: Experiments using dextran in live ventricular cardiomyocytes to flatten the caveolae (31) have shown that the number of sparks generated in the myocyte decrease when dextran is applied. Since there are no caveolae within the dyad, this result only makes sense if a secondary system is being affected. Jorgensen and her co-workers (32) have described a subpopulation of RyR that are separate from the dyad and its associated calcium channels and are situated in the corbular SR. This offshoot of the network SR is present in rat atrial (33), papillary (32), and ventricular muscle (34,35) and contains ∼40% of the RyR in the myocyte (32), which would fit well with the group that colocalizes with the caveolae. Although corbular SR is found preferentially near the Z-band (35), there is no direct evidence that would allow us to show that the RyR in corbular SR is equivalent to those that colocalize with the caveolae.
Caveolae have long been associated with endothelial nitric oxide synthase (NOS3) (1), which produces nitric oxide (NO). NO is known to have a variety of effects on the RyR, either directly by nitrosylation or indirectly via protein kinase A and G (36). NO in the cardiomyocyte can be generated from a variety of sources including endothelial caveolae, cardiomyocyte caveolae, and neuronal NO synthase (NOS1) situated in the SR, and because of this it has been difficult to identify where NO causing a specific effect comes from. Champion et al. (37) have been able to transfect NOS3-null mice with NOS3 targeted to the myocyte and have shown that it locates in the caveolae and is involved in the β-adrenergic, muscarinic, and frequency-dependent response of the heart, establishing a modulating role for the myocyte caveolae.
Unlike the RyR, the colocalization between Cav1.2 and caveolin-3 in the interior cannot be split into different categories. The colocalization could be due to caveolae being close to the dyad, caveolae being close to or containing extradyadic Cav1.2, or a combination of both of these.
Freeze-fracture studies of the caveola membrane in cardiomyocytes from both rat and rabbit show that few particles are present (7). This indicates that these caveolae are sparsely inhabited by transmembrane proteins: a characteristic that they share with caveolae in frog skeletal muscle (38) and mouse fibroblasts (39). These observations need to be reconciled with our results showing significant regional colocalizations of NCX, the Na+ channel, and Cav1.2. There seem to be two possible explanations: First, the colocalization may arise from the relatively few transmembrane proteins within the caveolae. Second, the channels and transporter could be located just outside the caveolae. A positive colocalization of two proteins means that they are within a box 100 × 100 × 250 nm. The two channels and the exchanger could either be located within the caveola or close to it, with both situations producing a positive colocalization.
RyR-caveolin-3 colocalization in other species
Since there is considerable variation between species, we were concerned that the colocalization between RyR and caveolin-3 was a characteristic unique to the rat. To test this, we performed the RyR-caveolin-3 colocalization experiment on isolated, fixed canine cardiomyocytes (gift of Dr. David Fedida). The results confirmed our finding in the rat with a high colocalization of 42% between caveolin-3 and RyR in the interior of the cardiomyocyte, suggesting that the positioning of caveolin-3 adjacent to isolated RyR in the cell interior is a characteristic of other mammalian cardiomyocytes.
SUMMARY
Our results indicate that caveolae vary considerably in both what molecules they contain and which molecules they are adjacent to. On the myocyte surface, there are caveolae associated with the dyads, NCX, and with Na+ channels. These must be different populations since NCX, Na+ channels, and dyads are physically separate from each other. In addition, since ∼65% of the surface voxels containing caveolin-3 colocalized with nothing that we tested, there must be other populations of caveolae as well. The functional consequences of this organization are unclear.
Along the t-tubules in the interior of the myocyte, caveolae are situated within 100 nm of the extradyadic RyR, a distance that is well within the range of influence of the caveolar NOS3. This, and the fact that caveolae can regulate cardiac contractile force, suggests that the caveolae could modulate Ca2+ release from the SR. Such an arrangement would provide a secondary system, separate from the dyads, which would allow receptors (such as β2-adrenergic or muscarinic) and signaling molecules situated in the caveolae to modulate the contractile force.
Acknowledgments
We thank Brian Lee (a student in the Heart and Stroke Foundation's High School Summer Research Program) for drawing the surfaces, and Prof. Larry Lifshitz for useful discussions on the statistical analysis.
This work was supported by grants from the Canadian Institutes of Health Research and the Heart and Stroke Foundation of British Columbia & Yukon to E.D.W.M.
References
- 1.Razani, B., S. E. Woodman, and M. P. Lisanti. 2002. Caveolae: from cell biology to animal physiology. Pharmacol. Rev. 54:431–467. [DOI] [PubMed] [Google Scholar]
- 2.Parton, R. G. 1996. Caveolae and caveolins. Curr. Opin. Cell Biol. 8:542–548. [DOI] [PubMed] [Google Scholar]
- 3.Song, K. S., P. E. Scherer, Z. Tang, T. Okamoto, S. Li, M. Chafel, C. Chu, S. Kohtz, and M. P. Lisanti. 1996. Expression of caveolin-3 in skeletal, cardiac, and smooth muscle cells. J. Biol. Chem. 271:15160–15165. [DOI] [PubMed] [Google Scholar]
- 4.Rybin, V. O., P. W. Grabham, H. Elouardighi, and S. F. Steinberg. 2003. Caveolae-associated proteins in cardiomyocytes: caveolin-2 expression and interactions with caveolin-3. Am. J. Physiol. Heart Circ. Physiol. 285:H325–H332. [DOI] [PubMed] [Google Scholar]
- 5.Hagiwara, Y., Y. Nishina, H. Yorifuji, and T. Kikuchi. 2002. Immunolocalization of caveolin-1 and caveolin-3 in monkey skeletal, cardiac and uterine smooth muscles. Cell Struct. Funct. 27:375–382. [DOI] [PubMed] [Google Scholar]
- 6.Page, E. 1978. Quantitative ultrastructural analysis in cardiac membrane physiology. Am. J. Physiol. Cell Physiol. 235:C147–C158. [DOI] [PubMed] [Google Scholar]
- 7.Levin, K. R., and E. Page. 1980. Quantitative studies on plasmalemmal folds and caveolae of rabbit ventricular myocardial cells. Circ. Res. 46:244–255. [DOI] [PubMed] [Google Scholar]
- 8.Parton, R. G., M. Way, N. Zorzi, and E. Stang. 1997. Caveolin-3 associates with developing t-tubules during muscle differentiation. J. Cell Biol. 136:137–154. [DOI] [PMC free article] [PubMed] [Google Scholar]
- 9.Carozzi, A. J., E. Ikonen, M. R. Lindsay, and R. G. Parton. 2000. Role of cholesterol in developing t-tubules: analogous mechanisms for t-tubule and caveolae biogenesis. Traffic. 1:326–341. [DOI] [PubMed] [Google Scholar]
- 10.Galbiati, F., J. A. Engelman, D. Volonte, X. L. Zhang, C. Minetti, M. Li, H. Hou Jr., B. Kneitz, W. Edelmann, and M. P. Lisanti. 2001. Caveolin-3 null mice show a loss of caveolae, changes in the microdomain distribution of the dystrophin-glycoprotein complex, and t-tubule abnormalities. J. Biol. Chem. 276:21425–21433. [DOI] [PubMed] [Google Scholar]
- 11.Fujimoto, T. 1993. Calcium pump of the plasma membrane is localized in caveolae. J. Cell Biol. 120:1147–1157. [DOI] [PMC free article] [PubMed] [Google Scholar]
- 12.Liu, L., K. Mohammadi, B. Aynafshar, H. Wang, D. Li, J. Liu, A. V. Ivanov, Z. Xie, and A. Askari. 2003. Role of caveolae in the signal transducing function of cardiac Na+/K+-ATPase. Am. J. Physiol. Cell Physiol. 284:C1550–C1560. [DOI] [PubMed] [Google Scholar]
- 13.Yarbrough, T. L., T. Lu, H. C. Lee, and E. F. Shibata. 2002. Localization of cardiac sodium channels in caveolin-rich membrane domains: regulation of sodium current amplitude. Circ. Res. 90:443–449. [DOI] [PubMed] [Google Scholar]
- 14.Bossuyt, J., B. E. Taylor, M. James-Kracke, and C. C. Hale. 2002. Evidence for cardiac sodium-calcium exchanger association with caveolin-3. FEBS Lett. 511:113–117. [DOI] [PubMed] [Google Scholar]
- 15.Xiang, Y., V. O. Rybin, S. F. Steinberg, and B. Kobilka. 2002. Caveolar localization dictates physiologic signaling of Beta 2-adrenoceptors in neonatal cardiac myocytes. J. Biol. Chem. 277:34280–34286. [DOI] [PubMed] [Google Scholar]
- 16.Feron, O., X. Han, and R. A. Kelly. 1999. Muscarinic cholinergic signaling in cardiac myocytes: dynamic targeting of m2AChR to sarcolemmal caveolae and eNOS activation. Life Sci. 64:471–477. [DOI] [PubMed] [Google Scholar]
- 17.Lasley, R. D., P. Narayan, A. Uittenbogaard, and E. J. Smart. 2000. Activated cardiac adenosine A(1) receptors translocate out of caveolae. J. Biol. Chem. 275:4417–4421. [DOI] [PubMed] [Google Scholar]
- 18.Scriven, D. R. L., P. Dan, and E. D. W. Moore. 2000. Distribution of proteins implicated in excitation-contraction coupling in rat ventricular myocytes. Biophys. J. 79:2682–2691. [DOI] [PMC free article] [PubMed] [Google Scholar]
- 19.Hell, J. W., C. T. Yokoyama, S. T. Wong, C. Warner, T. P. Snutch, and W. A. Catterall. 1993. Differential phosphorylation of two size forms of the neuronal class C L-type calcium channel α1 subunit. J. Biol. Chem. 268:19451–19457. [PubMed] [Google Scholar]
- 20.Frank, J. S., G. Mottino, D. Reid, R. S. Molday, and K. D. Philipson. 1992. Distribution of the Na+-Ca2+ exchange protein in mammalian cardiac myocytes: an immunofluorescence and immunocolloidal gold-labeling study. J. Cell Biol. 117:337–345. [DOI] [PMC free article] [PubMed] [Google Scholar]
- 21.Cohen, S. A., and L. K. Levitt. 1993. Partial characterization of the rH1 sodium channel protein from rat heart using subtype-specific antibodies. Circ. Res. 73:735–742. [DOI] [PubMed] [Google Scholar]
- 22.Carrington, W. A., and K. E. Fogarty. 1987. 3-D molecular distribution in living cells by deconvolution of optical section using light microscopy. Proc. 13th Annual Northeast Bioengineering Conf. K. R. Foster, editor. 108–110.
- 23.Carrington, W. A., R. M. Lynch, E. D. W. Moore, G. Isenberg, K. E. Fogarty, and F. S. Fay. 1995. Superresolution three-dimensional images of fluorescence in cells with minimal light exposure. Science. 268:1483–1487. [DOI] [PubMed] [Google Scholar]
- 24.Johnson, S. G., and M. Frigo. 2005. The design and implementation of FFTW3. Proc. IEEE. 93:216–231. [Google Scholar]
- 25.Lifshitz, L. M., J. A. Collins, E. D. Moore, and J. Gauch. 1994. Computer vision and graphics in fluorescence microscopy. IEEE Workshop on Biomedical Analysis. IEEE Computer Society Press, Los Alamitos, CA. 166–175.
- 26.Matsumoto, M., and T. Nishimura. 1998. Mersenne twister: a 623-dimensionally equidistributed uniform pseudo-random number generator. ACM Trans. Model. Comput. Simul. 8:3–30. [Google Scholar]
- 27.Soeller, C., and M. B. Cannell. 1999. Examination of the transverse tubular system in living cardiac rat myocytes by 2-photon microscopy and digital image-processing techniques. Circ. Res. 84:266–275. [DOI] [PubMed] [Google Scholar]
- 28.Gabella, G. 1978. Inpocketings of the cell membrane (caveolae) in the rat myocardium. J. Ultrastruct. Res. 65:135–147. [DOI] [PubMed] [Google Scholar]
- 29.Bers, D. M., and V. M. Stiffel. 1993. Ratio of ryanodine to dihydropyridine receptors in cardiac and skeletal muscle and implications for E-C coupling. Am. J. Physiol. Cell Physiol. 264:C1587–C1593. [DOI] [PubMed] [Google Scholar]
- 30.Franzini-Armstrong, C., L. Landmesser, and G. Pilar. 1975. Size and shape of transverse tubule openings in frog twitch muscle fibers. J. Cell Biol. 64:493–497. [DOI] [PMC free article] [PubMed] [Google Scholar]
- 31.Lohn, M., M. Furstenau, V. Sagach, M. Elger, W. Schulze, F. C. Luft, H. Haller, and M. Gollasch. 2000. Ignition of calcium sparks in arterial and cardiac muscle through caveolae. Circ. Res. 87:1034–1039. [DOI] [PubMed] [Google Scholar]
- 32.Jorgensen, A. O., A. C. Shen, W. Arnold, P. S. McPherson, and K. P. Campbell. 1993. The Ca2+-release channel/ryanodine receptor is localized in junctional and corbular sarcoplasmic reticulum in cardiac muscle. J. Cell Biol. 120:969–980. [DOI] [PMC free article] [PubMed] [Google Scholar]
- 33.Yamasaki, Y., Y. Furuya, K. Araki, K. Matsuura, M. Kobayashi, and T. Ogata. 1997. Ultra-high-resolution scanning electron microscopy of the sarcoplasmic reticulum of the rat atrial myocardial cells. Anat. Rec. 248:70–75. [DOI] [PubMed] [Google Scholar]
- 34.Forbes, M. S., and N. Sperelakis. 1983. The membrane systems and cytoskeletal elements of mammalian myocardial cells. Cell Muscle Motil. 3:89–155. [DOI] [PubMed] [Google Scholar]
- 35.Ogata, T., and Y. Yamasaki. 1990. High-resolution scanning electron microscopic studies on the three-dimensional structure of the transverse-axial tubular system, sarcoplasmic reticulum and intercalated disc of the rat myocardium. Anat. Rec. 228:277–287. [DOI] [PubMed] [Google Scholar]
- 36.Massion, P. B., and J. L. Balligand. 2003. Modulation of cardiac contraction, relaxation and rate by the endothelial nitric oxide synthase (eNOS): lessons from genetically modified mice. J. Physiol. 546:63–75. [DOI] [PMC free article] [PubMed] [Google Scholar]
- 37.Champion, H. C., D. Georgakopoulos, E. Takimoto, T. Isoda, Y. Wang, and D. A. Kass. 2004. Modulation of in vivo cardiac function by myocyte-specific nitric oxide synthase-3. Circ. Res. 94:657–663. [DOI] [PubMed] [Google Scholar]
- 38.Dulhunty, A. F., and C. Franzini-Armstrong. 1975. The relative contributions of the folds and caveolae to the surface membrane of frog skeletal muscle fibres at different sarcomere lengths. J. Physiol. 250:513–539. [DOI] [PMC free article] [PubMed] [Google Scholar]
- 39.Westermann, M., H. Leutbecher, and H. W. Meyer. 1999. Membrane structure of caveolae and isolated caveolin-rich vesicles. Histochem. Cell Biol. 111:71–81. [DOI] [PubMed] [Google Scholar]