

Abstract
We examine here the dynamics of forming the Michaelis complex of the enzyme lactate dehydrogenase by characterizing the binding kinetics and thermodynamics of oxamate (a substrate mimic) to the binary lactate dehydrogenase/NADH complex over multiple timescales, from nanoseconds to tens of milliseconds. To access such a wide time range, we employ standard stopped-flow kinetic approaches (slower than 1 ms) and laser-induced temperature-jump relaxation spectroscopy (10 ns–10 ms). The emission from the nicotinamide ring of NADH is used as a marker of structural transformations. The results are well explained by a kinetic model that has binding taking place via a sequence of steps: the formation of an encounter complex in a bimolecular step followed by two unimolecular transformations on the microsecond/millisecond timescales. All steps are well described by single exponential kinetics. It appears that the various key components of the catalytically competent architecture are brought together as separate events, with the formation of strong hydrogen bonding between active site His195 and substrate early in binding and the closure of the catalytically necessary protein surface loop over the bound substrate as the final event of the binding process. This loop remains closed during the entire period that chemistry takes place for native substrates; however, motions of other key molecular groups bringing the complex in and out of catalytic competence appear to occur on faster timescales. The on-enzyme Kd values (the ratios of the microscopic rate constants for each unimolecular step) are not far from one. Either substantial, ∼10–15%, transient melting of the protein or rearrangements of hydrogen bonding and solvent interactions of a number of water molecules or both appear to take place to permit substrate access to the protein binding site. The nature of activating the various steps in the binding process seems to be one overall involving substantial entropic changes.
INTRODUCTION
Just how proteins bind their ligands, the specific pathway(s), the time ordering of events, and the motions of the atoms and groups of atoms involved in the binding process is largely uncharacterized. This dynamical process covers a wide range of timescales: small-scale displacement of atoms takes place from picoseconds to nanoseconds; activated motions of molecular groups, such as loop motion, occur within nanoseconds/microseconds; and the motions of protein domains or smaller scale group motions with high activation energies are observed on the millisecond timescale or longer. Generally, we know little about the dynamical nature of proteins, despite how important this is to how proteins function. This is partly because timescales shorter than milliseconds have been difficult to access experimentally.
We examine here the binding pathway of a substrate mimic to the enzyme lactate dehydrogenase (LDH) over multiple timescales, from nanoseconds to milliseconds, at which time the binding step is complete. This efficient enzyme catalyzes the direct transfer of a hydride ion from the pro-R face of the reduced nicotinamide group of NADH to the C2 carbon of pyruvate (Fig. 1), producing NAD+ and the alcohol lactate, accelerating the solution chemical reaction by some 14 orders of magnitude (1). Binding of substrate to LDH is ordered and follows the formation of the LDH/NADH binary complex. The substrate binding pocket lies somewhat deep into the protein (2,3). It supplies the catalytically crucial His195, and the preformed pocket also “solvates” the substrate's charged carboxyl group by supplying Arg171 (4). Once the substrate reaches positioning close enough to the enzyme's active site, a number of events take place. A surface loop, or flap, of the polypeptide chain (residues 98–110; often referred to as the “mobile loop”) closes over the active site entrance, the key catalytic residue Arg109 located on the loop is brought deep into the active site in close contact with substrate, water leaves the binding pocket, and the enzyme tightens around the bound substrate and NADH, bringing them close together in a proper geometry for reaction. These protein structural changes “activate” pyruvate and NADH for catalysis (4–6). The rate-limiting step in the turnover of LDH is not the chemical hydride transfer step but rather the final closure of the mobile loop over the substrate binding pocket, occurring in a time of ∼1–10 ms (7).
FIGURE 1.

Cartoon of the active site of lactate dehydrogenase showing the relative arrangement of reacting groups (not to scale). The substrate pyruvate is shown; the −CH3 group is replaced by −NH2 to form oxamate. Hydride transfer catalyzed by LDH is indicated by the arrow, hydrogen transfer by light arrow. Catalysis is brought about in lactate dehydrogenase by 1), binding interactions to bring about the correct hydrogen on the C4 group of NADH brought close, and correctly positioned, to the C2 carbon of substrate; 2), the stabilization of developing negative charge on the keto oxygen of substrate in the transition state by electrostatic interactions with His195 and Arg109 (located on the mobile loop); 3), general acid/base catalysis facilitating a proton shuttling between His195 and the substrate oxygen; and 4), ground-state distortion of the nicotinamide ring of NADH to a boat geometry, which brings the cofactor closer to the transition state geometry.
We are able to examine kinetic behavior from 20 ns to any slower time. Transient behavior slower than 1 ms is monitored by standard stopped-flow approaches. To access transient behavior of the binding process faster than milliseconds, we employ laser-induced temperature-jump (T-jump) relaxation spectroscopy (8–10). T-jump relaxation experiments monitor the return to equilibrium of a chemical system after a sudden increase in temperature, produced in our studies by absorption of pulsed laser light tuned to a weak near infrared water band. Laser induced T-jumps of 20°C can be induced in as short a time as 10 ps (10). As the system relaxes to the new equilibrium point, a structurally sensitive spectroscopic probe is used to follow the recovery kinetics. For our studies, the fluorescence emission of the reduced nicotinamide moiety of NADH reports on the time evolution of the binding of the substrate mimic, oxamate, to LDH/NADH from 20 ns using the combined stopped-flow (times >1 ms) and T-jump relaxation spectroscopy (limited from 20 ns to 10 ms in our spectrometer) studies. We employ a nonactive substrate mimic in these studies to preclude the occurrence of enzyme catalyzed chemistry. In this way, atomic motion associated with the binding pathway can be separated from that associated with chemical steps occurring during catalysis. Oxamate (NH2(C=O)COO−) has long been used as a surrogate for pyruvate. It is isoelectric and isosteric to pyruvate; its dissociation constant with LDH/NADH is close to that of pyruvate's Km; and it has been shown to have binding kinetics very similar to that of pyruvate (11,12).
MATERIALS AND METHODS
Materials
Pig heart L-lactate dehydrogenase was obtained from Roche Scientific (Basel, Switzerland) as a suspension in ammonium sulfate solution at 10 mg/ml and dialyzed three times against 0.1 M sodium phosphate buffer (pH 7.2) at 4°C overnight. Enzyme solutions were passed through 0.45 μm filters. Concentrations were determined by ultraviolet (UV) absorption (using A280 = 53 mN−1 cm−1). If necessary, enzyme was reconcentrated by centrifugation. Activity was determined by NADH conversion for each sample of enzyme prepared (13,14). Oxamate (NH2(C=O)COO−, oxamic acid as sodium salt) and NADH were obtained from Acros Organics (Geel, Belgium) and Boehringer-Mannheim (Ingelheim, Germany) respectively. Stock solutions of oxamate and NADH were kept no longer than 24 h. Concentrations of stock NADH solutions were determined by weight and checked by UV absorption (A340 = 6.22 mM−1 cm−1). Mixtures of NADH/LDH were incubated at 4°C for 30 min before addition of oxamate. For T-jump measurements, oxamate stock solutions were added to the LDH/NADH solution; the sample was then mixed, loaded into T-jump cuvettes, and allowed to equilibrate for 60 min before measurement. Since the emission spectrum of NADH depends strongly on whether it is found free in solution or as a binary or ternary protein complex (Fig. 2), the temperature dependent Kd values for LDH binding NADH were measured by monitoring enhancement of NADH fluorescence at 450 nm during titration of NADH into LDH solutions; the resulting curves were fit with a single binding quadratic. Typical solution concentrations were LDH 1 μN and NADH 0–20 μM.  at 15, 20, 25, 30, and 35°C, respectively. The plot of Ln(
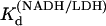 ) versus 1/T was linear within the measurement uncertainty, with an enthalpy of 16 (±2) kcal/mol. Temperature-dependent Kd values for oxamate binding to the binary complex (LDH/NADH) were determined similarly, with oxamate titrations into LDH/NADH solutions. Typical concentrations were LDH 2 μN, NADH 60 μM, and oxamate 0–120 μM. Fluorescence quenching was monitored at 450 nm and fit to single binding equations.
  at 15, 20, 25, 30, and 35°C, respectively. The plot of Ln(
 versus 1/T was linear within the measurement uncertainty, with enthalpy of 13.3 (±1.8) kcal/mol at 25°. The temperature variation of
  agreed with that previously determined (14). The equilibrium values of
 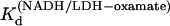 and
and  were used to calculate the free reactant concentrations in the stopped-flow and T-jump measurements.
FIGURE 2.

Relative NADH emission, in arbitrary units, versus wavelength as excited at 360 nm for (A) LDH/NADH at 40/40 μN; (B) NADH at 43 μN; and (C) LDH/NADH·oxamate at 40:40:970 μN.
T-jump spectrometer
The temperature jump fluorescence relaxation kinetic setup has been previously described (15). Light from a pulsed Nd:YAG laser, operating at 1064 nm and Raman shifted to 1540 nm, provides sufficient energy to produce a temperature jump in water of up to 20°C. Fluorescence excitation was provided by an Ar+ laser. In these experiments, we used a group of lines near 360 nm for NADH excitation; power levels incident on the sample were set so as to cause minimal sample photo-damage, typically 5–10 mW focused into a 300 μm diameter spot. Detection is by an off-axis photomultiplier tube with emission wavelength selected by a bandpass filter (Coherent No. 35-5024, centered at 450 nm with a full width at half-maximum of 40 nm). Real-time determination of temperature in the excitation volume was done by measurement of light transmission at 1460 nm, the maximum of a water absorption band. The cuvette holder is water jacketed, with the temperature (the initial temperature of the sample before the jump) controlled by a water bath.
In every measurement cycle, the excitation laser beam was opened 4 ms before the heating pulse and closed 15 ms after the pulse to prevent UV bleaching of sample. Temperature of the heated volume returns to initial value after ∼300 ms. The spectrometer is operated at 1 Hz, and the results of all measurements are averaged. The experiments described here typically required 1500–3000 individual measurements to obtain the desired signal/noise ratio.
Stopped-flow kinetics system
Stopped-flow measurements were made on an Applied Photophysics (Leatherhead, UK) π*-180 stopped-flow instrument (dead time 1 ms) using a 75 W Xe lamp as a light source, with emission and excitation monochromators set at 340 nm and 450 nm, respectively. The drive syringes and reaction chamber were water jacketed to allow for temperature control. The detection photomultiplier tube voltage was calibrated to optimize the postmixing signal using reaction mixtures of LDH/NADH and excess oxamate. Mixing measurements with oxamate were made with syringe 1 loaded with premixed and equilibrated LDH/NADH solutions, and syringe 2 loaded with oxamate solutions; 1:1 mixing was used, so concentrations in both syringes were twice the desired final reaction concentration. Each mixing reaction used 100 μL from each syringe (for total reaction volume 200 μL). Typical measurements involved sequential “shots” of 1:1 mixing, which were then averaged over 15–20 shots.
RESULTS
We examined the kinetic nature of oxamate binding to the “binary complex” (consisting of pig heart H4 lactate dehydrogenase and its cofactor, NADH) to form the ternary LDH/NADH·oxamate complex (cofactor/enzyme with oxamate bound will henceforth be referred to as the ternary complex). We found dynamic behavior on multiple timescales. In the range of milliseconds or slower, we employed standard stopped-flow fast-mixing techniques. For faster times, we employed laser-induced temperature jump relaxation spectroscopy. Here, the equilibrium of the chemical system,
 |
(1) |
is suddenly perturbed by a rapid change in temperature, induced by irradiating the protein solution with a nanosecond pulse of near infrared (IR) laser light, bringing the system to a final temperature, Tf, within ∼7 ns. As the system relaxes to its new equilibrium point at Tf, the change in concentration of the binary and ternary protein complexes is monitored by a structurally sensitive probe, in this case NADH fluorescence (9). Fig. 2 shows the relative emission profiles of NADH, alone and complexed with LDH and LDH·oxamate. The cofactor fluorescence is strongly quenched when oxamate binds to the binary complex; hence, large signal changes are observed when the ternary complex converts to the binary complex.
T-jump experiments
Samples of LDH/NADH and oxamate were mixed and loaded into 200 μl cuvettes for T-jump measurement; [LDH]total and [NADH]total were generally held constant, whereas [oxamate]total was varied. For each sample of LDH/NADH and oxamate, T-jump measurements were done over a range of final temperatures. The Kd of NADH binding to LDH is 0.5 μM at 25°C (see Materials and Methods) so that, under the stoichiometric conditions here of, e.g., [LDH] = 60 μN (pig heart LDH is a tetramer with four independent binding sites; all [LDH] concentrations herein are in units of “normality”, indicating moles of binding sites) and [NADH] = 60 μM, virtually all of the protein and cofactor are bound up as the binary complex. Some trace signals (see below) in the T-jump studies were observed that correspond to the release of NADH from LDH/NADH, but these signals were quite small (as could be predicted for our conditions), and are not reported in this study. The dynamics of NADH release from LDH has been reported elsewhere (15). At 25°, the Kd of oxamate binding to LDH/NADH is 10.3 μM (see Materials and Methods), and its binding enthalpy has been reported to be 15.1 kcal/mol (binding sites) favoring the ternary complex (14). Hence, the sudden increase in temperature, Ti → Tf, will drive the reaction from the ternary complex toward the binary complex plus oxamate, from right to left in Eq. 1.
Fig. 3 shows three representative traces of NADH fluorescence at two different concentrations and different final temperatures. At a given concentration and final temperature, each trace shows a sharp decrease in NADH fluorescence within ∼20 ns, close to the instrument time resolution. Much, or all, of this unresolved signal is due to a general temperature quench of the NADH fluorescence, although some could be a result of atomic displacement of the NADH nicotinamide group within the nanosecond timescale; this unresolved signal is not analyzed further. After this, on the microsecond timescale, fluorescence changes are observed corresponding to environmental changes experienced by the NADH nicotinamide headgroup as the enzyme/cofactor-ligand system approaches the equilibrium established by the new temperature. Slow, millisecond time range fluorescence signal is observed arising from diffusive cooling within the excitation volume and is not relevant in determining the time evolution of the system. The microsecond fluorescence changes typically could be fit with a function containing a minimum of three exponential terms. The fastest rate with very small amplitude was observed in the absence of oxamate, whereas the two slower rates were observed only in the presence of oxamate. In the following analysis, we ignore the fastest rate, most or all of which appears to correspond to the trace reaction of NADH release from LDH/NADH (see Deng et al. (15)), and concentrate on the oxamate-dependent processes.
FIGURE 3.

Time course of fluorescence emission at 450 nm (excitation 360 nm) of LDH/NADH·oxamate solutions after laser T-jump, at (A) Tfinal = 30°C; concentrations LDH 80 μN, NADH 80 μM, and oxamate 1300 μM. (B) Tfinal = 20°C; concentrations LDH 80 μN, NADH 80 μM, oxamate 1300 μM, and (C) Tfinal = 20°C; concentrations LDH 30 μN, NADH 30 μM, and oxamate 30 μM. Measurements were made in 100 mM sodium phosphate buffer, pH 7.2. Fluorescence signal is normalized, with fluorescence before T-jump set to 1. Each trace is the result of averaging 1500–3000 T-jumps. The traces show the presence of two exponential relaxation times, one on the 10–100 μs and the other on the 200–1000 μs (shown in thick trace) timescales. A third smaller amplitude relaxation time is also needed to fit the data, but this is neglected in our analysis since it appears in the absence of oxamate (see Results).
The oxamate-dependent rates, as well as their corresponding amplitudes, showed a distinctive temperature dependence and also a distinctive dependence on free reactant concentration ([LDH/NADH]free + [oxamate]free). At low concentrations of free reactants (trace C in Fig. 3), the slow signal (indicated by thickened line) has the highest amplitude: both rate and amplitude of the slow signal show a positive correlation with temperature. With increasing concentrations of free reactants (traces B and A in Fig. 3), the amplitude of the slow signal decreases; the amplitude of the fast signal increases until it dominates the fluorescence response. The fast signal shows a negative rate correlation with temperature and a positive amplitude correlation with temperature. The rate dependence on temperature was plotted for each concentration; the values at Tf = 20°C, 25°C, 30°C, and 35°C were determined either directly from the data if Tf of a given measurement happened to be one of the desired temperatures, or by fitting the data with exponential curves and taking the rate from the value of the fit line at the given temperature. In some cases, usually those with a small number of data points, straight lines between successive data points were used instead of exponential fits. The values of the rates thus determined were plotted against free reactant concentration for each final temperature. Fig. 4 shows the plot at Tf = 30°C.
FIGURE 4.

Dependence of the values of the rates of fluorescence response to T-jump on the concentration of [LDH/NADH]free + [oxamate]free at Tf = 30°C. Above 1600 μM, the amplitude of the slow rate becomes too low for reliable detection. Several traces are omitted in the region 300–600 μM because the rates are too close in value to be distinguished. Uncertainties are estimates from fitting of double exponentials to each trace between 5 μs and 3 ms. Fit lines shown are to the general-case equations, Eqs. 3–5, and the fit values are contained in Table 1.
The kinetic model of Eq. 1 predicts only single exponential kinetics and, hence, cannot account for the observed biexponential response. A minimal kinetic model requires at least two steps. We therefore modified our model of oxamate binding to include a unimolecular rearrangement step after the initial bimolecular binding of oxamate to the binary complex
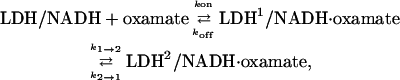 |
(2) |
where we suppose that the unimolecular step involves some sort of protein conformational change, the indices 1 and 2 indicate two different conformations of the protein. The equilibrium concentration of each species in this model will, upon perturbation (T-jump), relax to the new values at two exponential rates as observed in Fig. 3.
The exponential rates,  and
and  will, in the general case where neither step is significantly faster than the other, depend upon all four ki (16,17)
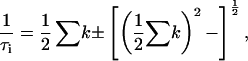 |
(3) |
where
 |
(4) |
 |
(5) |
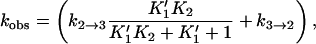
These equations were used to fit the rate versus concentration data, as shown in Fig. 4. This allows the determination, at each temperature, of all four rates simultaneously. The derived rates are given in Table 1 as kon, koff, k2→1 + k1→2, and k2→1/k1→2 as these are the grouping of parameters most sensitive to observed trends in the data. For example, kon is essentially the slope of the line that fits the fast observed relaxation times at high oxamate concentrations, and k1→2 + k2→1 is the asymptote for the observed slow relaxation time at high oxamate concentrations. The errors in the values have been estimated from the overall fits of the predicted rate constants to the observed data points. The most error-prone parameter is k2→1/k1→2. A previous T-jump study (11) is in agreement with that observed here, although the herein observed bimolecular step was merely inferred to exist in that study. Their observed unimolecular step is in reasonable agreement to ours with a value of the relaxation time corresponding to k2→1 + k1→2 of 3600 s−1 at 23°C.
TABLE 1.
Rate constants found for fits to the observed relaxation data using the kinetic scheme, Eq. 6; 
| Rate constant | 20°C | 25°C | 30°C | 35°C |
|---|---|---|---|---|
| kon (μM−1 s−1) | 37 (±2) | 26.5 (±2) | 21 (±2) | 20 (±1) |
| koff (s−1) | 2000 (±600) | 1700 (±600) | 1500 (±600) | 1000 (±300) |
| k2→1 + k1→2 (s−1) | 4000 (±400) | 5000 (±400) | 6500 (±500) | 6800 (±700) |
| k2→1/k1→2 (s−1) | 1 (±0.3) | 2 (±1) | 4 (±2) | 4 (±2) |
| k3→2 (s−1) | 200 (± 80) | n/a | n/a | n/a |
| α·k2→3+k3→2 (s−1) | 420 (±150) | 430 (± 150) | 460 (± 150) | 500 (± 150) |
| α | 0.5 (±0.4) | 0.3 (±.3) | 0.2 (±0.16) | 0.2 (±0.18) |
 |
21 (±15) | n/a | n/a | n/a |
 |
6.7 | 10.3 | 14 | 21.5 |
Stopped-flow kinetics
A substantial body of work from the Holbrook lab suggests that the binding of pyruvate, or its analog compound oxamate, to LDH/NADH is completed on the millisecond timescale (7,11,12,18). To verify the existence of “slow step(s)”, labeled herein as step 3,
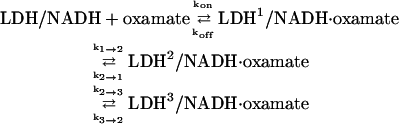 |
(6) |
and to further characterize it, we performed stopped-flow studies (the above is our final reaction scheme and supersedes the previous reaction schemes we had used). LDH preincubated with NADH was suddenly mixed (1 ms dead time) with varying concentrations of oxamate to yield a final concentration of LDH/NADH from 10–70 μN. The stopped-flow traces were adequately fit with single exponential functions. Fig. 5 A shows a typical time course of NADH emission after mixing, and Fig. 5 B shows the observed rates as a function of free LDH/NADH and oxamate concentrations in the final mixture. Comparison of buffer + LDH/NADH mixing versus oxamate + LDH/NADH mixing measurements showed that ∼90% of the emission from the NADH mixture is quenched within the ∼1 ms dead time of the stopped-flow instrument. Considering that NADH emission is strongly quenched when bound to LDH/oxamate, this implies that a “burst phase” occurs within the stopped-flow instrument's resolution; this is consistent with the experiments above carried out with faster resolution. Assuming that the earlier steps occur sufficiently fast that they can be considered to be at equilibrium during the slow step, the kinetic profile can be fit to
 |
(7) |
where  and
and 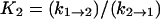 (17) to yield k2→3 and k3→2, with the rates of the previous steps determined by Eqs. 3–5. If the earlier steps cannot be considered to be at equilibrium, all three steps must be simultaneously fit. To check the validity of Eq. 7 under our conditions, a numerical solution to the rate equations (in which the observed rates are the roots of the polynomial solution of the secular determinant implied by a three-step reaction scheme) was constructed and used to fit the data. The deviation of the numerical solution for the stopped-flow rate from Eq. 7 (using the same values for the microscopic rate constants) varies with free reactant concentration and is <5% at free reactant concentrations above 50 μM, and <20% at the (zero concentration) intercept; this is within the margin of error of the data. Equation 7 was therefore used to fit the stopped-flow data. The numerical solutions for the first two rates (the bimolecular step and step 1→2 in the kinetic scheme) are indistinguishable from the rates given by Eqs. 3–5 over the range of free reactants used. These results are in general agreement with previous stopped-flow studies. A LDH/NADH pyruvate binding study carried out at cryogenic conditions in mixed DMSO/water solvent, to slow the reactions to within range of stopped-flow equipment, found two unimolecular rearrangements corresponding to ∼3000 s−1 and 200 s−1, respectively, when extrapolated to room temperature (12). Semiquantitatively, these rates are comparable to k2→1 + k1→2 and k3→2 + k2→3, respectively, observed herein (Table 1).
FIGURE 5.

(A) Time course of fluorescence emission at 450 nm (excitation 360 nm) in stopped-flow measurement upon mixing of 100 μL LDH/NADH 140 μN with 100 μL oxamate at 180 μM, at 20°C. Signal is averaged over 18 “shots”. Fit line is single exponential with kobserved = 560 s−1. (B) Rate of observed single exponential signal versus free reactant concentration at 20°C. Fit line is based on Eq. 7 with k2→3 = 440 s−1, k3→2 = 200 s−1, and Table 1 for the other microscopic rate constants. All measurements were made in 100 mM sodium phosphate buffer, pH 7.0.
Signal amplitudes
The signal amplitudes corresponding to the observed rates were also measured. At equilibrium, the concentration of each species in the reaction scheme is determined by the ratios of the rates. Equilibrium fluorescence measurements (Fig. 2) give values for the relative fluorescent yields, ɛ, of free NADH, the binary complex, and the ternary complex. With reference to our model for oxamate binding, Eq. 6, the value of ɛternary is a weighted average of the three distinct ternary species. If we consider concentration ranges where each step of the reaction scheme may be considered to be uncoupled from the others, the concentrations of each species in Eq. 6 at each stage of the evolution to the new equilibrium may be determined and used to calculate the relative fluorescence yields of each conformation (normalized to the fluorescent yield of free NADH). For example, whereas the first step in Eq. 6 is approaching an initial equilibrium (but before the final two steps come to equilibrium), the observed (nonnormalized) amplitude of the exponential rate associated with that step will be
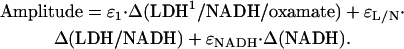 |
(8) |
The best fits of the calculated amplitudes to the observed amplitudes, given the rates detailed above, yield ɛNADH = 1, 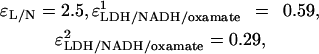 and
and 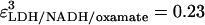 at 30°C.
Thermodynamics
From Table 1, the binding constant of oxamate with LDH/NADH derived from the microscopic rate constants is 21 (±15) μM at 20°C, compared to that determined from the static studies (Materials and Methods) of 6.7 μM. These values agree within the errors of our rate constants. It is likely that the kinetic model (Eq. 6) is sufficient to describe the binding process, although there may be steps faster than our resolution or steps where there is little change in our structural probe, the emission of NADH. If there is a missing step(s), it is unimolecular in its nature since the data clearly show the bimolecular event.
Fig. 6 shows the temperature dependence of the two observed rates at high oxamate concentrations. Under these circumstances, the two observed rates are basically decoupled with the faster rate proportional to kon (roughly kon([oxamate]free+[LDH/NADH]free)+koff), whereas the slower rate corresponds to k2→1 + k1→2 (see Eqs. 3–5; Fersht (16)). The temperature dependence of k2→1 + k1→2 shows normal Arrhennius behavior. As these are rates, we employ transition state theory as presented by Eyring (19) to derive thermodynamic parameters, i.e., k is proportional to T·exp−ΔG. Fits to log rate/T, i.e., (k1→2 + k2→1)/T versus 1/T, yield an activation enthalpy, for the second step, of 1.8 kcal/mol. According to Table 1, most of this temperature dependence arises from k2→1. The plot of log(k2→3 + k3→2) versus 1/T was linear, with an activation enthalpy of 1.9 ± 0.4 kcal/mol. The temperature dependence of kon exhibits, conversely, an “anomalous” negative temperature dependence. Plots of log kon/T versus 1/T not only show a positive slope but also show clear curvature with a minimum near 37°C; hence, the activation enthalpy of kon is negative and strongly temperature dependent, requiring introduction of a heat capacity term,  (cf. 16,20). Fits to a Gibbs free energy function that include this specific heat term, with the thermodynamic constants being defined relative to a conveniently chosen reference temperature (T0 = 20°C), yield
 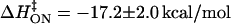 at 20°C, with
  A similar fit to koff could not be justified due to the uncertainty in the values and temperature dependence for koff in Table 1. Assuming a linear fit for log koff/T versus 1/T yields
  .
.
FIGURE 6.

Dependence of relaxation rates on final temperature of reaction mixture after T-jump for traces at concentration [LDH/NADH]free = 80 μM, [oxamate]free = 750 μM. Two rates are observed in the T-jump studies under this condition; the faster one is proportional to kon whereas the slower rate is k2→1 + k1→2 (see text). Curve fitting lines are used solely for interpolation of rates at specific temperatures.
The equilibrium enthalpy for oxamate binding to LDH/NADH favors the bound state by 15 kcal/mol at 25°C (14). Our data (Table 1) yield an equilibrium binding enthalpy for the first step (fit to 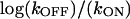 versus 1/T) of ΔH1 = +0.7 ± 3 kcal/mol (favoring the binary complex), and an equilibrium binding enthalpy (fit to
 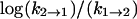 versus 1/T) of ΔH2 = −17 ± 4 kcal/mol (favoring LDH2/NADH/oxamate) for the second step in our model.
DISCUSSION
The resolution of our instrumentation, ∼20 ns, is sufficient to detect the very earliest steps of oxamate binding to LDH/NADH at physiological temperatures. The results are well explained by a kinetic model that has binding taking place via a sequence of steps: the formation of an encounter complex in a bimolecular step followed by two unimolecular transformations. All steps are well described by single exponential kinetics. We observed no evidence of distributed kinetics. The minimal kinetic scheme for the binding of oxamate to LDH/NADH at 20°C (Table 1) consistent with our observations is
 |
(9) |
The overall binding of oxamate is accompanied by a substantial (temperature dependent) loss of enthalpy; at 20°C, the ternary LDH/NADH·oxamate structure is favored over LDH/NADH + oxamate by ΔH = −15 kcal/mol (of binding sites) as shown in static measurements (14). However, the ternary complex involves three species in dynamic equilibrium. As shown in Results, most of the binding enthalpy comes about in the LDH1/NADH·oxamate to LDH2/NADH·oxamate transformation. This is consistent with the formation of the strong hydrogen bond between the C=O group of oxamate and His195, which we suggest below occurs during this step; spectroscopic measurements show this hydrogen bond is worth from −14 to −17 kcal/mol interaction energy (4).
The activation enthalpies of the last two steps are modest, ∼1.9 kcal/mol each (not shown). This is in contrast to recent results (21) on triosephosphate isomerase where the final step in binding of their respective ligands is structurally similar, being assigned to loop closure in LDH (see below) and also in triosephosphate isomerase, is characterized by an activation enthalpy on the order of 14 kcal/mol. Hence, our results suggest that the last two steps of the LDH pathway mostly involve a substantial change in entropy between the ground state and transition states since the activation ΔG‡ values of these steps must be ∼14–16 kcal/mol (calculated from reaction rate concepts using a Boltzmann distribution that describes the thermal population of states, a preexponential factor of 6·1012 s−1, and the observed rates).
A most notable result is the activation enthalpy associated with the rate of formation of the encounter complex, kon. The specific heat found between the transition state and the ground state in the LDH/NADH·oxamate to LDH1/NADH·oxamate step, 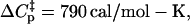 is very large. Such large heat capacity values are observed in the unfolding of proteins, and the observed heat capacity is generally ascribed to the expose of hydrophobic residues to water (see, e.g., Makhatadze and Privalov (22)). Using a rough average value of ΔCp of unfolding of ∼14 cal/K per mol of residue (23), it would be predicted that ∼56 residues melt at the transition state in forming the encounter complex, some 15% of the entire protein. Given that the active site of LDH is fairly buried inside the protein, it may not be unreasonable to suppose that a substantial amount of the protein does unfold for the substrate to reach the binding pocket. The binding pocket of LDH is, in fact, quite hydrophobic. An examination of the character of the residues within 10 Å of oxamate in the ternary structure shows 33 residues, of which 24 are hydrophobic in character.
In addition to this mechanism, heat capacity may also be ascribed to changes in the hydrogen bonding and solvent interactions of water molecules: using 50 J K−1 mol−1 as the heat capacity of the hydrogen bond network of water, we conclude that the heat capacity change upon ligand binding due solely to displacement of water molecules has a maximum value of 12 cal/mol-deg per water molecule displaced (24). Given that the active site of LDH is fairly buried and that the cavity to the surface and active site itself contains structured and partially structured water molecules so that there is likely a substantial rearrangement of water molecules when oxamate binds, this mechanism may also be responsible for a portion of the observed  although given the total heat capacity that must be accounted for it seems unlikely that it could be solely responsible for the observed effect.
We are able to make some tentative structural assignments of the observed kinetic species. We conclude that the relative conformation of substrate and cofactor in the binding site of the enzyme within what we call the encounter complex, LDH1/NADH·oxamate, are similar to their final conformation. It seems likely to us that the formation of this complex is preceded by the formation of looser ternary structures, perhaps a distribution of structures that are not observed in this study. There are several reasons for this conjecture. The value of kon = 37 μM−1s−1 is substantially smaller than that expected by simple diffusional encounter (e.g., Gabdoulline and Wade (25)). Another is that the emission of NADH in this complex is quite quenched, resembling the value of NADH in LDH3/NADH·oxamate rather than that of LDH/NADH. The observed “encounter” complex fluorescent yield is 76% quenched (Results) relative to the binary complex, LDH/NADH. The total quenching of cofactor fluorescence by substrate is 90%, so most of the NADH fluorescence quench occurs in this first step in our reaction scheme. From the point of view of the nicotinamide headgroup, therefore, there appears to be relatively little change in its environment after the formation of the encounter complex. We suspect that a salt bridge between the negatively charged carboxyl group of the inhibitor and Arg171 is formed in the first observable ternary complex (Fig. 1), although we have no direct evidence of it. The reason is that this electrostatic interaction is strong and long range, and is likely a driving force for bringing substrate to the active site binding pocket. The formation of a similar salt bridge formation is conjectured in the encounter complex of triosephosphate isomerase and its ligand (21). This conjecture can be tested directly by isotope edited transient IR studies of the antisymetric mode of the –COO− moiety, which are in progress; the frequency of this mode is modulated by the formation of the Arg171 salt bridge formation (26) and so can be used as its structural marker.
There is evidence that the catalytically key hydrogen bonding interactions of His195 and Arg109 (and loop closure) are established in the LDH1/NADH·oxamate to LDH2/NADH·oxamate and LDH2/NADH·oxamate to LDH3/NADH·oxamate transformations, respectively (Fig. 1). The most direct evidence for these assignments come from isotope-edited transient IR studies of the oxamate's C=O stretch band. The hydrogen bond formed with His195 downshifts the stretch frequency of the C=O by 25 cm−1, and that formed by Arg109 by an additional 10 cm−1, in studies of bound pyruvate (4); similar shifts are observed when oxamate binds to LDH/NADH (unpublished observations). Our kinetic studies show that there is a substantial shift that accompanies the LDH1/NADH·oxamate to LDH2/NADH·oxamate transition and a more modest one coincidental with LDH2/NADH·oxamate to LDH3/NADH·oxamate (27). In addition, Holbrook and co-workers have shown that the final step in the binding of substrate or substrate mimic likely involves loop closure (7). This structural assignment comes from kinetic studies of a modified LDH protein, whereby the loop motion was specifically monitored by incorporating a single fluorescent reporter Trp residue into the loop tip at position 106 (18,28). We have shown previously that the loop opening step requires a mobile substrate ligand, suggesting that concerted motion of the ligand and parts of the loop occur simultaneously (26).
CONCLUSION
The dynamics of forming the Michaelis complex in LDH is, then, quite intricate. Several steps are observed at different timescales, in which the various key components of the catalytically competent architecture are brought together, apparently as separate events. Substantial transient melting of the protein is indicated as a requirement to get the substrate to the active site, and the nature of activating the various steps in the binding process seems to be largely entropic. We note that our results indicate that substrate is bound in the loop closed conformation during the entire time that it takes for the hydride chemistry to occur, similar to that found for triosephosphate isomerase (21). This would be in contrast to the possible situation where the loop opens and closes many times during the catalytic cycle. On the other hand, it is possible that there are local motions at the active site which bring the complex in and out of catalytic competence; for example, the LDH1/NADH·oxamate to LDH2/NADH·oxamate transformation seems to occur on a timescale a bit faster than is believed to occur for the chemical step in catalysis. Finally, we note that the Kd calculated for the formation of the “encounter complex”, LDH1/NADH·oxamate, is very close to that of the overall Kd of binding. The on-enzyme Kd values, as defined by the ratio of the microscopic rate constants for a given step, are close to 1. We suspect that this may be a design feature required of efficient enzymic catalysis and may show up as a general result. It has been shown that efficient catalysis, for enzymes like LDH whose off-enzyme substrates are at equilibrium within their physiological environments, requires that the on-enzyme Kd values of catalytically productive Michaelis complexes be close to one (29,30).
Acknowledgments
This work was supported by the Institute of General Medicine of the National Institutes of Health, program project grant No. 5P01GM068036; and Institute of Biomedical Imaging and Bioengineering, EB01958.
References
- 1.Burgner, J. W., and W. J. Ray. 1984. On the origin of lactate dehydrogenase induced rate effect. Biochemistry. 23:3636–3648. [DOI] [PubMed] [Google Scholar]
- 2.Holbrook, J. J., A. Liljas, S. J. Steindel, and M. G. Rossmann. 1975. Lactate dehydrogenase. In The Enzymes. P. D. Boyer, editor. 3rd ed. Academic Press, New York. 191–293.
- 3.Griffith, J. P., and M. G. Rossmann. 1987. M4 Lactate Dehydrogenase Ternary Complex with NAD and Oxamate. Brookhaven Data Bank 1LDM.
- 4.Deng, H., J. Zheng, A. Clarke, J. J. Holbrook, R. Callender, and J. W. Burgner. 1994. Source of catalysis in the lactate dehydrogenase system: ground state interactions in the enzyme·substrate complex. Biochemistry. 33:2297–2305. [DOI] [PubMed] [Google Scholar]
- 5.Burgner, J. W., and W. J. Ray. 1984. Acceleration of the NAD-cyanide adduct reaction by lactate dehydrogenase: the equilibrium binding effect as a measure of the activation of bound NAD. Biochemistry. 23:3620–3626. [DOI] [PubMed] [Google Scholar]
- 6.Chen, Y.-Q., J. van Beek, H. Deng, J. Burgner, and R. Callender. 2002. Vibrational structure of NAD(P) cofactors bound to several NAD(P)-linked enzymes: an investigation of ground state activation. J. Phys. Chem. 106:10733–10740. [Google Scholar]
- 7.Dunn, C. R., H. M. Wilks, D. J. Halsall, T. Atkinson, A. R. Clarke, H. Muirhead, and J. J. Holbrook. 1991. Design and synthesis of new enzymes based upon the lactate dehydrogenase framework. Phil. Trans Roy. Soc. (London) B. 332:177–185. [DOI] [PubMed] [Google Scholar]
- 8.Cantor, C. R., and P. R. Schimmel. 1980. Biophysical Chemistry. W. H. Freeman, San Francisco.
- 9.Callender, R., and R. B. Dyer. 2002. Probing protein dynamics using temperature jump relaxation spectroscopy. Curr. Opin. Struct. Biol. 12:628–633. [DOI] [PubMed] [Google Scholar]
- 10.Dyer, R. B., F. Gai, W. Woodruff, R. Gilmanshin, and R. H. Callender. 1998. Infrared studies of fast events in protein folding. Acc. Chem. Res. 31:709–716. [Google Scholar]
- 11.Parker, D. M., D. Jeckel, and J. J. Holbrook. 1982. Slow structural changes shown by the 3-nitrotyrosine-237 residue in pig heart[Try(3NO2)237] lactate dehydrogenase. Biochem. J. 201:465–471. [DOI] [PMC free article] [PubMed] [Google Scholar]
- 12.Clarke, A. R., A. D. B. Waldman, K. W. Hart, and J. J. Holbrook. 1985. The rates of defined changes in protein structure during the catalytic cycle of lactate dehydrogenase. Biochim. Biophys. Acta. S29:397–407. [DOI] [PubMed] [Google Scholar]
- 13.Burgner, J. W., and W. J. Ray. 1978. Mechanistic Study of the addution of pyruvate to NAD catalyzed by lactate dehydrogenase. Biochemistry. 17:1654–1661. [DOI] [PubMed] [Google Scholar]
- 14.Schmid, F., H.-J. Hinz, and R. Jaenicke. 1976. Thermodynamic study of binary and ternary complexes of pig heart lactate dehydrogenase. Biochemistry. 15:3052–3059. [DOI] [PubMed] [Google Scholar]
- 15.Deng, H., N. Zhadin, and R. Callender. 2001. The dynamics of protein ligand binding on multiple time scales: NADH binding to lactate dehydrogenase. Biochemistry. 40:3767–3773. [DOI] [PubMed] [Google Scholar]
- 16.Fersht, A. 1999. Structure and Mechanism in Protein Science: A Guide to Enzyme Catalysis and Protein Folding. Freeman and Co., New York.
- 17.Bernasconi, C. F. 1976. Relaxation Kinetics. Academic Press, New York.
- 18.Atkinson, T., D. Barstow, W. Chia, A. Clarke, K. Hart, A. Waldman, D. Wigley, H. Wilks, and J. J. Holbrook. 1987. Mapping motion in large proteins by single tryptophan probes inserted by site-directed mutagenesis: lactate dehydrogenase. Biochem. Soc. Trans. 15:991–993. [DOI] [PubMed] [Google Scholar]
- 19.Eyring, H. 1935. The activated complex and the absolute rate of chemical reactions. Chem. Rev. 17:65–77. [Google Scholar]
- 20.Oliverberg, M., Y.-J. Tan, and A. R. Fersht. 1995. Negative activation enthalpies in the kinetics of protein folding. Proc. Natl. Acad. Sci. USA. 92:8926–8929. [DOI] [PMC free article] [PubMed] [Google Scholar]
- 21.Desamero, R., S. Rozovsky, N. Zhadin, A. McDermott, and R. Callender. 2003. Active site loop motion in triosephosphate isormerase: T-jump relaxation spectroscopy of thermal activation. Biochemistry. 42:2941–2951. [DOI] [PubMed] [Google Scholar]
- 22.Makhatadze, G. I., and P. L. Privalov. 1990. Heat capacity of proteins. I. Partial molar heat capacity of individual amino acid residues in aqueous solution: hydration effect. J. Mol. Biol. 213:375–384. [DOI] [PubMed] [Google Scholar]
- 23.Myers, J. K., C. N. Pace, and J. M. Scholtz. 1995. Denaturant m values and heat capacity changes: relation to changes in accessible surface area of protein folding. Protein Sci. 4:2138–2148. [DOI] [PMC free article] [PubMed] [Google Scholar]
- 24.Cooper, A. 2005. Heat capacity effects in protein folding and ligand binding: a re-evaluation of the role of water in biomolecular thermodynamics. Biophys. Chem. 115:89–97. [DOI] [PubMed] [Google Scholar]
- 25.Gabdoulline, R. R., and R. C. Wade. 1997. Simulation of the diffusional association of barnase with barstar. Biophys. J. 72:1917–1929. [DOI] [PMC free article] [PubMed] [Google Scholar]
- 26.Gulotta, M., H. Deng, H. Deng, R. B. Dyer, and R. H. Callender. 2002. Towards an understanding of the role of dynamics on enzymatic catalysis in lactate dehydrogenase. Biochemistry. 41:3353–3363. [DOI] [PubMed] [Google Scholar]
- 27.McClendon, S., D. Vu, R. Callender, and R. B. Dyer. 2005. Structural transformations in the dynamics of Michaelis complex formation in lactate dehydrogenase. Biophys. J. 89:L7–L9. [DOI] [PMC free article] [PubMed] [Google Scholar]
- 28.Waldman, A. D., K. W. Hart, A. R. Clarke, D. B. Wigley, D. A. Barstow, T. Atkinson, W. N. Chia, and J. J. Holbrook. 1988. The use of a genetically engineered tryptophan to identify the movement of a domain of B. stearothermophilus lactate dehydrogenase with the process which limits the steady-state turnover of the enzyme. Biochem. Biophys. Res. Comm. 150:752–759. [DOI] [PubMed] [Google Scholar]
- 29.Brubaum, J. J., R. T. Raines, W. J. Albery, and J. R. Knowles. 1989. Evolutionary optimization of the catalytic effectiveness of an enzyme. Biochemistry. 28:9293–9305. [DOI] [PubMed] [Google Scholar]
- 30.Burbaum, J. J., and J. R. Knowles. 1989. Internal thermodynamics of enzymes determined by equilibrium quench: values of Kint for enolase and creatine kinase. Biochemistry. 28:9306–9317. [DOI] [PubMed] [Google Scholar]