

Abstract
The complex formed by U1A RBD1 and the U1 snRNA stem/loop II is noted for its high affinity and exquisite specificity. Here, that complex is investigated by 5 ns molecular dynamics simulations and analyzed by reorientational eigenmode dynamics to determine the dynamic properties of the RNA:protein interface that could contribute to the binding mechanism. The analysis shows that there is extensive correlation between motions of the RNA and protein, involving 7 of the 10 RNA loop nucleotides, the protein β-sheet surface, two of its loops, and its C-terminal tripeptide sequence. Order parameters of these regions of the complex are uniformly high, indicating restricted motion. However, several regions of both RNA and protein retain local flexibility, notably three nucleotides of the RNA loop and one loop of RBD1 that does not contact RNA. The highly correlated motions involving both molecules reflect the intricate network of interactions that characterize this complex and could account in part for the thermodynamic coupling observed for complex formation.
INTRODUCTION
The RNA-binding domains (RBD) are a common eukaryotic RNA-binding motif that recognize their RNA targets based on both sequence and structure and display considerable variability in their binding affinities (1,2). The most well-characterized RBD is the N-terminal domain (RBD1) of the human U1A protein. Along with an ∼12 amino acid C-terminal extension (totaling the N-terminal 101 residues), this domain is sufficient for high affinity binding to stem/loop II (SL2) of the U1 small nuclear RNA (3,4). Structures of RBD1 and the RBD1:SL2 complex are known (5–7). The RNA-binding site of RBD1 consists of its four-stranded antiparallel β-sheet surface, loop 1 (connecting β1 and αA), loop 3 (connecting β2 and β3), and the linker following β4 (T89D90S91; Fig. 1 a).
FIGURE 1.
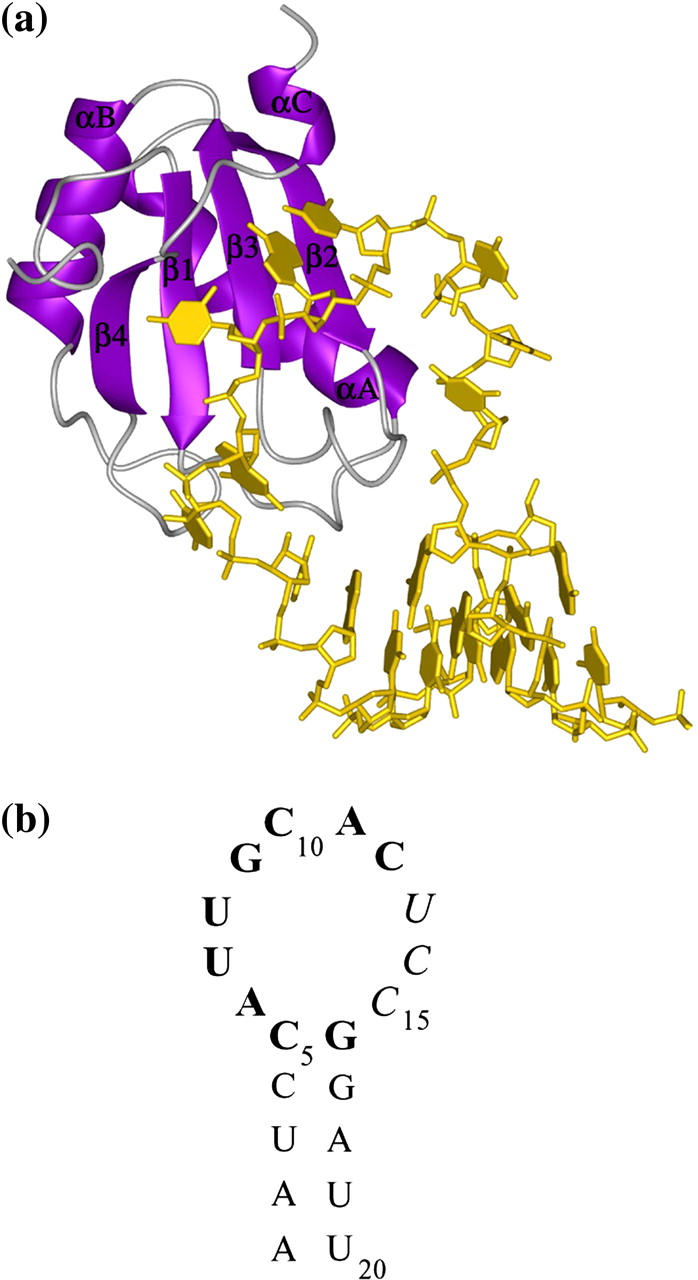
(a) Ribbon diagram of RBD1:SL2 complex drawn from the crystal structure (Protein Data Bank access code 1URN) showing positions and names of the canonical secondary structure elements of RBD1. (b) Sequence and secondary structure of the SL2 RNA. Bases that contribute to sequence specificity are shown in bold; the UCC sequence, which does not interact with RBD1, is shown in italic.
Structural and NMR dynamics studies performed on several RNA-binding proteins have led to the hypothesis that induced fit or cofolding may be a required part of the molecular mechanism of RNA binding by protein domains (8). For the RBD1:SL2 interaction to occur, loop 1 and loop 3 must undergo a structural rearrangement; the linker extending from the C-terminus of the domain also changes conformation as it makes sequence-specific contacts with the RNA. Likewise, the SL2 loop sequence, which is predicted to be disordered in solution (9), becomes trapped in a comparatively small number of allowed conformations upon complex formation. Although conformational changes in loops and linkers that display fast (ps-ns) dynamics characterize the RBD1:SL2 interaction, it is not readily apparent whether the fast motions are functionally valuable or simply a neutral feature of their structure.
The RNA-binding surface of RBD1 has been studied extensively by site directed mutagenesis (10–14), as has the RNA loop (9,15). In vitro RNA-binding experiments have revealed that most of the RNA-binding surface of the domain is thermodynamically coupled (13,14); i.e., residues on the protein's binding surface do not function independently of each other. In a striking example of communication across the β-sheet, mutants with disrupted thermodynamic coupling were shown to have significantly altered loop 3 flexibility, even if the site of mutation was not proximal to the loop (14). The RNA is part of the network of thermodynamically coupled sites that determine and maintain the protein/RNA complex (13,14).
Most RBDs contain a glycine at the junction of β3 and loop 3, suggesting that it has a special function in these proteins. This glycine (G53) was replaced in U1A RBD1, and indeed mutants had a weaker affinity for SL2; specificity of RNA recognition was also changed (16). Molecular dynamics trajectories calculated for the wild-type and G53 variant domains (17) were analyzed using the reorientational eigenmode dynamics (RED) formalism (18). This analysis showed that there are correlated motions spanning unbound RBD1-WT involving loop 1, loop 3, and the C-terminal tail; these correlation networks are disrupted by mutation of the conserved glycine (17). It appears that correlated intramolecular motions of the protein are required for the conformational changes that must occur upon RNA binding. We propose that rapid correlated motions are the physical manifestation of the thermodynamic coupling across the RNA-binding surface of RBD1.
The structure and dynamics of the complex (19–23) and also the free RNA (21,22) have been studied through molecular dynamics simulations. Simulations of free SL2 predict a highly flexible (disordered) loop with the bases turned inward and shielded from solvent, consistent with the observations of Hall (9). Simulations of the RBD1:SL2 complex confirm the prediction that the RNA becomes locked into a well-ordered conformation and that the rigidity of the buried interface is similar to that expected for residues buried in the core of a protein (20). In each simulation of the RBD1:SL2 complex, the well-conserved GCAC sequence (Fig. 1 b) shows minimal conformational fluctuations and participates in several high occupancy hydrogen bonding interactions with the protein. Unlike the bases that are recognized specifically, the solvent exposed UCC sequence 3′ to the conserved GCAC is highly flexible in all simulations of the complex. In most simulations (20,22), the base of U8 (numbering relative to Fig. 1 b), which makes only van der Waals contacts with RBD1, is no more flexible than the GCAC sequence after it; but in one case it displays high flexibility, much like the mobile UCC sequence (21). MM/PBSA analysis of simulations calculated for the free protein, free RNA, and the complex support the hypothesis that a free energy penalty must be paid upon binding in return for the extensive ordering of both the protein and the RNA relative to their free forms (22).
Although these simulations do present an intriguing picture of the RBD1:SL2 complex, consistent with binding thermodynamics, they were not analyzed with a method (such as RED; (18)) designed to investigate the network of correlated motions in the complex. Extensive correlations between distal sites on the RNA-binding surface of unbound RBD1 have been predicted from RED analysis of MD trajectories (17); similar analysis of an RBD1:SL2 trajectory would reveal whether these correlations are retained in the complex and, more interestingly, if they are expanded to include the RNA. Here we present the analysis of an MD trajectory of the RBD1:SL2 complex using the RED formalism to characterize the amplitude and timescale of motion sampled by RBD1 and SL2 and the extent of dynamic correlation in the motions sampled. Through comparison of the calculated order parameters with previously published experimental and computational results for the unbound state, this analysis confirms that much of RBD1 and the RNA loop are stiffened by complex formation. Most importantly, the analysis also shows dramatic changes in correlated motion throughout RBD1 and reveals correlations spanning the protein/RNA interface.
MATERIALS AND METHODS
Molecular dynamics simulations
Molecular dynamics trajectories were run on eight processors using a parallel implementation of the AMBER 6.0 software package (24) with the AMBER94 force field (25). The starting structure for the MD simulations was the x-ray crystal structure of RBD1 bound to SL2 (Protein Data Bank access code 1urn; (7)); the structure consisted of RBD1 residues 2–97 and SL2 nucleotides 1–20 (the unpaired U21 was removed) from the synthetic RNA used for crystallization. The complex was embedded in a box of 9951 TIP3P waters (26) with neutralizing counterions. Dynamics were run under NPT conditions, with a timestep of 2 fs, SHAKE (27) was applied to all bonds involving hydrogen atoms, and particle mesh Ewald electrostatics (28) with a 10 Å direct space cutoff. The initial temperature of the system was ramped to 300 K using the protocol of Reyes and Kollman (20). Coordinates of the protein and RNA atoms were saved every 0.5 ps for later analysis. Two independent 5.0 ns trajectories were run starting from the same coordinates, but with different initial velocity distributions.
RED analysis
The RED formalism has been described in detail elsewhere (18). All calculations were performed using in-house programs written in either Perl or C. The implementation of RED was consistent with our previous work (17), except that matrix diagonalization was performed using a new in-house C program. After superposition to remove translational and rotational diffusion, the polar angles representing the orientation of a unit vector colinear with the amide bond of each of the 91 nonproline, non-N-terminal protein residues was calculated every 0.5 ps along the final 4 ns of the 5 ns trajectory. Likewise, the polar angles representing the unit vector colinear with each backbone C1′-H1′ bond, the purine C8–H8 bonds, adenine C2–H2 bonds, and the pyrimidine C5–H5 bonds of the RNA were computed. The saved coordinates were used to generate the 136 × 136 reorientational covariance matrix M, which has elements (18)
 |
(1) |
where ΔY2M = Y2M(Ω) −  Y2M are the normalized spherical harmonics of rank 2, and the bar indicates ensemble averaging over the coordinates from the simulation. One important property of the matrix M in this representation is that its diagonal elements are proportional to the generalized order parameter S2 of Lipari and Szabo (18,29):
 |
(2) |
where σ2 is the variance of spherical harmonic Y2M. The covariance matrix can be diagonalized by solving the eigenvalue problem M|k > = λk|k> (k = 1, …, n; n = 136). The resulting normalized reorientational eigenvectors |k> contain information about which spin interactions reorient in concert under the influence of each motional mode, and the eigenvalues λk represent the amplitude of the observed motion.
Although the eigenvectors of M contain detailed information about the dynamic correlations between sites, they contain no information about the timescale on which the observed motion occurs. The characteristic timescale of motion for each eigenvector was determined by constructing the correlation function (18)
 |
(3) |
where averaging is done over the snapshots of the simulation and the ak(t) are constructed from the instantaneous projection of the eigenvectors onto the simulation trajectory (18). Assuming that these correlation functions decay monoexponentially, a lifetime τm associated each motional mode can be established (30,31).
Eigenvector collectivity
The collectivity of an eigenvector is defined by the parameter κ, which is roughly proportional to the percentage of sites significantly reoriented by the motion represented by that vector (32):
 |
(4) |
where |k>n is the nth component of eigenvector |k> and N is the number of spin interactions. κ ranges from 1/N to 1.
RESULTS
Molecular dynamics simulations
Two independent 5.0 ns molecular dynamics trajectories of the RBD1:SL2 complex were calculated, and the results were compared with previously reported simulations (19–22). The two trajectories were both initiated from the same structure chosen from the deposited crystal coordinates (7) but with different initial velocity distributions. Both produced nearly identical results; results are only presented for one trajectory. By 500 ps the root mean-square deviation of the trajectory had stabilized and remained nearly constant for the duration of the production run. Table 1 summarizes the all atom RMSD as well as that of several atom subsets. The majority of the deviations from the mean RMSD after equilibration were caused by excursions of the UCC sequence at the 3′ end of the RNA loop. The mean RMSD values reported in Table 1 are consistent with previous simulations of the RBD1:SL2 complex (20,21).
TABLE 1.
RMSD values relative to the starting structure for the final 4.0 ns of the 5.0 ns molecular dynamics trajectory
| RMSD (Å) | AVE | MIN | MAX |
|---|---|---|---|
| All atom | 1.92 | 1.51 | 3.32 |
| RBD1 | 1.54 | 1.37 | 1.85 |
| RBD1, backbone | 1.02 | 0.71 | 1.36 |
| SL2 | 2.18 | 1.40 | 3.82 |
| SL2, no UCC | 1.22 | 0.81 | 2.62 |
Average (AVE), minimum (MIN), and maximum (MAX) values are reported for all atoms, all protein atoms, the protein backbone, all RNA atoms, and all RNA atoms excluding the bases of U14–C16.
Two sites in the RNA are of special interest for comparison with the previously published trajectories. The base of Uridine 8 makes exclusively nonpolar contacts with other solute atoms and is relatively solvent exposed compared to its neighboring bases, which make stronger contacts with RBD1. Using the CHARMM22 force field, Tang and Nilsson (21) observe the base of U8 undergoing large conformational changes with amplitude similar to the solvent exposed UCC sequence at the 3′ end of the loop. Although the U8 base is more mobile than the majority of the loop bases in our trajectory, it retains its stacked conformation throughout the run and does not experience any large conformational changes (Fig. 2 a). In an independent simulation computed with the AMBER94 force field, U8 motion was restricted, and the base remained stacked (20). As shown in Fig. 2, its behavior in our simulations (also computed using AMBER94) is consistent with U8 stacking.
FIGURE 2.

All atom RMSD relative to the starting structure plotted every 0.5 ps over the trajectory for four mobile nucleotides. (a) U8 is more mobile than its neighbors but retains a single average conformation after initial equilibration. (b) U13, (c) C14, and (d) C15 display multiple exchanges between distinct conformations, although these large exchanges do not always occur simultaneously.
The UCC bases do not contact the protein, and their behavior varies with the simulation. In the Reyes and Kollman (20) trajectory, the UCC bases stack on one another, a geometry they retained throughout the simulation. In both the Tang and Nilsson (21) simulation and the simulations analyzed here, these bases do not stack stably on one another; in fact, they are the most highly mobile site in the complex. Each base experiences multiple large, but at least partially independent, conformational exchanges (Fig. 2). Although there is no clear correlation between the changes of conformation at each site as reported by RMSD, these three bases are often correlated in the eigenvectors of the RED matrix computed from the trajectory (vide infra).
Order parameter predictions from RED analysis
The RED formalism has been applied to the RBD1:SL2 trajectory to model the spin relaxation active dynamics. Snapshots collected every 0.5 ps over the final 4 ns of the trajectory were superposed and used to construct the RED covariance matrix (Materials and Methods, Eq. 1), for a total of 136 spin pairs: the 91 non-N-terminal, nonproline RBD1 backbone amides; the 20 backbone C1′-H1′, 8 purine C8-H8, 5 adenine C2-H2, and 12 pyrimidine C5-H5. Order parameters for each of these sites were computed using Eq. 2 (Materials and Methods). It was anticipated that the result would show a loss of RBD1 backbone flexibility due to the bound RNA, especially in loop 3 and the TDS linker, which contact the RNA. This was indeed observed in NMR relaxation experiments of a complex of RBD1 and an internal bulge RNA (33). Analogously, most sites in SL2 that contact RBD1 should be well ordered, yielding high order parameters.
RBD1 backbone dynamics
Computed RBD1 backbone amide order parameters are shown in Fig. 3 a and are uniformly high throughout most of the domain. The average order parameter of 0.85 ± 0.06 for all sites is consistent with most of the molecule having low conformational freedom in the complex. Table 2 contains average order parameter statistics for RBD1 broken down by position in the protein, as well as comparison with experimental NMR (16) and RED (17) results for the unbound domain. Previously published RED results for unbound RBD1 showed an average order parameter of 0.78 ± 0.17 (17). As previously noted, the simulations overestimate the mobility of loops on this timescale. Although the unbound average is similar (within error) to the bound average, the unbound values were considerably more variable, as demonstrated by the much larger standard deviation.
FIGURE 3.

Square of the generalized order parameter, S2, calculated from the RED covariance matrix (Materials and Methods, Eq. 2) for the (a) RBD1 backbone amides; (b) SL2 ribose C1′; and (c) SL2 purine C8, adenine C2, and pyrimidine C5 positions. Bars over a indicate the position of secondary structure elements; those over b and c indicate the stem nucleotides.
TABLE 2.
Average RBD1 and SL2 order parameters (S2) from model-free analysis of experimental relaxation data or RED analysis of simulation trajectories
| RBD1 | All | 2° | Loop 1 | Loop 3 | TDS |
|---|---|---|---|---|---|
| NMR, unbound* | 0.84 ± 0.13 | 0.88 ± 0.04 | 0.80 ± 0.08 | 0.87 ± 0.06 | 0.74 ± 0.07 |
| RED, unbound† | 0.78 ± 0.17 | 0.85 ± 0.04 | 0.63 ± 0.05 | 0.78 ± 0.06 | 0.64 ± 0.06 |
| RED, bound | 0.85 ± 0.06 | 0.86 ± 0.04 | 0.84 ± 0.03 | 0.89 ± 0.01 | 0.87 ± 0.02 |
| SL2 | Stem | No fray | Loop | Loop bound | UCC |
| RED, ribose | 0.82 ± 0.16 | 0.87 ± 0.07 | 0.79 ± 0.21 | 0.92 ± 0.01 | 0.49 ± 0.04 |
| RED, base | 0.80 ± 0.14 | 0.87 ± 0.04 | 0.76 ± 0.25 | 0.90 ± 0.04 | 0.36 ± 0.07 |
“All” refers to all nonproline, non-N-terminal backbone amides of RBD1.
“2°” are all RBD1 sites found in canonical secondary structures (Fig. 1 a). Leu17-Ile21 (loop 1) connects β1 and αA. Ser46-Arg52 (loop 3) connects β2 and β3.
“TDS” is T89, D90, and S91, found between β4 and αC.
“Stem” is the 10 nucleotides in the SL2 stem (Fig. 1 b).
“No fray” is nucleotides 2–5 and 16–19.
“Loop” refers to the 10 nucleotides of the loop (Fig. 1 b).
“Loop bound” is the 7 nucleotides starting from the 5′ end of the loop.
“UCC” is the trinucleotide sequence at the 3′ end of the loop.
Values are reported as mean ± SD.
(16) Loop 1 average S2 does not include Lys20. Loop 3 includes only Ser46, Ser48, and Met51. Only TD are included in the TDS average. The missing amides were not visible at pH 6.8.
(17)
The average order parameter in the secondary structure elements remains largely unchanged upon SL2 binding, but three elements on the RNA-binding surface display significantly different behavior in the complex. Whereas loop 1, loop 3, and the TDS sequence after β4 were mobile in unbound RBD1(17), their average order parameters are indistinguishable from those of secondary structure elements in the complex (Table 2). In contrast, loop 5, which is a flexible loop that does not contact SL2, shows no change in its average order parameters upon RNA binding (compare 0.79 ± 0.10 unbound to 0.78 ± 0.11 in the complex). Taken together, these results confirm a stiff binding interface that has lost a significant amount of conformational mobility compared to the unbound domain, consistent with the results of Reyes and Kollman (20).
SL2 ribose and base dynamics
The computed ribose C1′ order parameters are shown in Fig. 3 b. Much like the backbone of RBD1, the majority of the riboses are uniformly rigid in the complex, as evidenced by high order parameters, with the notable exception of the UCC sequence at the 3′ end of the loop. Also more mobile is the terminal basepair, which displays some fraying behavior, especially late in the simulation. From Table 2, it is clear that the seven loop nucleotides associated with RBD1 in the complex have ribose order parameters indistinguishable from those of the nonfraying positions in the stem. In contrast, the UCC sequence appears to be the most mobile site in the entire complex, consistent with its exposure to solvent and lack of contact with RBD1.
Fig. 3 c displays a trend for the base order parameters that is very consistent with that reported by the ribose sites for the backbone. Again, the UCC sequence displays extensive flexibility, whereas the rest of the loop bases are no more mobile than those in the stem. The one notable difference between the ribose and base order parameters is that the base of U8 appears to be more mobile than its neighbors (S2 = 0.81; compared to the average of 0.90 ± 0.04 for all loop bases that contact RBD1, Table 2). Clearly, even though U8 is somewhat mobile, it is much more restricted than the bases of the UCC sequence (average S2 = 0.36 ± 0.07), consistent with its retention of a single conformation during the trajectory (Fig. 2 a).
Eigenmodes of the RED covariance matrix
The information encoded in the RED covariance matrix is much richer than the order parameters, in that it also describes the correlations between the reorientations of each site (18). In the case of the RBD1:SL2 complex, this offers the potential to reveal networks of correlated motions that span the protein/RNA interface, in addition to enumerating motion localized to the protein or RNA alone. These correlations are most readily visualized through calculation of the reorientational eigenvectors (|k>) and associated eigenvalues (λk) of the covariance matrix by solving the eigenvalue problem M|k > = λk|k> (k = 1, …, n; n = 136 for the RBD1:SL2 complex).
Collectivity of the eigenmodes
The eigenvalue (λk) associated with each eigenvector |k> of the RED covariance matrix M represents the amplitude of motion along the reorientational mode (18). The collectivity (κ, Materials and Methods, Eq. 4) of a given eigenvector reflects the percentage of spin interactions significantly reorienting under the influence of the eigenmode (32), and so indicates the degree of correlation between all sites in the molecule imposed by the mode. A plot of κ versus λk (Fig. 4) calculated from the trajectory shows a distribution similar in shape to those previously reported for Ubiquitin (18) and unbound RBD1 (17) where a few modes have high amplitude (λk > 0.1), but are local motions (κ < 0.1), whereas the majority of modes are lower amplitude but more collective.
FIGURE 4.

Distribution of the collectivity parameter κ versus eigenvalue λk from RED analysis of the RBD1:SL2 complex. Contributing sites come from both the protein and the RNA, as described in the text. κ ranges from ∼0.01 to 1.00 (Materials and Methods, Eq. 4) and reflect the percentage of spin interactions contributing significantly to eigenvector |k>. The eigenvalue λk associated with each eigenvector is proportional to the amplitude of the motions |k> represents.
The amplitude and collectivity of motions experienced by the backbone amides contain information about the nature of the motions experienced by RBD1 in the complex, making it instructive to compare the results with those computed for unbound RBD1. Extraction of the 91 × 91 block of the RED covariance matrix corresponding to RBD1 and then repeating the diagonalization procedure produces the κ versus λk distribution displayed with black diamonds in Fig. 5. Compared with the distribution from RED analysis of unbound RBD1 (Fig. 5, red circles; (17)), it is clear that RBD1 loses a significant portion of its internal mobility upon RNA binding, based on the dramatic shift of the eigenvalue spectrum toward smaller values (lower amplitudes). Also, the maximum collectivity experienced by RBD1 in the complex (κmax = 0.45) is higher than the maximum in the absence of RNA (κmax = 0.37), indicating that at least some of the protein modes are more collective in the complex.
FIGURE 5.

Comparison of the distribution of the collectivity parameter κ versus eigenvalue λk from RED analysis of RBD1 in the RBD1:SL2 complex (black) and unbound RBD1 (red; (17)). Shifting of the bound peak to the left (low eigenvalue) indicates a loss of mobility by the backbone of RBD1 upon RNA binding.
Timescale of motion sampled by the eigenvectors
Although the eigenvectors of the RED covariance matrix provide information on the amplitude of motions experienced by each investigated site in the RBD1:SL2 complex, all time information is lost during the construction of the matrix, leaving the timescale of the motions sampled undetermined. Correlation functions were calculated by projecting out the contribution from the eigenvectors to each snapshot of the trajectory using Eq. 4 (Materials and Methods) to reconstruct the timescale information contained within the trajectory (18). Assuming that these correlation functions decay monoexponentially, correlation times corresponding to the characteristic lifetime of motion along the eigenvector can be extracted (30,31).
The distribution of calculated lifetimes (τk) ordered by decreasing eigenvalue of the corresponding eigenvector is shown in Fig. 6. Given that snapshots were saved every 0.5 ps for 4 ns, τk values ranging from ∼5 to 400 ps are expected to be meaningful. This range is comparable to the timescale of internal motions most reliably reported by model-free relaxation parameters, and many of the 20 eigenvectors with the largest associated eigenvalues have τk falling in this range. However, over the whole distribution, surprisingly few modes displayed lifetimes significantly above zero; none of the eigenvectors beyond the first 20 had associated correlation functions with initial values significantly above their plateau values, indicating that they decay very rapidly compared to the timescale of motion reliably reported (τk ≫ 0.5 ps). These trends are consistent with unbound RBD1, although the unbound molecule did display slightly longer τk, on average, for those modes with significantly nonzero lifetimes (17).
FIGURE 6.

Characteristic lifetime in picoseconds (τk) associated with each eigenvector |k> of the matrix M generated from RED analysis of the RBD1:SL2 simulation. τk is the lifetime associated with the reorientational mode represented by |k> and therefore is not a direct estimate of τe from Lipari-Szabo analysis, although sites reoriented by eigenvectors with large τk are predicted to display τe values of similar magnitude.
Correlated motion in the complex
The eigenvectors of the RED covariance matrix predict the pattern and extent of correlated motion in the complex (18). Many reorientational modes are expected to be intramolecular in nature (i.e., localized to either RBD1 or SL2), but diffuse modes spanning the binding interface are also expected for such a tightly associated complex. When plotting the reorientational eigenvectors of the RED matrix, it is convenient to display their coefficients as the principal order parameter components  for each spin pair. In this representation, the coefficient at site j is proportional to the eigenvector's contribution to the order parameter of site
  Fig. 7 contains representations of e1, e16, and e54 in this form.
FIGURE 7.

Reorientational eigenvectors from RED analysis of the RBD1:SL2 trajectory shown as the principal order parameter components  for each spin pair. e1 (top) is a purely RNA mode that displays motion of the highly mobile UCC sequence and the terminal basepair of the stem. e16 (middle) is the largest amplitude pure RBD1 mode and is dominated by motion of loop 5. e54 (bottom) is the eigenvector with the largest collectivity (κ) and is representative of the large number of modes that display correlations spanning the protein/RNA interface. Sites to the left of the dotted line belong to RBD1, whereas those to the right belong to SL2.
Fig. 7 a displays e1, the eigenvector with the largest eigenvalue and therefore the largest amplitude motion. Not surprisingly, given the order parameter calculations (Fig. 3), this mode is dominated by local reorientation of the UCC sequence at the 3′ end of the loop, with minor contributions from the fraying ends of the stem. This eigenvector only contains significant projections onto SL2 sites—a trend that is continued by e2 and e3 (not shown). Starting with e4, a series of eigenvectors that project amplitude onto both RBD1 and SL2 are observed, and it is not until e16 (Fig. 7 b) that an eigenvector with exclusively RBD1 character is observed. This vector is dominated by motion of loop 5, which, analogously to the largest amplitude pure SL2 mode, is one of the most mobile regions of the protein (compare with the order parameters in Fig. 3).
The eigenvector with the largest κ (Materials and Methods, Eq. 4) represents the most highly collective motion sampled by the trajectory. This eigenvector (e54, κ = 0.45) is displayed in Fig. 7 c and clearly contains correlations spanning the protein/RNA interface. Although each of the most mobile regions in RBD1 is reoriented by this mode, the UCC sequence in the SL2 loop is conspicuously absent. This pattern of correlations spanning the protein/RNA interface, but excluding the UCC sequence, is found in the majority of the high collectivity eigenvectors.
The 136 eigenvectors that describe the networks of correlated motions contain many examples of how these correlations are distributed in the complex. Some are restricted to the most mobile regions (UCC in the RNA loop, loop 5, or the N-terminal tail of RBD1) and so have high amplitude eigenvalues (λk) but low collectivity (κ), since they consist of contributions from only a few sites. Others contain contributions from virtually the entire complex, such as e54 with its high collectivity and low amplitude. A discussion of each eigenvector is not practical or informative, but a more detailed examination of several does illustrate some important features of the complex.
Four eigenvectors were selected for more discussion on the basis of their contributions from the RNA. The four are given in Fig. 8, where the predominant spin interactions are identified. The sites that contribute to each are mapped onto the structure of the cocrystal (7) to provide a different view of the patterns (Fig. 9). In those structures, only a backbone ribbon represents the protein backbone amides, whereas those nucleotides that contribute to the eigenmode are explicitly depicted.
FIGURE 8.

Selected eigenvectors from the complex. (a) e10; (b) e29; (c) e31; and (d) e40. The contribution of each site dS2 [ ] for each spin interaction is plotted. Spins 1–91 are protein amides from 1–96, excluding prolines. Spins 92–136 are in order of nucleotide C1′, base C8/C6 for purines/pyrimidines and C1′, C8, C2 for adenine.
FIGURE 9.

Spin sites contributing to e10 (A), e29 (B), e31 (C), and e40 (D) are mapped onto the cocrystal structure (7).
The example of e10 illustrates contributions from those parts of both molecules that are not directly in the interface. Here, the most significant contributions come from the C-terminal tail (Ile93 and Ala95) and the 3′ nucleotides of the RNA stem (Fig. 8 a). Smaller contributions to the eigenvector come from the RBD1 loop5 and the 5′ side of the RNA stem. This eigenmode appears to be a global mode, since the sites are distributed over the extremities of the complex (Fig. 9 a). The 93 ps lifetime (τk) of its eigenvector is longer than that of most eigenvectors (Fig. 6), but its correlation function decays to a stable plateau, indicating convergence over the course of the 5 ns simulation (data not shown). Parameters of e10 show that its amplitude (λk = 0.145) is still appreciable; its κ = 0.239.
Eigenvector e29 includes contributions from the body of RBD1, including the RNA/protein interface (β1, β3, and loop3) and residues Lys88 and Thr89 from the C-terminal tail. The RNA stem is also included in this eigenvector, but the most prominent contributions come from A2 and U8 (Fig. 8 b). In the cocrystal, the side chain of Lys20 could interact with the phosphate backbone of the stem, close to A2, and perhaps explains the presence of the amide of Lys20 in this eigenmode (Fig. 9 b). The U8 base has been previously noted in simulations to show unusual mobility in the complex, and here it also is the only base among those at the interface that contributes to this eigenvector. The 5 ps correlation time for e29 indicates that these motions are rapid, and its correlation function is converged. The amplitude of e29 (λk = 0.079) is low, but its collectivity, κ = 0.38, shows that there are many contributions to this eigenmode.
The predominant motions in e31 come from uniformly small amplitude contributions across the RNA/protein interface. These include loop nucleotides A6U7…C10A11C12 (U8 and G9 do not appear). From the protein, amides of Tyr13, Phe56, Lys88, and Thr89 form the major part of the binding surface; together these two areas of the molecules illustrate how the complex is now linked through correlated motions (Fig. 9 c). The relatively large contributions from Arg7 could reflect the network of interactions that link the N- and C-termini of the protein; the contribution from Ser71 is not easily explained. Eigenvector e31 has a lifetime of 5 ps, an amplitude of 0.070, and a collectivity of 0.289.
Finally, e40 is predominantly a protein eigenmode that excludes the binding surface. RNA contributions are relatively minor and come from A1 and the ribose of C10 (Figs. 8 d and 9 d). Their presence in e40 illustrates how selective coupling occurs in the complex and how unpredictable it appears. This eigenmode, with a lifetime of 5 ps, is converged, indicating its modes should be adequately sampled in the simulation. Its amplitude is 0.061, while its collectivity is 0.278.
There are many other examples of the intricate connections between RNA and protein in the other eigenvectors. Some correlated motions can be readily explained by proximity or covalent connectivity, whereas others do not appear to have a simple physical rationale. An obviously missing component in the analysis is any contribution of water molecules that could serve as connectors between sites. Future directions of this work include investigation of the role of solvent in these correlations.
Correlations on the RBD1-binding face
Many eigenvectors of the RED covariance matrix calculated for unbound RBD1 displayed large amplitude correlated motions coupling loop 1, loop 3, and the TDS sequence, three important elements of the RNA-binding surface (17). For the RBD1:SL2 complex, these correlations are not as easy to see as the amplitude of motion experienced by these regions has been significantly reduced. It is predicted that what little motion these sites experience should still display a high degree of correlation, however, and given that they all interact with SL2, the RNA too should contribute to the eigenvectors that reorient them. When many sites contribute to an eigenvector (high κ; for example e54, Fig. 7), it can be difficult to observe patterns in the correlation between sites of interest. In this case, it is convenient to consider the vector |ksub> spanning the subspace in the orthonormalized eigenvector |k> that represents a particular region of the molecule, such as a loop or a secondary structure element. The projection of |k> onto this subspace (‖ksub‖2) for each |k> can help reveal which eigenvectors reorient the region of interest.
For example, projecting each eigenvector onto loop 1 reveals the modes that contribute to its mobility; comparison with the same projection calculated for loop 3 shows which modes affect both sites simultaneously (Fig. 10 a). In this plot, the projection of each normalized eigenvector onto the loop 1 subspace (black) and the loop 3 subspace (blue) is displayed as a bar, with height proportional to the magnitude of the projection. Because the eigenvectors |k> are normalized, this projection can never exceed 1; large ‖ksub‖2 indicates that the eigenvector is dominated by motions of the subspace of interest. As can be seen in Fig. 10 a, most modes which reorient loop 1 also reorient loop 3, but much of the motion experienced by loop 3 is independent of loop 1. Because the eigenvectors are ordered by descending eigenvalue (motional amplitude), the tendency of loop 3 modes to appear to the right of the plot confirms that loop 3 is less mobile than loop 1. This is consistent with the intrusion of loop 3 into the RNA loop, whereas loop 1 contacts the stem through mostly side chain interactions, leaving the backbone in this region less conformationally constrained.
FIGURE 10.

Projection of the RED eigenvectors onto loop 1 (black), loop 3 (blue), and the TDS linker (red). (a) Most eigenvectors that reorient loop 1 also reorient loop 3, although a significant number of low amplitude modes reorient loop 3 independently. (b) Modes that reorient loop 1 predominantly reorient the TDS linker as well. (c) Modes that reorient loop 3 predominantly reorient the TDS linker as well.
The projection of each eigenvector onto loop 1 and the TDS sequence is shown in Fig. 10 b. These two sites display even stronger overlap, suggesting that much of their motion is correlated. Likewise, most eigenvectors which reorient loop 3 also reorient the TDS sequence (Fig. 10 c), indicating that these sites remain correlated in the complex. Although the amplitude of motion at each of these three critical structures is reduced, the eigenvectors of the RED matrix still predict that they are strongly coupled.
Correlations in the SL2 loop
Mutational analysis of SL2 has shown that several sites in the loop are strongly coupled (9,15). For example, mutation of G9 (the beginning of the highly conserved GCAC sequence) results in an ∼104-fold loss of binding affinity. This number is far more than should be expected from loss of hydrogen bonding interactions from a single base, leading to the hypothesis that mutation at this site (and others that displayed similar trends) not only affects base readout locally, but also at distal sites, due to a reorganization of the RNA/protein interface.
The first seven bases of the loop sequence are all recognized by RBD1, with the conserved GCAC sequence displaying higher sequence specificity than the 5′ AUU (15). Fig. 11 a displays the projection of the normalized eigenvectors onto the AUU and GCAC sequences. The few modes that project strongly onto either of these sequences tend to have significant projections onto both. This suggests that the intramolecular motions of the entire seven nucleotide sequence are correlated. These correlations appear to extend through the C-G loop closing basepair, the only other site in SL2 that is recognized with sequence specificity (not shown). Although the mode amplitude at any single site in the first seven nucleotides of the loop is generally small (too small for clear graphical visualization), correlation between them is almost always seen in the eigenmodes which reorient the loop. This is consistent with the larger than expected changes in binding-free energy upon single site mutation, although the disproportionate selectivity in the GCAC sequence must come from some other source.
FIGURE 11.

Projection of the RED eigenvectors onto the SL2 loop, broken up by subset: (black) AUU, (blue) GCAC, and (red) UCC. (a) Correlation between AUU and GCAC is strong, as evidenced by the nearly complete correspondence between vectors that reorient these two sequences, suggesting that the entire seven nucleotide sequence is correlated. (b) Modes that reorient the AUU sequence and modes that reorient the UCC sequence are almost mutually exclusive. (c) Modes that reorient the GCAC sequence and the UCC sequence are almost mutually exclusive. Taken together, b and c suggest the UCC sequence reorients independently from the rest of the loop.
Even though the first seven nucleotides of the loop reorient as a unit, the UCC sequence at the 3′ end of the loop only displays minimal correlation to these sites (Fig. 11, b and c). Almost none of the modes that project strongly onto UCC also project onto the other nucleotides of the loop. Whereas the motions of the seven nucleotides interacting with RBD1 tend to be restricted, the UCC bases are free to undergo large amplitude excursions, as evidenced by the tendency of large eigenvalue modes to project strongly onto this sequence. These two observations predict that the UCC sequence is a mostly autonomous unit—consistent with the finding that mutation of these bases, or even replacement of the nucleotides with a polyethylene glycol linker, has no measurable effect on the RBD1 binding-free energy (34).
DISCUSSION
The thermodynamics of interaction between RBD1 and SL2 has been extensively studied by mutation of both the protein (10–14) and the RNA (9,15). A model explaining the unusually high binding affinity between RBD1 and SL2 has been proposed, which suggests that intramolecular backbone dynamics of RBD1 are critical for facilitating the conformational capture necessary to form the high affinity complex (14) and that correlations between fast timescale motions of distal sites may facilitate this process (17). Despite the wealth of dynamic information available for unbound RBD1, very little is known about the dynamics of the RBD1:SL2 complex. Using a related RNA from the U1A pre-mRNA, Mittermaier et al. (33) measured NMR relaxation parameters of the RBD1/RNA complex but were unable to calculate order parameters. Most of what is known comes primarily from analysis of RMSD traces, hydrogen bond occupancies, and average structures from MD trajectories (20,21), all of which make better comparison with average (static) solution or crystal structures than with the dynamic information extracted from NMR relaxation measurements. Analysis of the current trajectory of RBD1:SL2 using the RED formalism (18) allows immediate comparison of dynamics with experimental data acquired for the unbound domain. Most importantly, analysis of the RBD1:SL2 complex with a covariance based method provides novel insight into its cooperative dynamics, which are the likely physical origin of the intriguing thermodynamic cooperativity previously observed between the RNA and the C-terminus of RBD1.
Dynamic properties of the complex
As the cocrystal showed, there are two distinct regions of the RNA loop as it is held in the complex: the C:G loop closing basepair and the AUUGCAC sequence form a tight interface with the protein, whereas the UCC sequence is solvent exposed (7). The loop closing C-G basepair of the RNA, as well as the first seven nucleotides of the loop (Fig. 1 b), are recognized with varying levels of sequence specificity, with the conserved GCAC sequence playing an especially important role (15). RBD1 does not read the base composition of the final three loop positions; these nucleotides appear to serve only as spacers that maintain the total loop length necessary for proper recognition of the first seven bases (34). The RNA-binding surface of RBD1 includes β1 and β3, which are covered by RNA, loop 1, which makes electrostatic interactions with the stem of the RNA, and loop 3, which moves into the RNA stem/loop junction to contact specific bases. The structure of the complex leads to the prediction that the interface will be highly structured, but the extent of its dynamic motion cannot be anticipated.
Structural rearrangements of RBD1 are confined to its loops and the T89D90S91 sequence (noting that the C-terminal tail must extend away from the body of the protein to accommodate the RNA). Three loops of the domain (loops 1, 3, and 5) were shown by 15N NMR relaxation measurements to have lower order parameters than the body of the protein (14,16,35). Those properties were correctly described by RED analysis of trajectories of unbound RBD1 (17), leading to the expectation that RED analysis of the complex will be similarly accurate and thus allow an evaluation of how the dynamics of the protein have been altered by complex formation.
The structures of the RNA alone in solution and bound to protein are very different. The most drastic conformational change that accompanies formation of the complex is that of SL2 RNA. In solution, the loop structure changes from stacked, A-form-like structure to a flexible and floppy structure as a function of temperature (NMR data, not shown). In the complex, the bases of SL2 are splayed outward to make sequence-specific contacts, forming a constrained structure on the surface of the protein. Unfortunately, there are no experimental data to describe the timescales of motion in the free RNA, the bound RNA, or of the conformational change.
Some motions that involve both RNA and protein will be rapid (ps-ns) and thus captured by the 5 ns molecular dynamics simulations. These motions would also be reported by order parameters obtained from NMR relaxation experiments, analyzed by the Lipari-Szabo formalism (30,31). In the unfortunate absence of experimental NMR data that describe the dynamics of this complex, we rely here on RED analysis and its predictions.
Given the highly flexible nature of unbound SL2 and of the RBD1 loops in the binding surface, it is surprising just how inflexible the amino acids and nucleotides forming the protein/RNA interface are in this complex. The order parameters calculated from RED analysis of the MD trajectory predict that the backbone of loop 1, loop 3, and the TDS linker are just as rigid as the backbone of the various secondary structure elements. In contrast, loop 5 retains the low order parameters indicative of conformational freedom that it displays in the absence of RNA. Structurally, loop 5 packs against loop 1, which in turn packs against loop 3 in unbound RBD1; and yet, RED analysis of the unbound domain did not reveal strong correlation between loop 5 and either loop 1 or loop 3 (17). These results, combined with this analysis of the RBD1:SL2 complex, suggest that loop 5 is mostly independent of loop 1 and loop 3, despite their spatial proximity. It is intriguing that the correlation network that is hypothesized to so strongly couple the RNA-binding interface does not extend to the adjacent loop that does not contact RNA.
The UCC sequence is independent
Although the first seven nucleotides of the loop display restricted motion, order parameters for the UCC sequence are very low, indicating that both bases and riboses are highly flexible. The effect on binding affinity of making single RNA point mutations in the AUUGCAC sequence is nonadditive, meaning that the sum of the changes in binding affinity from each mutation is drastically higher than the overall affinity (9,15). This implies a highly cooperative structure for the bases of the loop, with mutation at one site preventing proper sequence-specific recognition of some or all of the others. This effect did not extend into the UCC sequence that makes no contact with RBD1 in the cocrystal structure (7) (Fig. 1 b) and can be replaced by polyethylene glycol without affecting the binding affinity (34). This suggests that at least some of the observed coupling between the first seven bases of the loop originates from the bound form of the RNA, even though they are primarily displayed on the protein surface with an outward orientation such that they do not stack with each other. The loop closing C:G basepair is also involved in the cooperative structure element defined by the first seven loop nucleotides in the complex, meaning that the UCC sequence truly is isolated from its covalent neighbors.
The eigenvectors of the RED covariance matrix confirm the virtual excision of the UCC sequence from the rest of the loop structure, as the majority of the eigenvectors that reorient it do not reorient any other loop nucleotides, or the C:G close, to any appreciable extent. The majority of the eigenvectors that reorient the UCC sequence have appearances similar to e1 (Fig. 7 a), with the relative weight of the fraying terminal basepair and the individual elements of the UCC sequence varying between the vectors. Lastly, the UCC sequence is conspicuously absent from most of the interface spanning eigenmodes (such as e54, Fig. 7 c), which confirms that it does not interact with any of the portions of RBD1 that define the binding interface. It is striking that the UCC sequence can serve as such an independent element without disrupting the sequence-specific interactions to either its 5′ or 3′ side.
Tight binding interface
The RNA-binding surface of RBD1 is large, spanning an entire face of the folded domain. MM/PBSA studies of the interaction between RBD1 and SL2 predict that the free energy of ordering the RBD1-binding surface is large (on the order of 10 kcal/mol; (22)). If the distal elements of this binding surface were not in some way preorganized, the free energy required to order the surface upon binding would be extremely costly. For example, two mutants of G53 (RBD1-G53A and RBD1-G53V) have been shown by RED analysis to decouple distal elements of the binding surface (17). RBD1-G53A binds with an affinity 2.9 kcal/mol less favorable than wild type, whereas RBD1-G53V loses 5.7 kcal/mol of binding free energy, more than one third of the total wild-type binding free energy (ΔGo = −13.9 kcal/mol for the conditions used in the comparison; (16)). The RED results for unbound and bound RBD1 suggest that, although the unbound molecule is flexible, a significant amount of the ordering necessary for RNA binding is already “prepaid” in the pattern and extent of motional correlations present in the unbound domain.
Loop 3 is flexible on the ps-ns timescale in unbound RBD1, but in the context of the G53 mutants a significant portion of this mobility is lost. This suggests that the G53 mutants decouple the binding surface by locking loop 3 down, thus preventing the correlated motions required for coupling. In contrast, NMR spin relaxation studies of constructs with mutations at conserved sites on the β-sheet surface (Y13, Q54, F56) show that these mutations disrupt thermodynamic coupling while increasing the ps-ns mobility of loop 3 (14). We predict that RED analysis of trajectories bearing one or more of these mutations would also display decoupled reorientational motion. Combination of the loop 3 and β-sheet mutagenesis results suggests that the extent of flexibility in loop 3 has been heavily optimized by evolution and that any change toward greater or lesser flexibility is disruptive.
Unlike the unbound state of RBD1, the bound form of the domain is almost uniformly inflexible. It is notable that, although the interface itself is quite rigid, the majority of the eigenmodes of the RED matrix span the interface, correlating the intramolecular reorientations of the two molecules in the complex. It has previously been observed that large amplitude reorientational modes tend to be more local in nature than the largest amplitude modes from standard quasiharmonic analysis (36), making it unsurprising that the largest amplitude RED modes are dominated by local motion (of the UCC element in e1, for example). Interface spanning modes are seen in normal mode analysis of protein dimers (such as insulin; (37)) and are predicted to contribute to dimer stability. Modes which correlate RBD1 and SL2 sites begin to dominate the eigenvectors of the RED matrix around e10, which, with λk = 0.145 and τk = 93 ps, is still in the range of eigenmodes with significant impact on the observed dynamics, and likely the stability, of the complex. The RED analysis produces results akin to those for tight protein-protein interactions, suggesting that this behavior may be a more general feature of macromolecular interactions regardless of the molecules involved (protein, nucleic acid, or both). In other words, neither RBD1 nor SL2 behaves like a ligand for the other, but rather the complex should be thought of as a macromolecular assembly.
CONCLUSIONS
Previous thermodynamic pairwise coupling analysis of RBD1 mutants has revealed extensive cooperativity between distal sites on the domain's RNA-binding surface. Some of these interactions, such as those between conserved residues on the β-sheet, have been demonstrated in the presence and the absence of RNA (14). Others, such as the coupling between one of these sheet residues (Y13) and the C-terminal tail, depend on the presence of the bound RNA and extend through it (13). Of course, the need to generate libraries of single and double mutants to exhaustively screen the number of possible pairwise interactions has inherently limited the number of RBD1 sites that have been probed through these methods. RED analysis of both the unbound (17) and SL2 bound forms of RBD1 has allowed us to extend the site interaction model predicted by binding studies to a fully cooperative picture that spans the entire binding surface. From these results, we have demonstrated an extensive network of correlated motion that unites spatially distant loops or bases and that extends across the protein/RNA interface. The result of this tight network of interactions is the exquisitely sensitive sequence specificity and structural preference demonstrated by RBD1 for its RNA-binding partners.
Acknowledgments
The molecular dynamics simulations were run using CPU hours awarded to K.B.H. by the National Partnership for Advanced Computational Infrastructure. S.A.S. is the recipient of a National Science Foundation predoctoral fellowship and funding from the Molecular Biophysics Training Grant. This work was supported by the National Institutes of Health (K.B.H.).
References
- 1.Keene, J. D., and C. C. Query. 1991. Nuclear RNA-binding proteins. Prog. Nucleic Acid Res. 41:179–202. [DOI] [PubMed] [Google Scholar]
- 2.Burd, C. G., and G. Dreyfuss. 1994. Conserved structures and diversity of functions of RNA-binding proteins. Science. 265:615–621. [DOI] [PubMed] [Google Scholar]
- 3.Scherly, D., W. Boelens, W. J. van Venrooij, N. A. Dathan, J. Hamm, and I. W. Mattaj. 1989. Identification of the RNA binding segment of human U1A protein and definition of its binding site on U1 snRNA. EMBO J. 8:4163–4170. [DOI] [PMC free article] [PubMed] [Google Scholar]
- 4.Hall, K. B., and W. T. Stump. 1992. Interaction of N-terminal domain of U1A protein with an RNA stem/loop. Nucleic Acids Res. 20:4283–4290. [DOI] [PMC free article] [PubMed] [Google Scholar]
- 5.Nagai, K., C. Oubridge, T. H. Jessen, J. Li, and P. R. Evans. 1990. Crystal structure of the RNA-binding domain of the U1 small nuclear ribonucleoprotein A. Nature. 348:515–520. [DOI] [PubMed] [Google Scholar]
- 6.Avis, J. M., F. H. T. Allain, P. W. A. Howe, G. Varani, K. Nagai, and D. Neuhaus. 1996. Solution structure of the N-terminal RNP domain of U1A protein: the role of C-terminal residues in structure stability and RNA binding. J. Mol. Biol. 257:398–411. [DOI] [PubMed] [Google Scholar]
- 7.Oubridge, C., N. Ito, P. R. Evans, C.-H. Teo, and K. Nagai. 1994. Crystal structure at 1.92 Å resolution of the RNA-binding domain of the U1A spliceosomal protein complexed with an RNA hairpin. Nature. 372:432–438. [DOI] [PubMed] [Google Scholar]
- 8.Williamson, J. R. 2000. Induced fit in RNA-protein recognition. Nat. Struct. Biol. 7:834–837. [DOI] [PubMed] [Google Scholar]
- 9.Hall, K. B. 1994. Interaction of RNA hairpins with the human U1A N-terminal RNA binding domain. Biochemistry. 33:10076–10088. [DOI] [PubMed] [Google Scholar]
- 10.Jessen, T. H., C. Oubridge, C. H. Teo, C. Pritchard, and K. Nagai. 1991. Identification of molecular contacts between the U1A small nuclear ribonucleoprotein and U1 RNA. EMBO J. 10:3447–3456. [DOI] [PMC free article] [PubMed] [Google Scholar]
- 11.Kranz, J. K., J. Lu, and K. B. Hall. 1996. Contribution of the tyrosines to the structure and function of the human U1A N-terminal RNA binding domain. Protein Sci. 5:1567–1583. [DOI] [PMC free article] [PubMed] [Google Scholar]
- 12.Zeng, Q., and K. B. Hall. 1997. Contribution of the C-terminal tail of U1A RBD1 to RNA recognition and protein stability. RNA. 3:303–314. [PMC free article] [PubMed] [Google Scholar]
- 13.Kranz, J. K., and K. B. Hall. 1998. RNA binding mediates the local cooperativity between the β-sheet and the C-terminal tail of the human U1A RBD1 protein. J. Mol. Biol. 275:465–481. [DOI] [PubMed] [Google Scholar]
- 14.Kranz, J. K., and K. B. Hall. 1999. RNA recognition by the human U1A protein is mediated by a network of local cooperative interactions that create the optimal binding surface. J. Mol. Biol. 285:215–231. [DOI] [PubMed] [Google Scholar]
- 15.Stump, W. T., and K. B. Hall. 1995. Crosslinking of an iodo-uridine-RNA hairpin to a single site on the human U1A N-terminal RNA binding domain. RNA. 1:55–63. [PMC free article] [PubMed] [Google Scholar]
- 16.Showalter, S. A., and K. B. Hall. 2004. Altering the RNA-binding mode of the U1A RBD1 protein. J. Mol. Biol. 335:465–480. [DOI] [PubMed] [Google Scholar]
- 17.Showalter, S. A., and K. B. Hall. 2002. A functional role for correlated motion in the N-terminal RNA-binding domain of human U1A protein. J. Mol. Biol. 322:533–542. [DOI] [PubMed] [Google Scholar]
- 18.Prompers, J. J., and R. Brüschweiler. 2001. Reorientational eigenmode dynamics: a combined MD/NMR relaxation analysis method for flexible parts in globular proteins. J. Am. Chem. Soc. 123:7305–7313. [DOI] [PubMed] [Google Scholar]
- 19.Hermann, T., and E. Westhof. 1999. Simulations of the dynamics at an RNA-protein interface. Nat. Struct. Biol. 6:540–544. [DOI] [PubMed] [Google Scholar]
- 20.Reyes, C. M., and P. A. Kollman. 1999. Molecular dynamics studies of U1A-RNA complexes. RNA. 5:235–244. [DOI] [PMC free article] [PubMed] [Google Scholar]
- 21.Tang, Y., and L. Nilsson. 1999. Molecular dynamics simulations of the complex between human U1A protein and hairpin II of U1 small nuclear RNA and of free RNA in solution. Biophys. J. 77:1284–1305. [DOI] [PMC free article] [PubMed] [Google Scholar]
- 22.Reyes, C. M., and P. A. Kollman. 2000. Structure and thermodynamics of RNA-protein binding: using molecular dynamics and free energy analyses to calculate the free energies of binding and conformational change. J. Mol. Biol. 297:1145–1158. [DOI] [PubMed] [Google Scholar]
- 23.Pitici, F., D. L. Beveridge, and A. M. Baranger. 2002. Molecular dynamics simulation studies of induced fit and conformational capture in U1A-RNA binding: do molecular substrates code for specificity? Biopolymers. 65:424–435. [DOI] [PubMed] [Google Scholar]
- 24.Case, D. A., D. A. Pearlman, J. W. Caldwell, T. E. Cheatham III, W. S. Ross, C. Simmerling, T. Darden, K. M. Merz, R. V. Stanton, A. Cheng, J. J. Vincent, M. Crowley, V. Tsui, R. Radmer, Y. Duan, J. Pitera, I. Massova, G. L. Seibel, U. C. Singh, P. Weiner, and P. A. Kollman. 1999. AMBER 6. University of California, San Francisco.
- 25.Cornell, W. D., P. Cieplak, C. I. Bayly, I. R. Gould, K. M. Merz, D. M. Ferguson, D. C. Spellmeyer, T. Fox, J. W. Caldwell, and P. A. Kollman. 1995. A second generation force field for the simulation of proteins, nucleic acids, and organic molecules. J. Am. Chem. Soc. 117:5179–5197. [Google Scholar]
- 26.Jorgensen, W. L., J. Chandrasekhar, and J. D. Madura. 1983. Comparison of simple potential functions for simulating liquid water. J. Chem. Phys. 79:926–935. [Google Scholar]
- 27.Ryckaert, J.-P., G. Ciccotti, and W. F. van Gunsteren. 1977. Numerical integration of the Cartesian equations of motion of a system with constraints: molecular dynamics of n-alkanes. J. Comput. Phys. 23:327–341. [Google Scholar]
- 28.Darden, T. A. 2001. Treatment of long-range forces and potential. In Computational Biochemistry and Biophysics. O. M. Becker, A. D. MacKerell, B. Roux, and M. Watanabe, editors. Marcel Dekker, New York. 91.
- 29.Brüschweiler, R., and P. E. Wright. 1994. NMR order parameters of biomolecules: a new analytical representation and application to the Gaussian axial fluctuation model. J. Am. Chem. Soc. 116:8426–8427. [Google Scholar]
- 30.Lipari, G., and A. Szabo. 1982. Model-free approach to the interpretation of nuclear magnetic resonance relaxation in macromolecules. 1. Theory and range of validity. J. Am. Chem. Soc. 104:4546–4559. [Google Scholar]
- 31.Lipari, G., and A. Szabo. 1982. Model-free approach to the interpretation of nuclear magnetic resonance relaxation in macromolecules. 2. Analysis of experimental results. J. Am. Chem. Soc. 104:4559–4570. [Google Scholar]
- 32.Brüschweiler, R. 1995. Collective protein dynamics and nuclear spin relaxation. J. Chem. Phys. 102:3396–3403. [Google Scholar]
- 33.Mittermaier, A., L. Varani, D. R. Muhandiram, L. E. Kay, and G. Varani. 1999. Changes in sidechain and backbone dynamics identify determinants of specificity in RNA recognition by human U1A protein. J. Mol. Biol. 294:967–979. [DOI] [PubMed] [Google Scholar]
- 34.Williams, D. J., and K. B. Hall. 1996. RNA hairpins with non-nucleotide spacers bind efficiently to the human U1A protein. J. Mol. Biol. 257:265–275. [DOI] [PubMed] [Google Scholar]
- 35.Lu, J., and K. B. Hall. 1997. Tertiary structure of RBD2 and backbone dynamics of RBD1 and RBD2 of the human U1A protein determined by NMR spectroscopy. Biochemistry. 36:10393–10405. [DOI] [PubMed] [Google Scholar]
- 36.Lienin, S. F., and R. Brüschweiler. 2000. Characterization of collective and anisotropic reorientational protein dynamics. Phys. Rev. Lett. 84:5439–5442. [DOI] [PubMed] [Google Scholar]
- 37.Tidor, B., and M. Karplus. 1994. The contribution of vibrational entropy to molecular association. The dimerization of insulin. J. Mol. Biol. 238:405–414. [DOI] [PubMed] [Google Scholar]