Abstract
Frequency-dependent absorption coefficients and refractive indices of amino acids (glycine and l-alanine) and polypeptides (polyglycine and poly-l-alanine) in the wavenumber region from 7 to 55 cm−1 were measured by terahertz time-domain spectroscopy. A vibrational band was observed at 45.5 cm−1 for polyglycine, which was assigned as an interchain mode. The reduced absorption cross sections of the amino acids and polypeptides show power-law behavior. The exponents are different between the monomers and polymers, and those of the two polypeptides suggest that the time dependences of the total dipole moments are similar in the timescale of subpico- to picoseconds.
Understanding of structures and dynamics of polypeptides is a fundamental problem for studies on protein function. Collective motions in a protein, in which a number of atoms move in a concerted fashion, are of particular interest, and these motions often have their characteristic frequencies in the frequency region below 100 cm−1 (1). Owing to the dramatic progress in techniques of generation and detection of freely propagating terahertz (THz) (1 THz ∼ 33 cm−1) radiation, spectroscopic investigation in the far infrared region (FIR) has been widely conducted on condensed phase systems including biological samples (2). Absorption spectra in the THz region contain information on dynamics with timescales of pico- and subpicoseconds. In the previous report we studied FIR absorption spectra of polypeptides (polyglycine and poly-l-alanine) and cytochrome c in the wavenumber region from 7 to 160 cm−1 using a polarizing Michelson interferometer with a bolometer (3). This method measures changes of the FIR intensity (square of the electric field) transmitted through a sample. THz time-domain spectroscopy (THz-TDS), on the other hand, measures the electric field of the radiation through a sample, providing the phase and amplitude changes of the radiation. Therefore, the refractive index n and the absorption coefficient α of the sample are obtained. In this study we have conducted THz-TDS of two amino acids, glycine and l-alanine, and corresponding two polypeptides, polyglycine and poly-l-alanine. The combination of the two physical quantities, n and α, enables us to discuss rigorously dynamics of the total dipole moment of the system.
THz-TDS apparatus was described in detail elsewhere (4). Briefly, femtosecond pulses from a Ti:sapphire oscillator are used for generation and detection of the THz radiation. A major part of the pulse is focused to a (100) InAs wafer with a 45° incidence to generate the THz radiation. The wafer is placed in a magnetic filed (1.6 T) to enhance the intensity of the radiation. The rest of the femtosecond pulse is used to detect an electric field of the pulsed THz radiation by the electro-optic sampling method with a 〈110〉 ZnTe crystal (1 mm in thickness). Polypeptides and amino acids were commercially available powders (polyglycine (Sigma, St. Louis, MO), poly-l-alanine (Miles-Yeda, Rehovot, Israel), glycine, and l-alanine (Wako, Richmond, VA)) and used without further purification. The samples in powder were pressed to self-standing pellets in 3 or 5 mm diameter. Thickness of the samples ranged from submillimeters to a few millimeters. The THz spectra of each sample were obtained by averaging over several measurements of pellets with different thickness. All the measurements were done at ambient temperature (20°C) and humidity less than 50%. We confirmed that samples prepared in different days did not show any large difference in THz spectra.
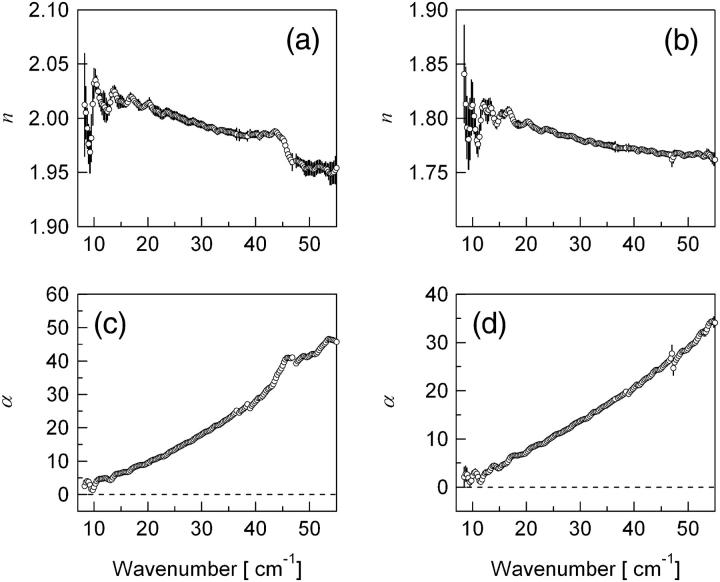
Fig. 1 shows frequency-dependent refractive indices and absorption coefficients of polyglycine and poly-l-alanine in powder. The conformation of the polypeptides in powder were identified by mid-infrared (IR) absorption spectra, showing that the secondary structures of polyglycine and poly-l-alanine have the antiparallel-chain rippled sheet (polyglycine I) and the α-helical structure (α-poly-l-alanine), respectively (3). In the previous work we observed one intense band at around 140 cm−1 for polyglycine below 160 cm−1, which originates in combination of the H⋯O stretch between antiparallel chains (3). In this work we clearly observe a band at 45.5 cm−1 for polyglycine though the previous work did not show any band around 40 cm−1. THz-TDS has some advantages over the usual intensity detection method of the radiation. For example, THz-TDS is capable of eliminating an effect of multiple reflection inside the sample on the spectrum, the so-called etalon effect. Thorough analysis of the THz spectra enables us to find a vibrational band in this region. An IR-active band at 37 cm−1 was predicted by the normal mode analysis of polyglycine I with the β-structure of the antiparallel-chain rippled sheet (5). Normal modes were calculated on the assumption that this β-structure has C2h symmetry in a unit cell. According to this calculation, the band at 37 cm−1 arises mainly from NH⋯O and CO⋯H in-plane angle bends between adjacent polyglycine chains. We, therefore, assign the observed 45.5-cm−1 band as the interchain mode of polyglycine I. For poly-l-alanine, the previous study reported a band at 120 cm−1 and a shoulder at 85 cm−1, which were suggested to be associated with skeletal deformation and skeletal torsion, respectively. Although a band at 40 cm−1 arising from NH out-of-plane angle bend and −CβH3 bend was predicted by the calculation (5), we do not observe such a band even in this work. This spectral difference between the two polypeptides suggests that polyglycine has a longer range structural order than poly-l-alanine.
FIGURE 1 .
Frequency-dependent refractive index (a and b) and extinction coefficient (c and d) of polypeptide (polyglycine, poly-l-alanine).
We next discuss power-law features in the THz spectra for the polypeptides and compare them with the corresponding amino acids. The absorption cross section,  (
( ) is expressed as
 |
(1) |
where  is the wavenumber, N is the number of molecules (or residues) in the system, and the other symbols have usual meanings. M(t) is the total dipole moment of the system,
  and μj(t) is the individual dipole moment of a j-th molecule (or residue). To eliminate the thermal factor
  we define the reduced absorption cross section (RACS) as
 |
(2) |
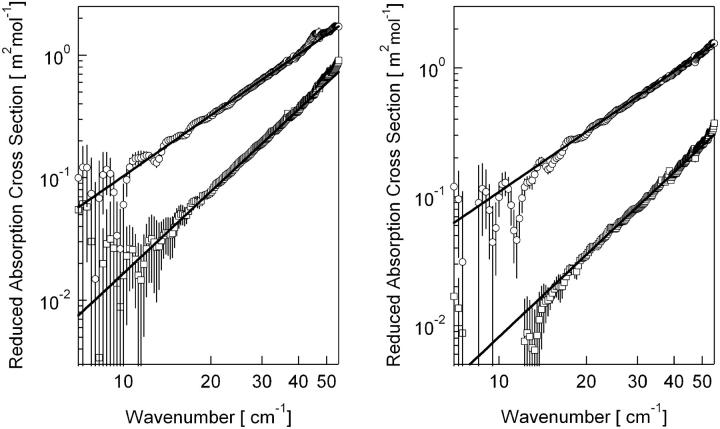
Fig. 2 shows the frequency-dependent RACSs of glycine and polyglycine (left) and l-alanine and poly-l-alanine (right) in the double logarithmic plot. All the spectra are approximately proportional to the power of the wavenumber in the region from 7 to 55 cm−1. The exponents for glycine, polyglycine, l-alanine, and poly-l-alanine are 2.22 ± 0.03, 1.65 ± 0.04, 2.12 ± 0.05, and 1.55 ± 0.02, respectively. The exponents for the amino acids are close to two. The RACS is considered as a product of the IR activity and density of states (6). If we assume that the IR activity is constant in the low-frequency region (6), the RACS is proportional to the density of states. According to the Debye theory of crystals, the density of states is proportional to the square of the frequency if the wavelengths of the normal modes in the crystal are long compared to the atomic spacing. The exponents close to two of the power-law behavior in the RACS of amino acids are considered to reflect the density of state. This work suggests that the Debye frequencies of the amino acids in the solid state are larger than 55 cm−1.
FIGURE 2 .
(Left) Reduced absorption cross sections of polyglycine (○) and glycine (□). (Right) Those of poly-l-alanine (○) and l-alanine (□).
The RACS of polypeptides are stronger than that of corresponding monomers and the exponents in power law of the polypeptides are smaller than two, suggesting that polymerization of amino acids induces extra dynamics of the total dipole moments in the subpico- to picosecond region. If the exponent of the RACS is 2 − a, the time-correlation function of the total dipole moment asymptotically decays with ta−1 (7). This form of the equation suggests that the TCF does not follow an exponential decay; instead, it should be described by a distribution of time constants. This results also shows that the dynamics of polyglycine and poly-l-alanine are similar despite difference in the secondary structure. A similar power-law behavior was also observed in the dynamic structure factor of myoglobin obtained by the incoherent neutron scattering (8). These features are suggested to result from the average short-time behavior of dynamics governed by the cage effect experienced by the atoms, not by the special force nor structural details of biopolymers (7). Furthermore, it was reported that the density of vibrational normal modes of globular proteins fall into a universal curve (9,10) in the low-frequency region. The power-law behavior of the polypeptides observed in this study indicates that the dynamics of the total dipole moment are independent of specific interactions and structures of polypeptides in the subpico- to picosecond timescale.
Acknowledgments
This work was supported by a Japan Society for the Promotion of Science research grant for the Future Program.
Kohji Yamamoto's present address is Institute of Laser Engineering, Osaka University, 2-6 Yamadaoka, Suita, Osaka, 565-0871, Japan.
References
- 1.Haywards, S., and N. Go. 1995. Collective variable description of native protein dynamics. Annu. Rev. Phys. Chem. 46:223–250. [DOI] [PubMed] [Google Scholar]
- 2.Sakai, K. 2005. Terahertz Optoelectronics. K. Sakai, editor. Springer, Berlin, Germany.
- 3.Yamamoto, K., K. Tominaga, H. Sasakawa, A. Tamura, H. Murakami, H. Ohtake, and N. Sarukura. 2002. Far-infrared absorption measurements of polypeptides and cytochrome c by THz radiation. Bull. Chem. Soc. Jpn. 75:1083–1092. [Google Scholar]
- 4.Yamamoto, K., Md. H. Kabir, K. Tominaga. Terahertz time-domain spectroscopy of sulfur-containing biomolecules. J. Opt. Soc. Am. B. In press.
- 5.Krimm, S. 1987. Peptides and proteins. In Biological Applications of Raman Spectroscopy. T. G. Spiro, editor. John Wiley & Sons, New York, NY. 1–45.
- 6.Shuker, R., and R. W. Gammon. 1970. Raman-scattering selection-rule breaking and the density of states in amorphous materials. Phys. Rev. Lett. 25:222–225. [Google Scholar]
- 7.Götze, W., and L. Sjögren. 1992. Relaxation processes in supercooled liquids. Rep. Prog. Phys. 55:241–376. [Google Scholar]
- 8.Doster, W., S. Cusack, and W. Petry. 1990. Dynamic instability of liquidlike motions in a globular protein observed by inelastic neutron scattering. Phys. Rev. Lett. 65:1080–1083. [DOI] [PubMed] [Google Scholar]
- 9.ben-Avraham, D. 1993. Vibrational normal-mode spectrum of globular proteins. Phys. Rev. B. 47:14559–14560. [DOI] [PubMed] [Google Scholar]
- 10.Etchegoin, P. 1998. Glassylike low-frequency dynamics of globular proteins. Phys. Rev. E. 58:845–848. [Google Scholar]


