

Abstract
Antimicrobial peptides have gained a lot of interest in recent years due to their potential use as a new generation of antibiotics. It is believed that this type of relatively short, amphipathic, cationic peptide targets the bacterial membrane, and destroys the chemical gradients over the membrane via formation of stable or transient pores. Here we use the NMR structure of cyclo(RRWWRF) in a series of molecular dynamics simulations in membranes at various peptide/lipid ratios. We observe that the NMR structure of the peptide is still stable after 100 ns simulation. At a peptide/lipid ratio of 2:128, the membrane is only a little affected compared to a pure dipalmitoylphosphatidylcholine lipid membrane, but at a ratio of 12:128, the water-lipid interface becomes more fuzzy, the water molecules can reach deeper into the hydrophobic core, and the water penetration free-energy barrier changes. Moreover, we observe that the area per lipid decreases and the deuterium order parameters increase in the presence of the peptide. We suggest that the changes in the hydrophobic core, together with the changes in the headgroups, result in an imbalance of the membrane and that it is thus not an efficient hydrophobic barrier in the presence of the peptides, independent of pore formation.
INTRODUCTION
Antimicrobial peptides are an important part of the defense system against microbial infections in eukaryotes. The peptides differ in size, composition, and secondary structure, but most of them are amphipathic and have a positive net charge. The peptides are believed to target the bacterial membrane and destroy the chemical gradients over the membrane (1). Probably, this takes place via a disruption of the membrane, either via an ordered pore formation, which is described by the toroidal model and the barrel-stave model (2), or in a disordered manner, where the peptides adhere to the surface and destabilize the membrane, resulting in its collapse, which is often referred to as the carpet model (3). Also a combination of the ordered and disordered mechanisms has been suggested as a possible mechanism (4).
Although lipids have a remarkable ability to form new phases, minor balances must be changed to initiate a new phase formation (5,6). The antimicrobial peptide must be able to influence this phase behavior to exert its activity, regardless of the model. Studies of this type of lipid-peptide interaction have always faced experimental difficulties in the determination of structures at atomic resolution, due to the inherently disordered structure of membranes in the biologically relevant liquid crystalline phase. Moreover, the use of probes, such as fluorescence labeling, will have an effect on the membrane structure (7). The progress in computer simulations of membranes during the last decade has now made it possible to model these chaotic systems at atomic resolution on the timescale from 10−15 to 10−7 s. Consequently, many investigations of the interactions of various types of peptides with various types of lipid membranes using MD simulations have appeared recently (8–17). Some of these studies have turned out to be useful in the determination of induced structural stability of the peptide (9,18).
Recently, the structure of the hexapeptide Ac-RRWWRF-NH2 was reported (19). The peptide was identified by screening a synthetic combinatorial library, and it has a large influence on the thermotropic phase behavior in model membranes having anionic PG headgroups. In contrast, it has little effect on membranes containing zwitterionic PC headgroups. Jing et al. conclude that the structure of the peptide was stabilized in the presence of anionic lipids. By preparing a head-to-tail cyclic peptide, c-RW, Dathe and co-workers (20,21) obtained a peptide with lytic activity on membranes with anionic as well as zwitterionic headgroups. They also suggest that the c-RW targets the bacterial membrane rather than an intracellular target to exert its antimicrobial activity. This study is based upon their assumption. Recently, we have determined the NMR structure of c-RW (among others) bound to sodium dodecyl sulfate and DPC micelles (22). The structure of the peptide when bound to the micelles resembles two short β-strands and the side chains are oriented so that one side of the peptide is hydrophilic and the other is hydrophobic. Also the position and orientation of c-RW relative to the micelle surface was investigated; c-RW turned out to be half buried in the hydrophobic core with the peptide backbone plane parallel to the micelle surface. Here, we follow up the structure determination using molecular dynamics simulations of c-RW in the presence of explicit DPPC membranes to validate the NMR structure calculated in vacuum and to investigate the effect of c-RW on the membrane. It is known from experiments that the peptide lyses POPC as well as POPG vesicles at a ratio of 1:10 (20). Since the peptide is about as active on anionic PG as on zwitterionic PC lipid headgroups, and because the NMR structure is determined in micelles having a PC headgroup, we have chosen a DPPC bilayer as a model membrane. Moreover, DPPC membranes are well characterized by many different experimental techniques as well as by numerous MD simulations, which gives us access to a wide range of independent checkpoints that are exploited in the analysis.
We have carried out a series of simulations covering times up to 100 ns at peptide/lipid ratios of 0:128, 2:128, and 12:128. The systems are from now on denoted as 0:128, 2:128, and 12:128, referring to the respective peptide/lipid ratios. Simulating at relevant peptide/lipid ratios, the trajectories were analyzed with respect to specific lipid properties and to peptide-lipid interactions that constitute important steps toward membrane disruption. We confirm the NMR structure calculated in vacuum, and we observe various effects, showing that the presence of the peptides destabilizes the liquid crystalline phase by changing the force balance at the membrane-water interface.
METHODS
The systems that have been studied are DPPC membranes consisting of 128 lipids, ∼5780 SPC water molecules, and a variable number of Cl− counterions. We have simulated three such membranes accommodating 0, 2, and 12 c-RW peptides each. We have made two separate simulations of each of the 2:128 and 12:128 systems, where one simulation was made including the structural restraints on the peptide as derived from NMR results (22) and the other was restraint free. The restrained simulations are carried out to confirm the NMR structure calculations in vacuum. The restraint-free simulations were started using the final structures from the restrained simulations, to avoid long equilibration simulations. The pure membrane simulations have been used as reference systems. The setup of the different simulations is summarized in Table 1. The simulation software was GROMACS 3.1 (23,24). The start conformation of the DPPC membrane was downloaded from the homepage of D. P. Tieleman (http://moose.bio.ucalgary.ca/) (25). All calculations were made on desktop computers. The CPU time was ∼35 h per nanosecond simulation on dual Intel Pentium IV 3.0 GHz processors.
TABLE 1.
Gross properties obtained from the simulations
| System | ttot (ns) | D* peptide(× 10−7 cm2/s) | D* lipid(× 10−7 cm2/s) | Membrane area (nm2) | Lipid area (nm2)† | SCD‡ | ΔGmax§ (kJ/mol) | Barrier width¶ (nm) |
|---|---|---|---|---|---|---|---|---|
| 0:128 | 100 | — | 4.2 ± 1.5 | 41.8 ± 0.6 | 0.65 | 0.193 | 27.9 ± 1.9 | 1.4 |
| 0:64 | 136 | — | 5.1 ± 1.4 | 20.9 ± 0.5 | 0.65 | 0.195 | 28.4 ± 3.4 | 1.5 |
| 0:64‖ | 50 | — | 12.6 ± 4.1 | 22.0 ± 0.4 | 0.69 | 0.181 | 27.0 ± 1.2 | 1.5 |
| 2:128 | 100 | 1.0 ± 0.25 | 3.8 ± 1.6 | 41.3 ± 0.6 | 0.62 | 0.206 | 29.0 | 1.5 |
| 12:128 | 128 | 0.5 ± 0.1 | 1.3 ± 0.6 | 43.8 ± 0.8 | 0.55 | 0.205 | 28.7 ± 1.7 | 0.9 |
| 12:128‖ | 10 | 8.9 ± 6.1 | 3.7 ± 3.5 | 44.3 ± 0.4 | 0.56 | 0.194 | 24.8** | 0.7 |
Slope of a line fitted to the mean-square displacement over the time window 1–3 ns.
Assuming an area of 1.4 nm2 per peptide.
Order parameter for C4 and C4′. The standard deviation for the order parameters is ∼1%.
Water free-energy maximum.
Water free-energy barrier thickness at ΔG = 20 kJ/mol in nanometers.
Simulation temperature 353 K.
Error cannot be estimated because of the short simulation time.
The 0:128 simulations
To assess the suitability of the applied simulation conditions we performed a set of simulations of a pure DPPC bilayer (0:128 and 0:64 system). The systems were equilibrated until the values for deuterium order parameter and area per lipid were stable during a 5-ns time window (summarized in Table 1). These are comparable to other simulations under equivalent conditions and agree well with experimental values. Furthermore, the system was affected neither by changing the time steps from 2 to 5 fs nor by increasing the size from a 64-lipid to a 128-lipid box.
The 2:128 simulations
To rapidly reach an equilibrated state of the 2:128 simulation we used the modified GROMACS code “HOLE” (26) to create cavities with the shape of the peptide surface in the 0:128 system where the two peptides could be inserted (Fig. 1). In this case we therefore assume the structure, the position, and the orientation of the peptide with respect to the lipid bilayer, as derived from the NMR experiments (22). The peptides were oriented with the aromatic side chains sticking down into the aliphatic region of the membrane and the polar face of the backbone and the arginine residues pointing toward the bulk water. The plane formed by the backbone was put parallel to the membrane surface. The peptide backbone was placed in the region of the phosphocholine groups. Thereafter, six Cl− counterions were added. As mentioned, we have made two simulations of the 2:128 system, one where the structure restraints derived from NMR were used throughout the simulation (20-ns length), and the second a production simulation without NMR restraints (80-ns length). We did this to make sure that we simulated the correct structure of the peptide on the one hand (which is known to have a crucial impact on the peptide-membrane interaction (9,18)), and to test the stability of the NMR structure on the other hand. The system was considered equilibrated after 8 ns simulation, as judged by the convergence of lipid deuterium order parameters, area per lipid, and the number of peptide-lipid hydrogen bonds.
FIGURE 1.

Picture of the 2:128 simulation. The aromatic amino acids are shown in green and the arginines in dark blue.
The 12:128 simulations
The initial conformation was prepared by stripping of the water and the ions from the 2:128 system and adding five peptides in the vacuum above each surface of the membrane. Also in this case, the orientation of the peptides was assumed, as discussed above. Thereafter, water was added outside the peptides, and lastly the 36 Cl− counterions were introduced. The system was equilibrated to a correct density by carefully compressing the periodic box using a constant pressure simulation. During this equilibration both the membrane and peptide coordinates were restrained in the xy plane and free to move along the membrane normal. This equilibration scheme was used to observe the unbiased depth of insertion. The system was considered as equilibrated after 28 ns simulation, as judged by the convergence of lipid deuterium order parameters, area per lipid, and the number of peptide-lipid hydrogen bonds. Two separate unrestrained 12:128 simulations were made to increase sampling without increasing the computational overhead caused by parallelization. The runs were started at the end of the restrained 12:128 simulation, but with randomized velocities. The statistical data from these simulations was merged, except for the lateral diffusion analysis, since this requires a continuous time trajectory.
Simulation conditions
All systems were simulated using an NPT ensemble with separate pressure control for the x, y, and z components in the box. The pressure and temperature scaling was achieved using the Berendsen thermo- and barostat (27) using τT = 0.1 ps and τp = 1.0 ps. We used separate thermostats for the lipids, the peptides, and the water and ions, all set to 323 K. To investigate the effect of a higher temperature, the 0:128 and 12:128 systems were also simulated at 353 K. The neighbor list, for atoms within the cutoff of 10 Å, was updated every 10th time step. This cutoff was used for the Lennard-Jones interactions and for the real-space electrostatic interactions. The long range electrostatic interactions were calculated using a particle mesh Ewald summation (28). For the fast-bonded vibrations the LINCS (29,30) algorithm was used. This setup has been tested, and found to be stable (31), and our simulations reproduce these results to a satisfactory degree. For the DPPC molecules, an optimized potentials for liquid simulations model was used (32), and for the peptide the standard GROMACS united-atom force field was used (33). In this force field, hydrogens bound to aliphatic carbons are treated implicitly, whereas hydrogen bond donating and aromatic hydrogens are treated explicitly. The rigid SPC water model was used (34). In all simulations including peptides we have used a time step of 2 fs, since the explicit hydrogen atoms in the peptides are not stable using a longer time step. As a check we have simulated the pure membrane using a 2-fs as well as a 5-fs time step and no significant differences were observed (data not presented).
Evaluation
The trajectories were analyzed with respect to order parameters, partial densities, lateral diffusion, and membrane area using the standard tools included in the GROMACS distribution. All reported standard deviations are calculated by splitting the trajectory into five pieces and calculating the property of interest within each piece, and then calculating the standard deviation of the pieces. This is of particular importance for uncertain properties like lateral diffusion and free-energy barriers. To get a statistical view of the membrane surface in a coordinate system locked to a peptide at the membrane surface, a special tool was developed. The peptide coordinate system (x, y, z) (Fig. 2) was calculated for each frame in the trajectory using a least-square fitted plane spanned by the Cα atoms in the peptide and the direction of the first β-strand. Then a least-square fitted plane spanned by the CG2 (see Fig. 3) atoms (or an arbitrary lipid atom) in the lipids was calculated, forming a new coordinate system (x′, y′, z′). The x′ axis is the projection of the x axis, the z′ axis is the normal to the membrane plane, and the y′ axis is orthogonal to x′ and z′. Then, selected lipid and peptide atom populations were plotted in a histogram fashion using 1-Å or 3-Å spacing grids in the x′, y′ plane. This gives a statistical view of the position of lipid atoms in the vicinity of the peptide and a statistical projection of the peptide onto the x′, y′ plane. The outermost atoms in the lipids, or the “real” surface, can also be accessed by this tool in the following way: In each grid cell (size 1 Å), the distance from the midplane of the atom the farthest away is measured, then the average distance in each grid cell is calculated. This has been computed for the unrestrained 2:128 simulation consisting of 8000 frames over 80 ns.
FIGURE 2.

Sketch of the used coordinate systems. The (x, y, z) coordinate system is oriented with respect to the best plane of the peptide Cα with x poining in the direction from the R2 to the W4 Cα. The coordinate system (x′, y′, z′) is formed by the normal of the bilayer plane being z′ and the projection of x on the membrane being x′.
FIGURE 3.

Structures of the DPPC (upper panel) and cyclo(RRWWRF) (lower panel).
RESULTS
Peptide structure
The structure of the membrane-bound peptides has been analyzed by taking snapshots from the simulations at regular intervals. We calculated the RMSD values in all simulations to be able to compare these structures with those in the NMR investigation (22). The RMSD values are summarized in Table 2 and a comparison of average structures is shown in Fig. 4. In general, the structures as well as the RMSD values obtained by the NMR structure calculations for DPC micelle-bound c-RW are very similar to the structures obtained in the simulations of the 2:128 and 12:128 systems, whether the NMR-restraints were used or not. This gives strong support to the presented peptide structure, whereas the calculations are made under quite different conditions. The backbone forms the typical minimal β-sheet, with one strand including R2, W3, and W4 and the other including R5, F6, and R1. The side chains appear to be more flexible than the NMR structure suggests. For example, the phenylalanine side chain is found to have two populated rotamers in the structure presented here, whereas in the NMR structure the phenylalanine side chain is always directed toward R5. Nevertheless, the strongly amphipathic structure is maintained with the hydrophilic part formed by the backbone and the arginine side chains and the hydrophobic part formed by the cluster of aromatic side chains.
TABLE 2.
RMSD values within separate simulations
| System | No. of frames | RMSD, backbone (Å) | RMSD, all heavy atoms (Å) | RMSD to NMR, all heavy atoms (Å)* | RMSD to NMR, backbone (Å)* |
|---|---|---|---|---|---|
| NMR† | 10 | 0.41 ± 0.13 | 1.94 ± 0.48 | — | — |
| 2:128‡ | 40 | 0.57 ± 0.057 | 2.98 ± 0.22 | 2.25 | 0.45 |
| 2:128§ | 160 | 0.57 ± 0.051 | 2.53 ± 0.40 | 1.97 | 0.44 |
| 12:128‡ | 96 | 0.60 ± 0.21 | 2.86 ± 0.62 | 2.00 | 0.43 |
| 12:128§ | 168 | 0.55 ± 0.21 | 2.83 ± 0.65 | 2.12 | 0.44 |
The RMSD to NMR refers to the deviation of average structures relative to the average NMR structure in DPC micelles, as shown in Fig. 4.
NMR structure bound to DPC micelle.
NMR-derived restraints used during the simulation.
Restraint-free simulation.
FIGURE 4.
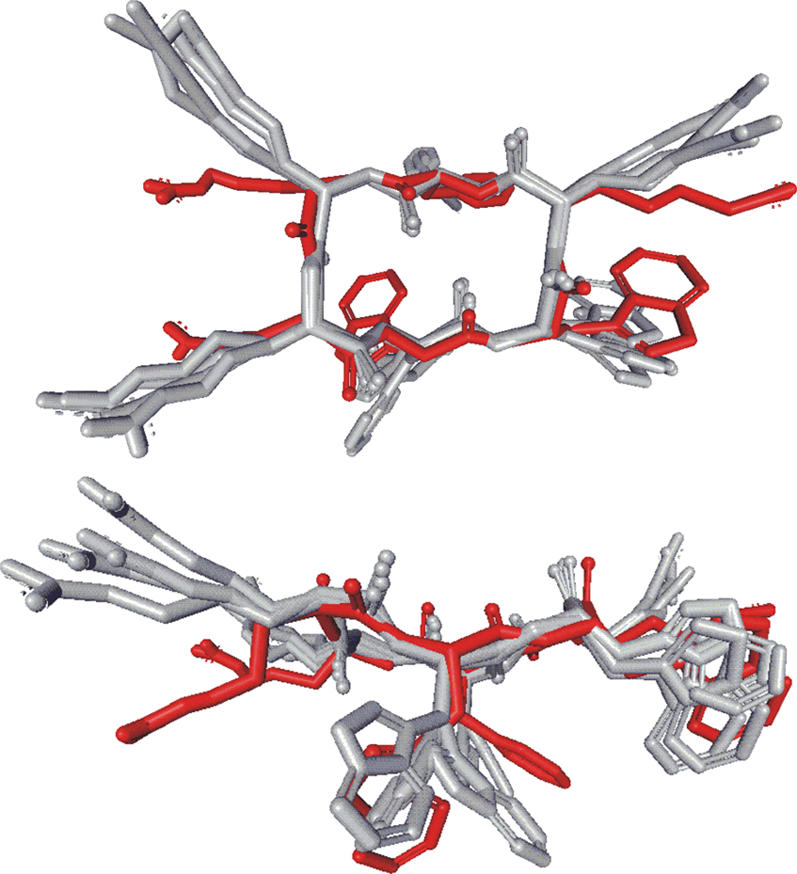
: Superposition of mean structures from NMR structure calculation (red) and from the restrained as well as unrestrained 12:128 system (gray). The RMSD values between the NMR structure and the simulated structures are listed in Table 2.
Since the structures obtained in the restrained and the unrestrained simulations are almost identical to the NMR structure (Table 2 and Fig. 4), the peptide conformation is stabilized by the interaction with the bilayer and not exclusively induced by restraints. An ensemble superposition of structures gives the effective shape of the peptide, acting on the membrane. In Fig. 5, 108 structure snapshots of the 12 peptides distributed over the entire unrestrained 12:128 trajectory have been superimposed. The effective shape of the peptide is almost a half-sphere, with the hydrophilic, flat surface facing the water and the spherical, hydrophobic side facing the membrane interior. The angles between the peptide-plane normal and membrane-plane normal in the 2:128 system were 20 ± 8° and 15 ± 7° for the two peptides, where R1 and R2 are more exposed to water than W4 and R5 in the other end of the small β-sheet, which is in good agreement with the NMR results (22). This is explained by the fact that the R1 and R2 end is more hydrophilic than the W4 and R5 end, as seen in Fig. 5.
FIGURE 5.

Ensemble of peptide structures from the unrestrained 12:128 simulation. The surface representations (upper panels) are calculated using the entire ensemble (lower panels), giving an almost hemispherical shape. Red represents negative electrostatic potential, blue represents positive, and white represents a noncharged surface. The hydrophilic side (panels at left) of the peptide has distinct positive (guanidino groups) and negative (backbone) electrostatic parts, whereas the hydrophobic side is much less polar (panels at right).
Density profiles
The atom densities along the membrane normal give a rough picture of how different groups in the system are distributed. In Fig. 6, the densities from the three systems are depicted. By using this representation, the membrane may be divided into four regions (35,36): 1), the perturbed-water region, where water molecules show an orientational preference; 2), the membrane-water interface, ranging from the region where the water and the lipids have equal densities to the region where water density approaches zero; 3), the ordered-tails region, where the density of the lipid tails reaches its maximum; and 4), the disordered-tails region, where the lipid tail density approaches its minimum. The peptides are positioned in the membrane-water interface and in the ordered-tails region as shown in Fig. 6. The orientation of the peptide, as suggested by the NMR results, is confirmed during the simulation. The peptides in the 12:128 system insert spontaneously with approximately the same depth and orientation as in the prepositioned 2:128 system. The cluster of aromatic side chains is deeper inserted in the bilayer than the backbone and the arginine side chains. The indole group reaches its free-energy minimum level at ∼1 nm from the membrane midplane (11), which is reached when the tryptophan side chains are deeply inserted in the membrane. The “snorkeling” (37) arginine side chains are oriented slightly upward. In this way the guanidino moieties can make polar interactions to the lipid headgroups whereas the aliphatic parts of the side chains are located closer to the more hydrophobic ordered-tails region. This snorkeling effect is more pronounced for 12:128 simulation and can be explained by a different hydrogen bonding scheme, as discussed below.
FIGURE 6.

Density along the membrane normal for the three systems simulated at 323 K: 0:128, red line; 2:128, green line; and 12:128, blue line. (a) water; (b) lipid headgroup; (c) glycerol; (d) acyl tails; (e) arginine amino acids in the peptide; (f) tryptophan and phenylalanine amino acids in the peptide; and (g) free-energy barrier for water. Error bars (indicating standard deviations) are only displayed for the 0:128 and 12:128 systems, for clarity. The inset is a magnification of the barrier peaks. The membrane is grouped into four different regions: i, perturbed water region; ii, membrane-water interface; iii, ordered-tails region; and iv, disordered-tails region.
Water barrier
The water penetration free-energy barrier is significantly affected by the presence of the peptide. The free-energy barrier is calculated by
 |
where  is the water density along the membrane normal obtained from the simulations and kT is the Boltzmann constant times the simulation temperature. In Fig. 6, the barriers from the simulations are shown. As seen in the figure, the error increases close to the membrane midplane. This is due to the fact that the water density in the membrane core is very low. During the entire simulation, we observe only very few water passages. In the 0:128 system, the plateau lies at 27.9 ± 1.8 kJ/mol, which can be compared to the previously reported value of 26 kJ/mol (35). For the 12:128 system the barrier is at 28.7 ± 1.7 kJ/mol, which is essentially the same as the 0:128 system; however, there is no plateau but rather a peak, and the shape of the barrier has changed significantly. In the presence of the c-RW peptides, the water molecules penetrate further into the hydrophobic core than is possible in the 0:128 system. The barrier at 20 kJ/mol is ∼0.5 nm thinner in the 12:128 system compared to the 0:128 system. The water barrier in the 2:128 is actually almost 0.1 nm thicker than the 0:128 system at 20 kJ/mol; however, this barely significant thickening effect has its origin in the general thickening of the membrane, as will be discussed below.
Membrane area
The total membrane area is a sensitive diagnosis for the force balance within the membrane (31). The literature value for DPPC lipid area varies, but a reasonable estimate is 0.64 nm2 (38). The values we have determined for the 0:128 and 0:64 systems agree well with this value. Since we add peptides to the surface, we expect to see an increase in the total membrane area. A rough estimate of the peptide area projected onto the membrane is at least 2 times the area of a lipid molecule, or 1.4 nm2. If the area was simply additive, we would thus expect an area increase of ∼3% and 18% in the 2:128 and 12:128 systems, respectively. However, as presented in Table 1, this is not the case. The area increase is insignificant for the 2:128 system and only 5% for the 12:128 system. It is therefore clear that the lipids get more packed in the presence of peptides. In Table 1, the lipid area is listed, under the assumption that each peptide occupies 1.4 nm2.
Deuterium order parameters
Deuterium order parameters, SCD, measure the order of the lipid tails (36,39). Close to the lipid headgroups, the order is quite high, meaning that the tails are mutually aligned, whereas deeper in the core of the membrane, the order parameters decrease and in the midplane they assume almost isotropical values. In the presence of the c-RW peptide, the order gets slightly, but still statistically significantly, higher in the ordered-tails region, as shown in Fig. 7. At first, this might seem counterintuitive, but considering the fact that the system is more closely packed, as observed in the membrane area (see Table 1), the only option for the lipid tails is to pack and align tighter to the adjacent lipid tails. Only the first eight to nine methylene groups in the tails are significantly affected by the packing, whereas the inner part of the membrane is unaffected. Since the simulation temperature of 323 K is close to the Tm of DPPC at 314.6 K, we also performed simulations at 353 K. The increased simulation temperature affected the 0:128 system and 12:128 in a coherent manner. In both systems the order parameters decreased by ∼0.1 units. This indicates that the increased order parameter in the presence of the peptide is a generally valid result, and is not caused by inducing a shift in the Tm.
FIGURE 7.

Deuterium order parameter of the corresponding DPPC acyl carbon atoms. Solid lines, 0:128; dotted line, 2:128; and dashed lines, 12:128. The nonbulleted lines are derived from the 323 K simulation and the bulleted lines are from the 353 K simulations. An increase of the order parameter of ∼0.01 is observed for the 2:128 and the 12:128 simulations for the acyl chain atoms C2 to C9 at 323 K. Acyl chain atoms C2 to C15 are gradually less affected. A similar order increase is observed at a temperature of 353 K, demonstrating that the increased order parameter is not an artifact of simulating close to the Tm at 314.6 K.
Spatial organization of peptides, lipids, and water
To get a statistical view of the lipid organization and topology in the vicinity of a peptide, the 2:128 system was analyzed using the special tool described in the Methods section. In Fig. 8 the population of lipids around the peptide is shown. Both peptides arrest up to eight lipid molecules in their close vicinity. For the coordination of the lipid headgroups one guanidino moiety in the arginine side chain binds up to three lipid molecules. Also at W4, there is an increased lipid population. It is worth noting that within these aggregates the lipids are confined to distinct positions, and thus interact specifically with the peptides rather than forming a layer of unspecifically bound lipids. In Table 3 the hydrogen bond distribution between peptides, lipids, and water is summarized. The arginine side chains account for the majority of the hydrogen bonds formed by the peptide. In the 2:128 simulation, most hydrogen bonds are formed to the DPPC acyl ester oxygen (the oxygen of glycerol and the acyl chain) and the oxygen of the phosphate. An example of such a complex arginine-lipid complex is shown in Fig. 9. It is worth noting that the geometry allows the formation of two hydrogen bonds between guanidino group and lipid, thereby increasing the stability of the complex. At increased peptide concentration (the 12:128 system) the ability to form hydrogen bonds to the acyl ester is decreased. These are partially compensated by hydrogen bonding to water. Nevertheless, the overall number of hydrogen bonds formed by the peptide was slightly decreased. The number of inter- and intramolecular peptide-peptide hydrogen bonds was 1.5 in both the 2:128 and 12:128 simulations. Due to the large amount of guanidino groups as interaction partners in the 12:128 system the lipids showed a significant loss of hydration, as can be seen by the decrease in the total number of hydrogen bonds.
FIGURE 8.

Distribution of lipids around the two peptides of the 2:128 simulation. The gray and red background shows the population histogram of the CG2 of the DPPC during 80 ns of simulation based on 8000 frames. Red areas correspond to >500 counts per Å2, i.e., “lipid-rich” regions. The conformations of the peptides are the minimized average structures. The curves lining each amino acid are isopopulation curves from histograms, counting the position of each amino acid during the simulation. The area outside the boundaries is visited <500 times during the entire simulation. Arginines are surrounded by blue lines, tryptophans by black lines, and the phenylalanine by a green line. Note that the guanidino functions in the arginine side chains are surrounded by ∼3 lipids each. Both peptides also have a lipid bound between W3 and W4. The figure was prepared using OpenDX.
TABLE 3.
Number of hydrogen bonds between lipids and water, and between peptides and water
| Acyl ester oxygen | Phosphate oxygen | Water | Total | ||
|---|---|---|---|---|---|
| 0:128 system | Water* | 2.4 ± 0.1 | 3.8 ± 0.1 | — | — |
| 2:128 system | Peptide† | 8.4 ± 1.4 | 5.6 ± 1.2 | 2.7 ± 0.9 | 16.7 ± 1.5 |
| Arginine side chains† | 6.0 ± 1.3 | 5.2 ± 1.3 | 1.2 ± 0.9 | 12.4 ± 1.2 | |
| Water* | 2.3 ± 0.1 | 3.7 ± 0.1 | — | — | |
| 12:128 system | Peptide† | 4.8 ± 0.4 | 6.7 ± 0.5 | 4.0 ± 0.7 | 15.5 ± 0.5 |
| Arginine side chains† | 3.2 ± 0.4 | 5.6 ± 0.5 | 2.8 ± 0.5 | 11.6 ± 0.5 | |
| Water* | 2.0 ± 0.1 | 3.2 ± 0.1 | — | — |
H-bonds calculated per lipid.
H-bonds calculated per peptide.
FIGURE 9.
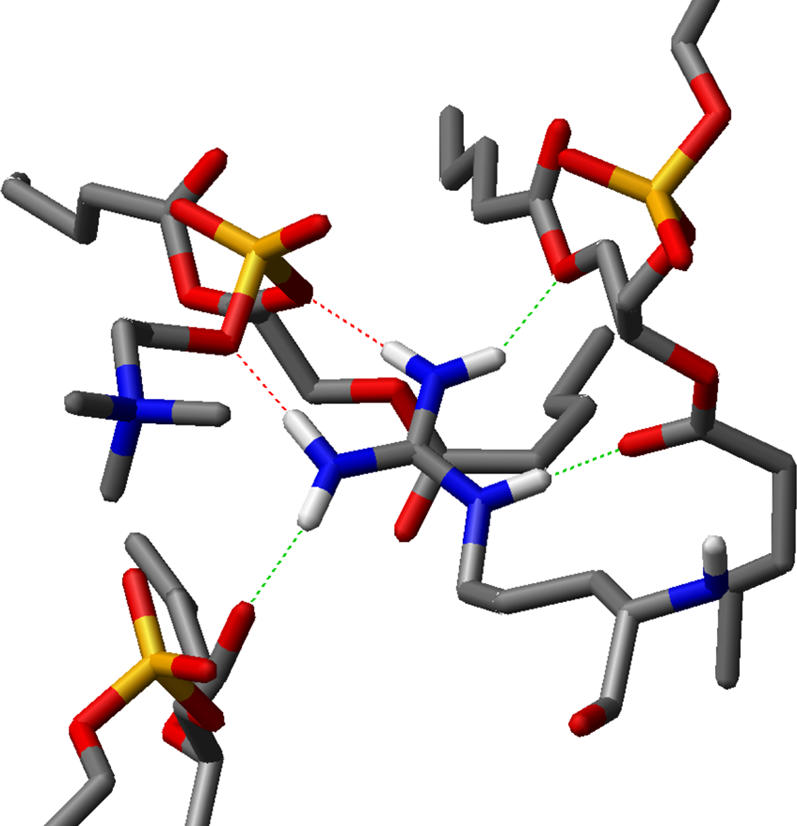
Binding of an arginine side chain to three lipid molecules. The snapshot was taken from an R2 of the 2:128 system. The red dotted lines resemble H-bonds to the phosphate and the green dotted lines are H-bonds to the acyl ester oxygen. The acyl chains have been truncated for clarity. Note that lipid molecules can be bound by two H-bonds, increasing the stability of the complex.
Another population analysis describes the void that is formed by the peptide in the lipid bilayer. The population of individual lipid acyl chain carbons around the peptide is plotted in Fig. 10. The acyl carbons close to the lipid headgroups are displaced from the center of the coordinate system, meaning that they are not able to enter the area below or above the peptide. The presence of the peptide obviously creates a void in the membrane surface stretching down to at least atom C8 in the acyl tails. Given the reduced effective area per lipid, this means that the membrane is unusually compressed to this point. In contrast, the carbons toward the end of the acyl chain are found below the peptide. They can occupy a close to normal area and are thus less affected by the peptide insertion. The result is an increased density difference between the ordered-tails region and disordered-tails region.
FIGURE 10.

Cavity in the bilayer formed by the peptide. The average (of all frames in the 2:128 simulation) of the z′ coordinate of the outermost lipid atom in each grid cell (size 1 Å) has been calculated, and is shown as the gray and red surface. The colors of the surface represent the z′ value. In the upper panel, the membrane is seen from above. The isopopulation lines show the distribution of the C4-C′4 (green), C6-C′6 (blue), and C8-C′8 (black) acyl chain carbons. The inside of the isopopulation lines is occupied <100 times by the corresponding atoms. This demonstrates that down to carbon C8-C′8 the lipid packing is affected, creating a cavity in the hydrophobic core. In the lower panel the side view of the surface is shown. For clarity, the peptide is displaced along the z' axis, with respect to the landscape. To get the correct relative position of lipid and peptide moieties along the z axis, see Fig. 4. The figure was prepared using OpenDX.
Lateral diffusion
The lateral diffusion coefficient, D, is significantly decreased in the presence of the c-RW peptide. D was measured by a standard procedure where the slope of a line fitted to the mean-square displacement of the molecule of interest, gives D for the time window used in the line fitting. The trajectories were corrected for the random relative motion of the center of mass of each monolayer (31) before evaluation. The results are listed in Table 1. The diffusion coefficient of lipids in bilayer systems are dependent on the observed timescale (40), but the values obtained for the 0:128 system (timescale, 1–3 ns) agree reasonably well with experimental measurements on shorter timescales (41). However, the diffusion of the lipids in the 12:128 system is reduced to  The lipid diffusion in the 2:128 system is marginally affected. Interestingly, the lateral diffusion of the c-RW peptide is almost constant irrespective of the peptide/lipid ratio, suggesting that peptide-lipid aggregates with similar diffusion properties are formed. These aggregates have been discussed and are shown in Fig. 8.
DISCUSSION
The initial structure of the c-RW peptide was well conserved throughout all the long simulations and under all tested conditions. The characteristic β-sheet, the amphipathic structure, and the mode of insertion remained stable. This demonstrates clearly that the NMR data derived from micelle systems are also valid for lipid bilayers. Further support comes from CD spectroscopy, in which almost identical spectra were found for the peptide bound to sodium dodecyl sulfate micelles and to POPC bilayers (20). This suggests that the conformation and orientation of the peptide is identical in bilayers and in micelles. Based on this good agreement of experimental and theoretical data, the simulation series presented herein is well suited to draw further conclusions on how this antimicrobial peptide exerts its function.
The peptides were located exclusively in the membrane-water interface and the ordered-tails region (35). The cationic guanidino moieties of the arginines were located at the glycerol groups of the lipids, and the hydrophobic tryptophan and phenylalanine side chains were located in the ordered-tails region. The position of positive charges on the membrane surface, on the one hand, and bulky amphiphilic and hydrophobic groups in the membrane-water interface and ordered-tails regions, on the other, alters general membrane properties in the following two distinct ways.
Cations at the interface
Recently, an investigation of the influence of sodium ions on fundamental membrane properties has been reported (42). The sodium ions accumulated at approximately the same position as the arginine side chains and affected the bilayer similarly; the effective lipid area decreases remarkably, the deuterium order parameters increase, and the membrane grows slightly thicker. According to Böckmann and co-workers, this is all due to the same effect; repulsion of the cations bound at both membrane surfaces. The cations on both sides are separated by the hydrophobic core, having a low dielectric constant; therefore, the repulsion is not shielded. The anionic chloride ions are dispersed in the water solution outside the membrane and do not provide any electrostatic screening. When both sides of the membrane are repulsed, the lipids are stretched out, causing a thicker membrane and increased order parameters, and they grow thinner, resulting in a decreased lipid area. Moreover, Böckmann and co-workers also found that one sodium ion is coordinated by three lipid carbonyl oxygen atoms. This complex formation around the sodium ion with up to three lipid molecules led to a decrease in lateral diffusion coefficient of the lipids, although not as dramatic as the decrease in diffusion caused by the c-RW peptide reported here. The lipids were arrested at well-defined positions mainly around the arginine side chains of the peptide, suggesting that the complex formation was mediated by hydrogen bonds. The peptide c-KW is less biologically active despite comparable structure, charge, and amphpathicity (20), probably because lysine side chains possess only three hydrogen bond donors, whereas arginine has five hydrogen bond donors. Therefore lysine is less favorable for the complex formation with lipids, which obviously has some impact on the biological activity. However, this leads us to the second effect that c-RW has on the structure of the membrane.
Impact of the amphipathic molecule
During the simulation we observed the formation of a cavity in the ordered-tails region caused by insertion of the aromatic residues in the hydrophobic core. The cavity influences the tails approximately down to C8, as seen in Fig. 10. This is also reflected in the increase of the order parameters: atoms C2 to about C8 are significantly more ordered, whereas further down in the disordered-tails region the difference between the 0:128 system and the peptide-containing systems becomes marginal (see Fig. 7). The resulting compression of only the outer membrane region exerts a curvature strain that may drive the pore formation, which has been suggested before (4). Furthermore, the presence of the peptide decreases the contact between adjacent lipids, and therefore the forces that prevent lipids from protruding out of, or into, the membrane surface are decreased. This is reflected in the small broadening of the distribution of the phosphocholine and glycerol groups in the presence of the peptide (see Fig. 6). Although this effect seems marginal in the density, it has a profound impact on the water permeation barrier, which in the 12:128 simulation has lost >30% of its thickness compared to the 0:128 and 2:128 systems. This unusual occurrence of water deeper in the hydrophobic core in the presence of a tryptophan-containing peptide has been observed experimentally and the authors ascribe this either to the local disorder in the hydrophobic core or to water that is associated with the tryptophan (43). However, the arginines are responsible for most hydrogen bond formation by the peptide and thus a significant portion of the water is bound to guanidino moieties. In the 12:128 system, peptide-to-lipid hydrogen bonds were replaced by peptide-to-water hydrogen bonds. This shift could be due to a saturation of the membrane capacity to accommodate cationic charges and hydrogen bond donors. The increased water binding is accompanied by an increased snorkeling of the arginine side chains. Since the guanidino moieties have to compensate the lack of hydrogen bond acceptors they have to seek water. This has the effect that the arginine density shifts toward the water in the 12:128 system, compared to the 2:128 system, as seen in Fig. 6. Apparently, the aromatic side chains have the function to anchor the peptide deeply in the membrane interface, whereas the arginines are responsible for the attraction of hydrogen bond acceptors. When the membrane is saturated, water molecules are attracted.
Since the proton gradient barrier depends widely on its nonpermeability to water (44), the breakdown of the proton gradient across the bacterial membrane can be achieved in the absence of stable pores (3). Even though the maximum free energy for a water molecule crossing the membrane remains the same in all three systems, a considerable thinning of the barrier could lead to a drastic increase in proton leakage, which resembles an alternative way of dissipating the proton gradient independent of pore formation.
Another important observation in the simulation is the occurrence of peptide-lipid aggregates; ∼8 lipid molecules are bound to one peptide. In that way the majority of lipids are restricted in their movement in the 12:128 simulation, which causes a drastic decrease in the bilayer fluidity, as indicated by the lateral diffusion coefficient. Complex formation of lipids with antimicrobial peptides has been reported before (1,4). It is assumed that this is an important step in the formation of a “dynamic, peptide-lipid supramolecular complex pore” (1,4). It also has been suggested that an expanding membrane area and thinning of the outer leaflet results in strain of the bilayer, inducing pore formation (1). However, the effect observed in the presence of c-RW, thinning of the water permeation barrier, and the void formation induced by the peptide also induce a strain resulting in an unstable membrane. As pointed out previously, a membrane is planar as long as the membrane stabilizing forces are in balance (5,6). In the presence of water in the hydrophobic core, the formation of a cavity, and tight aggregation of the headgroups, this balance is shifted. The exact consequences of this balance shift and the stoichiometric composition of supramolecular peptide-lipid aggregates is strongly dependent on experimental conditions such as temperature, lipid type, pH, and salt concentration.
CONCLUSION
The simulations presented here, based on substantial experimental data, describe in atomic detail the interactions of the antimicrobial peptide c-RW with a lipid bilayer. The microscopical parameters that were derived indicated that fundamental properties such as fluidity and water penetration barrier were affected, pointing to how the peptide might exert its antimicrobial activity.
Acknowledgments
Margitta Dathe is acknowledged for discussions.
C.A. thanks the Fonds der chemischen Industrie for a Kekulé fellowship.
Abbreviations used: MD, molecular dynamics; DPPC, dipalmitoylphosphatidylcholine; c-RW, cyclo(RRWWRF); PG, phosphatidylglycerol; PC, phosphatidylcholine; POPC, palmitoyloleylphosphatidylcholine; RMSD, root mean-square deviation; DPC, dodecyl phosphocholine; D, lateral diffusion coefficient; SCD, deuterium order parameter; Tm, gel to liquid crystalline phase transition temperature.
References
- 1.Zasloff, M. 2002. Antimicrobial peptides of multicellular organisms. Nature. 415:389–395. [DOI] [PubMed] [Google Scholar]
- 2.Huang, H. W. 2000. Action of antimicrobial peptides: two-state model. Biochemistry. 39:8347–8352. [DOI] [PubMed] [Google Scholar]
- 3.Shai, Y. 2002. Mode of action of membrane active antimicrobial peptides. Biopolymers. 66:236–248. [DOI] [PubMed] [Google Scholar]
- 4.Matsuzaki, K. 1999. Why and how are peptide-lipid interactions utilized for self-defense? Magainins and tachyplesins as archetypes. Biochim. Biophys. Acta. 1462:1–10. [DOI] [PubMed] [Google Scholar]
- 5.Marsh, D. 1996. Lateral pressure in membranes. Biochim. Biophys. Acta. 1286:183–223. [DOI] [PubMed] [Google Scholar]
- 6.Lindahl, E., and O. Edholm. 2000. Spatial and energetic-entropic decomposition of surface tension in lipid bilayers from molecular dynamics simulations. J. Chem. Phys. 113:3882–3893. [Google Scholar]
- 7.Marchal, D., W. Boireau, J. M. Laval, J. Moiroux, and C. Bourdillon. 1998. Electrochemical measurement of lateral diffusion coefficients of ubiquinones and plastoquinones of various isoprenoid chain lengths incorporated in model bilayers. Biophys. J. 74:1937–1948. [DOI] [PMC free article] [PubMed] [Google Scholar]
- 8.Huang, W. N., S. C. Sue, D. S. Wang, P. L. Wu, and W. G. Wu. 2003. Peripheral binding mode and penetration depth of cobra cardiotoxin on phospholipid membranes as studied by a combined FTIR and computer simulation approach. Biochemistry. 42:7457–7466. [DOI] [PubMed] [Google Scholar]
- 9.Shepherd, C. M., H. J. Vogel, and D. P. Tieleman. 2003. Interactions of the designed antimicrobial peptide MB21 and truncated dermaseptin S3 with lipid bilayers: molecular-dynamics simulations. Biochem. J. 370:233–243. [DOI] [PMC free article] [PubMed] [Google Scholar]
- 10.Murzyn, K., and M. Pasenkiewicz-Gierula. 2003. Construction of a toroidal model for the magainin pore. J. Mol. Model. 9:217–224. [DOI] [PubMed] [Google Scholar]
- 11.Grossfield, A., and T. B. Woolf. 2002. Interaction of tryptophan analogs with POPC lipid bilayers investigated by molecular dynamics calculations. Langmuir. 18:198–210. [Google Scholar]
- 12.Tieleman, D. P., M. S. P. Sansom, and H. J. C. Berendsen. 1999. Alamethicin helices in a bilayer and in solution: molecular dynamics simulations. Biophys. J. 76:40–49. [DOI] [PMC free article] [PubMed] [Google Scholar]
- 13.La Rocca, P., P. C. Biggin, D. P. Tieleman, and M. S. P. Sansom. 1999. Simulation studies of the interaction of antimicrobial peptides and lipid bilayers. Biochim. Biophys. Acta. 1462:185–200. [DOI] [PubMed] [Google Scholar]
- 14.Biggin, P. C., and M. S. P. Sansom. 1999. Interactions of alpha-helices with lipid bilayers: a review of simulation studies. Biophys. Chem. 76:161–183. [DOI] [PubMed] [Google Scholar]
- 15.Saiz, L., S. Bandyopadhyay, and M. L. Klein. 2004. Effect of the pore region of a transmembrane ion channel on the physical properties of a simple membrane. J. Phys. Chem. B. 108:2608–2613. [Google Scholar]
- 16.Saiz, L., S. Bandyopadhyay, and M. L. Klein. 2002. Towards an understanding of complex biological membranes from atomistic molecular dynamics simulations. Biosci. Rep. 22:151–173. [DOI] [PubMed] [Google Scholar]
- 17.Söderhäll, J. A., and A. Laaksonen. 2001. Molecular dynamics simulations of ubiquinone inside a lipid bilayer. J. Phys. Chem. B. 105:9308–9315. [Google Scholar]
- 18.Tieleman, D. P., H. J. C. Berendsen, and M. S. P. Sansom. 1999. Surface binding of alamethicin stabilizes its helical structure: molecular dynamics simulations. Biophys. J. 76:3186–3191. [DOI] [PMC free article] [PubMed] [Google Scholar]
- 19.Jing, W., H. N. Hunter, J. Hagel, and H. J. Vogel. 2003. The structure of the antimicrobial peptide Ac-RRWWRF-NH2 bound to micelles and its interactions with phospholipid bilayers. J. Pept. Res. 61:219–229. [DOI] [PubMed] [Google Scholar]
- 20.Dathe, M., H. Nikolenko, J. Klose, and M. Bienert. 2004. Cyclization increases the antimicrobial activity and selectivity of arginine- and tryptophan-containing hexapeptides. Biochemistry. 43:9140–9150. [DOI] [PubMed] [Google Scholar]
- 21.Wessolowski, A., M. Bienert, and M. Dathe. 2004. Antimicrobial activity of arginine- and tryptophan-rich hexapeptides: the effects of aromatic clusters, D-amino acid substitution and cyclization. J. Pept. Res. 64:159–169. [DOI] [PubMed] [Google Scholar]
- 22.Appelt, C., A. Wessolowski, J. A. Söderhäll, M. Dathe, and P. Schmieder. 2005. Structure of the antimicrobial, cationic hexapeptide cyclo(RRWWRF) and its analogues in solution and bound to detergent micelles. Chembiochem. 6:1654–1662. [DOI] [PubMed] [Google Scholar]
- 23.Lindahl, E., B. Hess, and D. van der Spoel. 2001. GROMACS 3.0: a package for molecular simulation and trajectory analysis. J. Mol. Model. 7:306–317. [Google Scholar]
- 24.Berendsen, H. J. C., D. Vanderspoel, and R. Vandrunen. 1995. GROMACS—a message-passing parallel molecular-dynamics implementation. Comput. Phys. Commun. 91:43–56. [Google Scholar]
- 25.Tieleman, D. P., and H. J. C. Berendsen. 1996. Molecular dynamics simulations of a fully hydrated dipalmitoyl phosphatidylcholine bilayer with different macroscopic boundary conditions and parameters. J. Chem. Phys. 105:4871–4880. [Google Scholar]
- 26.Faraldo-Gomez, J. D., G. R. Smith, and M. S. P. Sansom. 2002. Setting up and optimization of membrane protein simulations. Eur. Biophys. J. 31:217–227. [DOI] [PubMed] [Google Scholar]
- 27.Berendsen, H. J. C., J. P. M. Postma, W. F. Van Gunsteren, A. Dinola, and J. R. Haak. 1984. Molecular-dynamics with coupling to an external bath. J. Chem. Phys. 81:3684–3690. [Google Scholar]
- 28.Essmann, U., L. Perera, M. L. Berkowitz, T. Darden, H. Lee, and L. G. Pedersen. 1995. A smooth particle mesh Ewald method. J. Chem. Phys. 103:8577–8593. [Google Scholar]
- 29.Hess, B., H. Bekker, H. J. C. Berendsen, and J. G. E. M. Fraaije. 1997. LINCS: a linear constraint solver for molecular simulations. J. Comput. Chem. 18:1463–1472. [Google Scholar]
- 30.Miyamoto, S., and P. A. Kollman. 1992. SETTLE—an analytical version of the SHAKE and RATTLE algorithm for rigid water models. J. Comput. Chem. 13:952–962. [Google Scholar]
- 31.Anezo, C., A. H. de Vries, H. D. Holtje, D. P. Tieleman, and S. J. Marrink. 2003. Methodological issues in lipid bilayer simulations. J. Phys. Chem. B. 107:9424–9433. [Google Scholar]
- 32.Berger, O., O. Edholm, and F. Jahnig. 1997. Molecular dynamics simulations of a fluid bilayer of dipalmitoylphosphatidylcholine at full hydration, constant pressure, and constant temperature. Biophys. J. 72:2002–2013. [DOI] [PMC free article] [PubMed] [Google Scholar]
- 33.van der Spoel, D., A. R. van Buuren, E. Apol, P. J. Meulenhoff, D. P. Tieleman, A. L. T. M. Sijbers, B. Hess, E. Feenstra, E. Lindahl, R. van Drunen, and H. J. Berendsen. 2001. GROMACS User Manual Version 3.1.1. Groningen, The Netherlands.
- 34.Berendsen, H. J., J. P. M. Postma, W. F. Van Gunsteren, and J. Hermans. 1981. Interaction models for water in relation to protein hydration. In Intermolecular Forces. D Reidel, Dordrecht, The Netherlands. 331–342.
- 35.Marrink, S. J., and H. J. C. Berendsen. 1994. Simulation of water transport through a lipid-membrane. J. Phys. Chem. 98:4155–4168. [Google Scholar]
- 36.Tieleman, D. P., S. J. Marrink, and H. J. Berendsen. 1997. A computer perspective of membranes: molecular dynamics studies of lipid bilayer systems. Biochim. Biophys. Acta. 1331:235–270. [DOI] [PubMed] [Google Scholar]
- 37.Killian, J. A., and G. von Heijne. 2000. How proteins adapt to a membrane-water interface. Trends Biochem. Sci. 25:429–434. [DOI] [PubMed] [Google Scholar]
- 38.Nagle, J. F., and S. Tristram-Nagle. 2000. Structure of lipid bilayers. Biochim. Biophys. Acta. 1469:159–195. [DOI] [PMC free article] [PubMed] [Google Scholar]
- 39.Douliez, J. P., A. Leonard, and E. J. Dufourc. 1995. Restatement of order parameters in biomembranes: calculation of C–C bond order parameters from C-D quadrupolar splittings. Biophys. J. 68:1727–1739. [DOI] [PMC free article] [PubMed] [Google Scholar]
- 40.Vaz, W. L., and P. F. Almeida. 1991. Microscopic versus macroscopic diffusion in one-component fluid phase lipid bilayer membranes. Biophys. J. 60:1553–1554. [DOI] [PMC free article] [PubMed] [Google Scholar]
- 41.Tabony, J., and B. Perly. 1991. Quasielastic neutron scattering measurements of fast local translational diffusion of lipid molecules in phospholipid bilayers. Biochim. Biophys. Acta. 1063:67–72. [DOI] [PubMed] [Google Scholar]
- 42.Böckmann, R. A., A. Hac, T. Heimburg, and H. Grubmuller. 2003. Effect of sodium chloride on a lipid bilayer. Biophys. J. 85:1647–1655. [DOI] [PMC free article] [PubMed] [Google Scholar]
- 43.Jacobs, R. E., and S. H. White. 1989. The nature of the hydrophobic binding of small peptides at the bilayer interface: implications for the insertion of transbilayer helices. Biochemistry. 28:3421–3437. [DOI] [PubMed] [Google Scholar]
- 44.Haines, T. H. 2001. Do sterols reduce proton and sodium leaks through lipid bilayers? Prog. Lipid Res. 40:299–324. [DOI] [PubMed] [Google Scholar]