Abstract
Many arrhythmias are believed to be triggered by ectopic sources arising from the border of the ischemic tissue. However, the development of ectopic activity from individual sources to a larger mass of cardiac tissue remains poorly understood. To address this critical issue, we used monolayers of neonatal rat cardiomyocytes to create conditions that promoted progression of ectopic activity from single cells to the network that consisted of hundreds of cells. To explain complex spatiotemporal patterns observed in these experiments we introduced a new theoretical framework. The framework's main feature is a parameter space diagram, which uses cell automaticity and coupling as two coordinates. The diagram allows one to depict network behavior, quantitatively address the heterogeneity factor, and evaluate transitions between different regimes. The well-organized wave trains were observed at moderate and high cell coupling values and network heterogeneity was found to be qualitatively unimportant for these regimes. In contrast, at lower values of coupling, spontaneous ectopic activity led to the appearance of fragmented ectopic waves. For these regimes, network heterogeneity played an essential role. The ectopic waves occasionally gave rise to spiral activity in two different regions within the parameter space via two distinct mechanisms. Together, our results suggest that localized ectopic waves represent an essential step in the progression of ectopic activity. These studies add to the understanding of initiation and progression of arrhythmias and can be applied to other phenomena that deal with assemblies of coupled oscillators.
INTRODUCTION
The common scenario for sudden cardiac death syndrome is an episode of ventricular fibrillation, followed by a circulatory collapse. In most cases, ventricular fibrillation progresses from a ventricular tachycardia, which is a direct result of ischemia due to a transient block of a coronary vessel. Numerous studies have been aimed at understanding how local ischemia and/or subsequent reperfusion transforms ventricular cells into a source of ectopic beats (notably, we focus on a subset of arrhythmias called ectopic, and do not address here the anatomical or functional obstacles leading to reentry formation). The majority of these studies have been aimed at important elementary events both on the cellular and subcellular level. Indeed, a wealth of information regarding the effect of the ischemic environment and/or its reperfusion on individual ionic channels, metabolic activity, or ion concentrations is now available (1). However, even if one fully understands the changes that occur on the individual cell level, there is another set of questions to be addressed at the network level. Specifically, we refer to the fact that myocytes function within both an outer and inner network of surrounding cells. By outer, we mean a large mass of continuously paced healthy tissue that surrounds the ischemic area. By the inner, we mean a small part of the ventricular or atrial tissue, exposed to a continuously changing environment as ischemia progresses or reperfusion process is initiated. Notably, both inner and outer networks consist of an intrinsically heterogeneous network of interconnected cells.
To start addressing these complex issues we developed an experimental model in which a small region of a cardiomyocyte network called the I-zone is subjected to an ischemia-like environment. The area within the I-zone thus serves as an inner network and cells in the surrounding C-zone take the role of the outer or the control environment (2). We have conducted a series of studies in which we verified the ability of the ischemic environment or adrenergic stimulation to elicit arrhythmogenic response in these preparations (3). Moreover, we have observed that the generation of ectopic arrhythmias is associated with a transition of ectopic activity from individual cells to slowly propagating ectopic waves. These ectopic waves encompass a large number of cells (from tens to hundreds), but remain confined to the local area of injury.
The fact that a similar process of developing ectopic waves was observed in different experimental conditions, including ones that mimicked reperfusion and release of β-adrenergic agonists, led us to conclude that factors governing such behavior are of a general nature. Specifically, we hypothesized that overall network behavior, including ectopic waves, can be described by three macroscopic factors. These are: 1), rate of spontaneous cell depolarization of individual network elements (the term automaticity will be used thereafter); 2), cell-to cell coupling; and 3), heterogeneity of network elements. This article provides direct experimental evidence that concurrent alterations of cell automaticity and coupling in heterogeneous cell network lead to conditions associated with ectopic waves. The experimental findings are then explained and expanded by simulations using the Beeler-Reuter model of cardiac cell and by general theoretical analysis.
MATERIALS AND METHODS
Experimental protocols
Cardiomyocytes from two-day-old Sprague-Dawley rats were obtained using an enzymatic digestion procedure (4) in accordance with the guidelines of the institutional Animal Care and Use Committee. A custom-made experimental chamber, which allows one to perfuse a small area of cell network with a solution of interest (I-zone) while monitoring both control and the affected areas, was described earlier (2). Each spontaneous or paced action potential was associated with a calcium transient (CaT), measured as Fluo-4 signal. Experiments were conducted using a BioRad MRC-1024 confocal imaging system (Hercules, CA). Low-power magnification objective (Olympus PlanApo 4×/0.16 NA, Melville, NY) was used to capture the injury and control zones simultaneously. Experiments were conducted at room temperature. Each of the protocols was conducted at least seven times. Presented figures and graphs are typical results of corresponding scenarios.
Modeling studies
Our numerical work rests on the Beeler-Reuter model of a cardiac myocyte (5). The model describes the state of a cell by the variable e, representing the membrane potential
 |
(1) |
where e is the membrane potential of the cell; C the capacitance per area of membrane; INa the fast depolarizing sodium current; Isl is the slow depolarizing current, carried mostly by calcium; and Ix1 and IK1 are the two repolarizing potassium currents. These currents depend on the membrane potential, the calcium concentration, and six gating variables.
We consider an idealized situation, where cells are located on a rectangular lattice, so the variables are labeled by two integers—i and j labeling the rows and columns of the lattice. Cells are coupled to their nearest neighbors,
 |
(2) |
where D, the diffusion coefficient, is proportional to the conductivity between cells, and l is the distance between cells. The value of l is set at 30 μm to account for the mean spacing between the centers of two adjacent cells, an estimate from experimental preparations. Velocity of propagation in isotropic cardiomyocyte networks is ∼10 cm/s, which corresponds to a diffusion coefficient on the order of D = 0.10 cm2/s (6).
To make cells spontaneously active we alter the balance between inward and outward currents by multiplying the IK1 in Eq. 1 by a factor A, A < 1. By varying the parameter A, we find that an individual cell spontaneously oscillates, provided the value of A is smaller than a critical value, Acrit. When A approaches Acrit from below, the amplitude of the oscillation remains the same, while the period Tosc of the oscillation diverges logarithmically: Tosc ∼ ln(Acrit − A), A ≤ Acrit. This indicates that the change from oscillatory to excitable but quiescent behavior occurs through a homoclinic bifurcation (7). For chosen values of sodium and potassium conductance (8) we found that the critical value is Acrit = 0.1606.
To model heterogeneous network behavior, each cell was assigned a different value of A. Specifically, we write the coefficient A as A = A0 − α(i; j), where parameter A0 is arbitrarily set at a value 0.3 and α(i; j) is a Gaussian, spatially uncorrelated random variable, with a mean value 〈α〉, and a standard deviation δα. The parameter α thus reflects the degree of IK1 inhibition starting from 30% of the initial IK1 value (specifically (0.3 − α) IK1). Although arbitrary, this maneuver allowed us to work closer to the values where oscillatory behavior is observed while employing simple δα/〈α〉 ratios. By setting initial values of IK1 at 30%, one also mimics smaller IK1 values reported for neonatal cardiomyocytes (9,10) as compared to the parameters used by Beeler and Reuter for adult ventricular cells (5).
The results presented here correspond to a network consisting of two rectangular regions next to each other. The control lattice consisted of 10 × 20 = 200 cells (C-zone) in which values for the diffusion coefficient D and IK1 remain unchanged and equal to the control values (100% of IK1 and D = 0.1 cm2/s). In the I-zone (30 × 20 = 600 cells) the diffusion coefficient was diminished and IK1 was inhibited as described above.
The system was studied numerically, using a finite difference method. We used either a Crank-Nicholson or a second-order Runge-Kutta scheme (11). These schemes are second-order in space and time. The quality of the time integration was checked by systematically studying the effect of the timestep size. We have generated both x,y and x,t frames with a grayscale reflecting the internal calcium concentrations (black being highest) to compare our numerical results with experiments in which CaT were recorded. Plotting events using membrane potential instead of calcium concentrations provided conceptually identical results as illustrated in Fig. 8.
FIGURE 8.
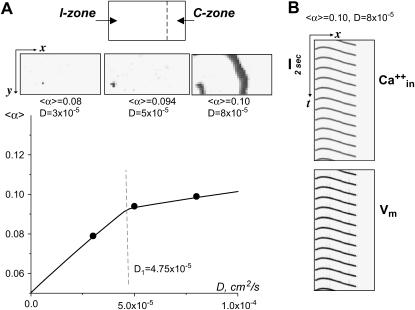
Appearance of activity above the transition curve. (A) The diagram on the top shows the relative position of the I- and C-zones. Below the diagram, one finds a row of three representative x,y frames. They illustrate the events that took place when the I-zone network was given 〈α〉 and D values shown on the parameter space diagram by three black dots (see graph below). (Left x,y frame) For a small value of D (D = 3 × 10⁻⁵), only a few individual cells are firing. (Middle x,y frame) For intermediate values of D (D = 5 × 10⁻⁵), the activity encompasses several cells close to a single ectopic center. (Right x,y frame) For a larger D (D = 8 × 10⁻⁵), the ectopic waves spread throughout an entire region. Note that this figure illustrates processes just above the transition curve. The network behavior at higher values of 〈α〉 is considered next. (B) The x,t scans show behavior of the system at D = 8 × 10⁻⁵, 〈α〉 = 0.10 using both CaT and Vm. Note that the wave activity remains confined to the I-zone, with the C-zone remaining silent.
RESULTS
This section consists of three parts. Experimental Studies presents experiments illustrating network behavior associated with simultaneous alteration of automaticity and coupling in neonatal cardiomyocyte cultures. Numerical Studies describes our numerical studies using Beeler-Reuter formalism. It is organized around a parameter space diagram, showing the possible dynamic regimes observed in the model as a function of α, which relates to the rate of spontaneous cell depolarization, and of the diffusion coefficient, D. Of particular interest here are the transitions between these states. In Theoretical Aspects and its Appendices, we analyze, from a theoretical point of view, transitions between the quiescent state of the network and the spontaneously oscillating states, and address the effect of the network size. We also discuss the transition between the low coupling case, which is the main emphasis of this work, and the well-studied high coupling limit, which leads to cells' synchronization.
Experimental studies
To recreate conditions favoring ectopic waves in vivo, we employed preparations of neonatal cardiomyocytes. These preparations, although different in some aspects from adult heart tissue, have been successfully used to unravel fundamental properties of impulse conduction in cardiac tissue (reviewed in Kleber and Rudy (12)).
Increasing automaticity using barium
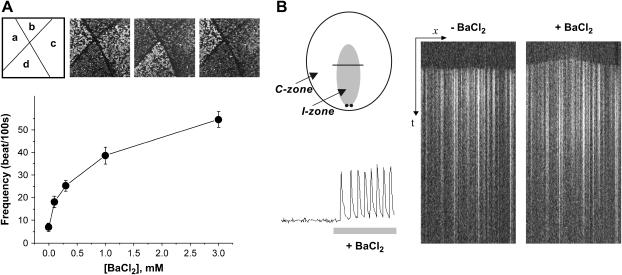
Rate of spontaneous depolarization was increased by inhibiting the inward rectifier potassium current (IK1) using low concentrations of barium (13,14). The Ik1 is abundant in both ventricular and atrial cells and effectively clamps membrane potential to its resting values. Its inhibition allows background inward currents to depolarize the cell membrane during the resting state, leading to or enhancing cell automaticity (15). Application of submillimolar BaCl2 concentrations led to an immediate increase in the frequency of spontaneous cell firing as illustrated in Fig. 1 A. To obtain the concentration curve shown in Fig. 1 A, the network was partitioned into ∼4 mm2 squares, and designated BaCl2 concentrations were applied to the partitioned cell layer. Frequency of four partitioned and therefore independently beating areas was recorded to get an average frequency. Response to the application of BaCl2 was almost immediate (2–5 s) and fully reversible.
FIGURE 1.
Effect of BaCl2 on frequency and spatiotemporal pattern of activity. (A) Upper panel depicts the appearance of four partitioned areas that beat independently. Each beat is initiated by an action potential and is associated with Ca-transient (CaT). Presence of Fluo-4 inside the cells results in a brighter field during CaT propagation. No external pacing was used in these experiments. (B) The diagram on the top left depicts the position and shapes of the I- and C-zones. It also shows position of the line used to obtain the x,t scans shown on the right. When a quiescent cell layer is paced (the position of the stimulating electrodes relative to the I-zone used for this figure is shown by a pair of black dots), an x,t scan shows all cells exhibiting CaT along the line at the same time. When barium is applied it shifts pacemaker activity to the I-zone, resulting in a domelike appearance of the x,t signal. The CaT trace on the left illustrates an increased frequency of CaT upon BaCl2 administration.
For application of barium to inner network only, we used the local injury chamber described in our previous studies (2,16). Application of BaCl2 to the I-zone shifted the pacemaker activity into the I-zone and increased the monolayer firing frequency (Fig. 1 B).
Decreasing cell-to-cell coupling by gap-junctional inhibitor Heptanol
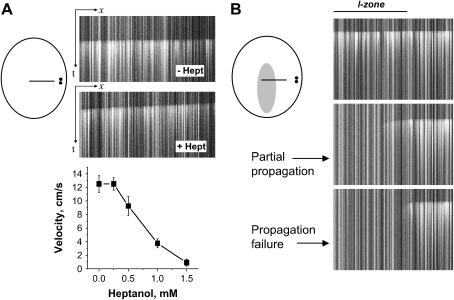
Fig. 2 A illustrates the effect of increasing Heptanol concentrations on the velocity of wave propagation. It took 15–20 s for uncoupling effects of Heptanol to develop. It was fully reversible, in agreement with previous studies by us and others (3,17). When Heptanol concentrations exceeded 2 mM, even elevated voltage on pacing electrodes failed to elicit a propagating front. Notably, at very high concentrations Heptanol was shown to inhibit INa (18), which might reduce cell excitability and contribute to propagation failure.
FIGURE 2.
Effect of Heptanol on propagation velocity and the spatiotemporal pattern of activity. (A) Upper panel shows the appearance of the x,t scans used to quantify the effects of Heptanol on velocity of conduction. When the concentration of Heptanol exceeded 2 mM, pacing failed to initiate a propagating CaT wave. Relative position of the stimulating electrodes and the line used for x,t images is shown on the diagram on the left. (B) The diagram on the left depicts the position and shapes of the I- and C-zones. It also shows the position of the line used to obtain x,t scans shown on the right. Stimulating electrodes are depicted as a pair of black dots. When Heptanol was applied to the I-zone it lead to a partial (1.5–2 mM Heptanol, middle image) or complete (>2 mM Heptanol, bottom image) block of conduction.
Local application of Heptanol to the I-zone only either slowed (0.5–1.5 mM) or completely prevented (>2 mM) penetration of the external activity into the I-zone (Fig. 2 B). Upon uncoupler wash-out the control propagation pattern was gradually restored without incidence of arrhythmias.
Local application of BaCl2 together with gap junctional uncoupler
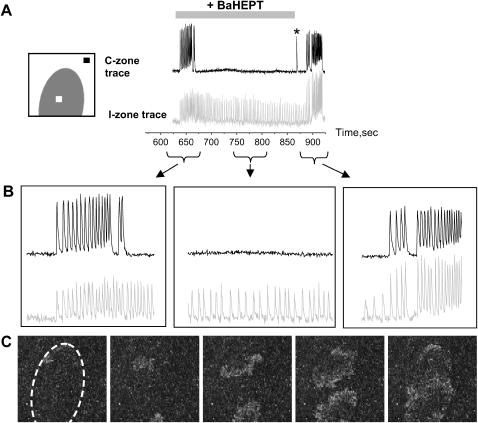
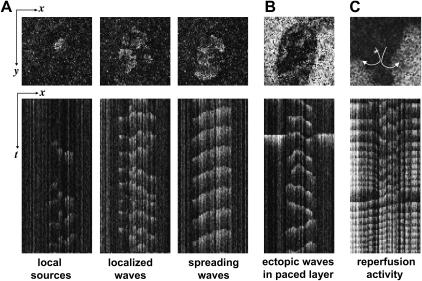
Application of BaCl2 (0.1–1 mM) to the I-zone in combination with the Heptanol (1.5–4 mM) led to altered wave propagation patterns in both I-zone and the control area. Typical behavior observed during local application of 0.1 mM BaCl2 and 2 mM Heptanol can be seen in Fig. 3 (note that experiments presented in Figs. 3 and 4 A were conducted in quiescent cell monolayers in the absence of external pacing). For the first 10 seconds the center of activity shifts into the I-zone similar to the application of BaCl2 alone (Fig. 1 B). However, as Heptanol starts to affect gap junctional conductance, the spatiotemporal pattern changes. Specifically, an independent pattern of wave propagation develops within the I-zone, while activity in the control network returns to a quiescent state (Fig. 3 B, middle panel). I-zone activity is associated with slowly propagating local waves. Visually these patterns range from individual ectopic sources (clusters of 3–10 cells) to localized waves encompassing 10–100 cells and finally spreading ectopic waves that propagate through an entire I-zone area (Figs. 3 C and 4, A and B, and Supplementary Materials, Video Supplement I). Changing patterns of activity included spontaneous formation of spirals (as shown in Supplementary Materials, Video Supplement II).
FIGURE 3.
Effect of BaCl2-Heptanol application to the I-zone. (A) Diagram on the left depicts position of the I- and C-zones, and regions of interest used to acquire traces on the right. The shaded trace illustrates continuous activity within I-zone during the entire period of BaCl2-Heptanol application and its wash-out. In contrast, the only two periods when activity was present in the C-zone are the wash-in and wash-out of the BaHept. During BaCl2-Heptanol application itself, no activity is recorded in the C-zone with the exception of the occasional single beats (marked by an asterisk), associated with intrinsic low-frequency spontaneous activity of the layer. (B) Extended traces from the figure above. Periods associated with wash-in, continuous application and wash-out of BaCl2-Heptanol are shown. (C) Appearance of the events in x,y mode during BaCl2-Heptanol application. The dotted oval shows the position of the I-zone. This sample sequence of five frames shows two colliding ectopic waves. The changing pattern of propagating ectopic waves remained confined to the I-zone until wash-out of BaCl2-Heptanol application was initiated.
FIGURE 4.
Spatiotemporal patterns of activity within the I-zone during BaCl2-Heptanol application and wash-out. (A) Upper row shows single x,y frames acquired from the I-zone during different BaCl2-Heptanol protocols. The bottom row show corresponding x,t sequences, allowing one to visualize the appearance of these events in both time and space. These x,t scans were reconstructed from a full x,y sequence of frames by selecting a single y line (meaning that the y coordinate is fixed) in the middle of the x,y image. (B) Appearance of the I-zone ectopic waves when the C-zone is either paced or beats spontaneously. The upper x,y frame is taken when a CaT wave passes thru the C-zone. On the x,t image shown below, the wave in the C-zone appears as a single flash on both sides of the I-zone. One can see little interference between the I- and C-zone events. (C) Wash-out of the BaCl2-Heptanol solution results in an exit of the ectopic activity from the I-zone into the C-zone. It is often associated with spiral activity that starts within the I-zone and then spreads through the rest of the network.
Recovery from BaCl2-Heptanol application
Wash-out of BaCl2-Heptanol from the I-zone causes arrhythmias in the C-zone. This can be seen in traces from Fig. 3 B (right panel) and graphically in x,t scans (Fig. 4 C). During this period, multiple ectopic waves exited from different locations along the border, leading to a burst of arrhythmogenic activity. Another common scenario behind such arrhythmias was a conversion of ectopic waves into spiral activity. In experiments spiral activity was initially confined to the I-zone but as reperfusion progressed, it spread into the control network.
Concepts of parameter space diagram and ectopic nexus
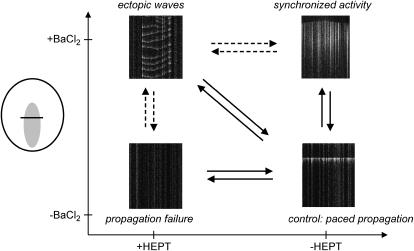
The above experiments suggested a two-coordinate diagram (Fig. 5) that allows one to characterize the network behavior. The ventricular-like of conduction represented a control state of the network, in which an external stimulus was followed by a planar propagating front. An uncoupled quiescent state was typical for Heptanol concentrations exceeding 2 mM. Synchronized firing from the I-zone was always observed during barium application (0.1–1 mM concentrations). As far as ectopic wave region is concerned, its exact appearance varied. The specific concentrations of both Heptanol and BaCl2 required for achieving a particular type of pattern were slightly different between each of the preparations or even individual coverslips. Our numerical and theoretical studies presented below provide an explanation for such variability (see Effect of Heterogeneity; Different Spatial Distributions of the Network Elements; and Appendix 2).
FIGURE 5.
General concept of the parameter space diagram depicting four major behaviors observed within the I-zone. Sample x,t sequences illustrating network behavior in each of the states. Vertical solid arrows correspond to wash-in and wash-out of BaCl2 (detailed in Fig. 1), solid horizontal arrows to the action of Heptanol (detailed in Fig. 2). The diagonal arrows correspond to the wash-in and wash-out of the combined BaCl2-Heptanol treatment. Dotted arrows illustrate other pathways through which the system can get into the so-called ectopic nexus region where ectopic waves are observed.
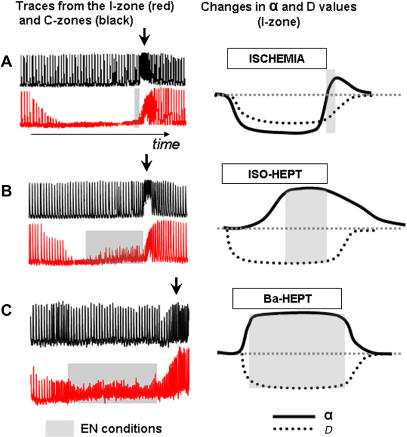
Transitions between the control and two other major states (e.g., propagation failure and synchronized activity, Fig. 5) are straightforward conceptually and were observed during barium or Heptanol applications and their wash-outs (Figs. 1 B and 2 B). These transitions were not arrhythmogenic for either I- or C-zone networks. This is in contrast to the transitions depicted by the diagonal arrows. Specifically, upon recovery from conditions associated with ectopic waves, disordered patterns of activity or arrhythmias were always observed in both I- and the C-zones. Thus, we decided to focus our attention on this conspicuous region. We named the conditions when ectopic waves co-exist, side-by-side with either quiescent or paced outer network, an ectopic nexus. We believe that ectopic nexus is essential for the progression of ectopic activity from individual cells to the rest of the cell network. This point is supported by the data given in Fig. 6, A–C, which summarizes different experimental protocols. It includes reperfusion from ischemia-like conditions (4); application of isoproterenol-Heptanol (3); and data from BaCl2-Heptanol experiments. Cartoons on the right illustrate changes in automaticity (denoted as α) and coupling (denoted as D), which we believe take place during these protocols. As one can see, in all three protocols the ectopic nexus conditions precede the generation of arrhythmias in the C-zone. This observation makes the concept of an ectopic nexus and/or conditions associated with its existence a clinically important issue. We thus proceeded with its full numerical and theoretical assessment.
FIGURE 6.
Ectopic nexus and its relevance to arrhythmogenesis. Panels on the left show representative pairs of traces from the C-zone (black) and I-zone (red). Cartoons on the right illustrate suggested changes in automaticity (denoted as α) and coupling (denoted as D). Black arrows mark arrhythmias in the C-zone. Shaded areas correspond to ectopic nexus conditions (ectopic waves within I-zone). (A) Reperfusion from ischemia-like conditions (4). Notably, during this protocol ectopic waves were observed only transiently alongside border of the I-zone. This explains negligible amplitude of CaT from the I-zone trace during ectopic nexus conditions. (B) Isoproterenol-Heptanol application (3). (C) BaCl2-Heptanol application. This trace illustrates the effect of BaCl2-Heptanol application to the paced monolayer. Note that during the ectopic nexus conditions (shaded area), network activity in the I- and C-zones are different. This is similar to the experiments conducted in quiescent cultures illustrated in Fig. 3.
Numerical studies
Overview
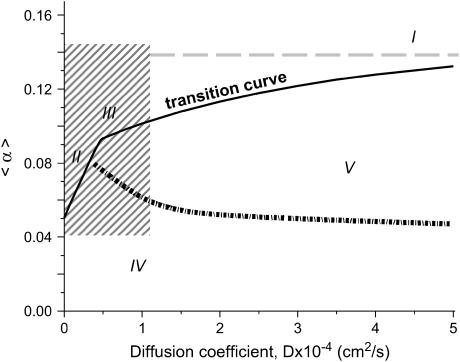
To model experimentally observed phenomena we created parameter space with two variables: 1), a dimensionless parameter α that controls transition from an excitable but quiescent cell to an oscillatory cell (α increases when concentration of BaCl2 increases); and 2), the diffusion coefficient D, which is a measure of cell coupling (D decreases when concentration of Heptanol increases). To reflect intrinsic myocyte heterogeneity we introduced a random distribution of cell properties in our system. Together, these three ingredients (two control parameters and randomness in the distribution of cell properties) lead us to formulate a mathematical model, which defines, in the parameter space (D,α), various regions corresponding to the wave regimes observed experimentally. The five regions (arbitrarily labeled I–V in Fig. 7) correspond to the following regimes:
I, a synchronously beating cell network.
II, individual ectopic sources.
III, fragmented ectopic waves.
IV, a quiescent state where wave propagation is not possible.
V, a quiescent state where wave propagation is possible.
Figs. 8–10 illustrate these regimes by presenting system behavior at different fixed conditions within the parameter space. In the experiment as well as in vivo, however, one is dealing with a continuously changing environment. Therefore, after characterizing fixed conditions, we went on to address the system behavior during transitions between different regions within the parameter space (Figs. 11–15).
FIGURE 7.
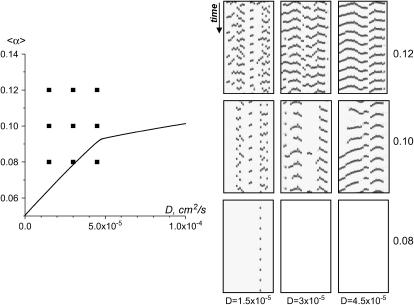
The parameter space diagram with automaticity and cell coupling as coordinates. Automaticity is represented by the coefficient α, which is proportional to the degree of IK1 inhibition (see Construction of the Parameter Space Diagram). The y axis shows mean value 〈α〉 of stochastically distributed α(i,j). The x axis corresponds to the cell-to-cell coupling and is expressed as diffusion coefficient D. Area of the parameter space above the transition curve (solid black curve) corresponds to conditions when the cell network exhibits spontaneous oscillatory activity. Specifically, when D > 10−3 cm2/s (region I), a synchronous beating activity that encompasses the entire network is observed. When D decreases, individual ectopic sources (region II) and ectopic waves with numerous wavebreaks (region III) are observed. Area of the parameter space beneath the transition curve corresponds to conditions when the cell network does not exhibit spontaneous activity. It is divided into two regions. Region IV corresponds to the conditions at which an externally elicited wavefront fails to propagate. When the network is found under Region V it is quiescent on its own, but will propagate an externally initiated wave. The area of the parameter space shown by a shaded rectangle is the main focus of our study and is considered in more details throughout the rest of the figures (Figs. 8–15).
FIGURE 9.
Length of ectopic waves. Once above the transition curve the length of the ectopic waves increases when either 〈α〉 or D are increased. The events are presented in x,t mode and are acquired from the y line positioned in the middle of the I-zone (only the I-zone is shown for the x,t scans, since the C-zone remains silent). Comparing these images to the x,t scans acquired experimentally (Fig. 4 A), one can conclude that patterns are very similar; note that numerical x,t scans have opposite grayscale (black corresponds to excited cells, white to quiescent). Note also that the frame for x,t scan at 〈α〉 = 0.08, D = 3 × 10⁻⁵ appears to be blank because the single ectopic cell, which exhibits oscillatory behavior at these conditions, lies outside the area where the y line was placed.
FIGURE 10.
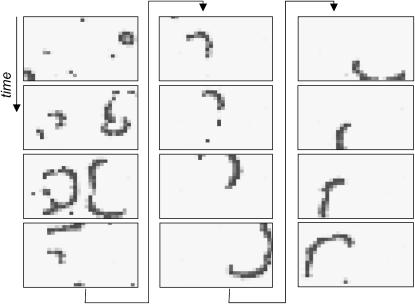
Generation of spiral from propagating and non-propagating ectopic sources. Twelve sequential frames (arranged in three columns) illustrate interaction of two ectopic sources followed by formation of a freely rotating spiral (D = 3 × 10⁻⁵, 〈α〉 = 0.10, δα = 0.025).
FIGURE 11.
Effect of gradually increasing automaticity at fixed coupling. The arrows on the parameter space diagram depict the direction and range of automaticity values, which were gradually changed during this set of simulations. The rate of change d〈α〉/dt = 5 × 10⁻⁴ s−1 is slow enough, so the resulting pictures look qualitatively similar if one doubles the rate of change.
FIGURE 12.
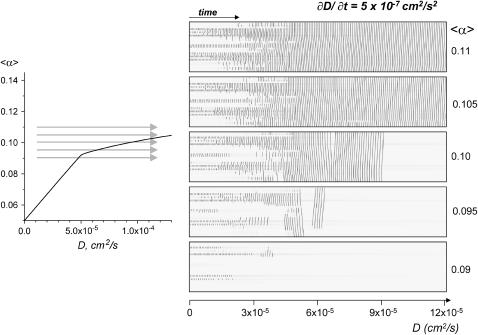
Effect of gradually increasing coupling at fixed automaticity. The arrows on the parameter space diagram depict the direction and range of coupling values, which were gradually changed during this set of simulations. The rate of change dD/dt = 5 × 10⁻⁷ cm2/s2 is slow enough, so the resulting pictures look qualitatively similar if one doubles the rate of change. One can see a gradual transition between II → III types of behavior at all values of 〈α〉, with the exception of 〈α〉 = 0.09, at which transition occurs from II to a quiescent state V.
FIGURE 13.
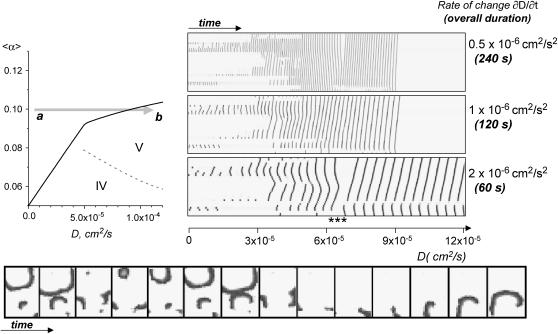
Rate of change and how it affects the observed spatiotemporal transition patterns. Here we compare the outcome of dynamic events that took place during an increase in coupling, while the rate of change was altered. The shaded arrow (graph on the left) shows the range and direction of the change on the parameter space diagram. Specifically, we change conditions from point a (〈α〉 = 0.10, D = 0) to point b (〈α〉 = 0.10, D = 1.2 × 10⁻⁴). The x,t scans that illustrate these transitions are shown on the right. By doubling the rate of change, dD/dt, from 0.5 × 10⁻⁶ to 1 × 10⁻⁶ one can see little difference between the two patterns (note that the x,t scans have different durations here, therefore patterns look more stretched). Events proceed through states II→III to a quiescent state V, when no activity is observed. However, when the rate of change is increased to 2 × 10⁻⁶, the outcome of a→b transition is different. The continuously rotating spiral is formed when network transitions to the point b. This event is marked by the symbols *** on the x,t scan, and is shown as an x,y sequence below.
FIGURE 14.
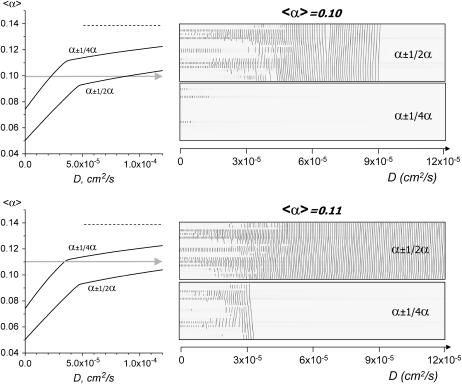
Effect of heterogeneity on the transition curve. Decreasing δα from ½ to ¼ shifted the transition curve upwards, which markedly affected the spatiotemporal patterns of the events. It is illustrated here by a direct comparison of x,t scans acquired when 〈α〉 was fixed at either 0.10 or 0.12 and D was slowly increased from 1 × 10⁻⁵ to 1.2 × 10⁻⁴ (dD/dt = 5 × 10⁻⁷). Shaded arrows show direction and range of change in D value.
FIGURE 15.
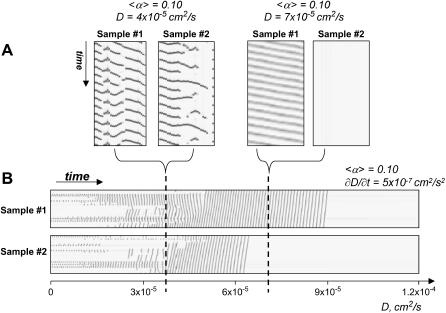
Difference in spatial distribution of 〈α〉 and its effect on network behavior and transitions between the states. (A) X,t scans acquired for two spatially different distributions of 〈α〉 (each with δα/〈α〉 = ½) for two sets of conditions 〈α〉 = 0.1; D = 4 × 10⁻⁵ and 〈α〉 = 0.1; D = 7 × 10⁻⁵. (B) X,t scans acquired during the transition from D = 0 to D = 1.2 × 10⁻⁴ at fixed 〈α〉 = 0.10. Each transition scan corresponds to a different spatial distribution of α(i,j). Dotted lines point to the relative positions of the x,t scans shown in A within the scope of the entire transition.
Construction of the parameter space diagram. We consider a finite system, of size 40 × 20 cells. The system has both an I-zone and a C-zone (see Materials and Methods) with changes in α and D being applied to the cells in the I-zone only. In the system we numerically construct a realization of spatially uncorrelated random variable α(i; j). Variable α(i; j) has a Gaussian distribution with a mean value 〈α〉 and a standard deviation δα. Although the precise properties we are studying depend on the particular distribution of the α(i;j), we found that our results are always qualitatively similar to the one we choose to present here; only the quantitative values differ from run to run (with exceptions considered under Fig. 15 and related text). In our studies we vary 〈α〉 and δα together, keeping the ratio δα/〈α〉 fixed. The system is then characterized by only two parameters: 〈α〉 and D. When the value of 〈α〉 is small, the system can be excited but is not spontaneously active, i.e., in the absence of external stimulus it will remain in a quiescent state. On the other hand, when the value of 〈α〉 is large enough, the cells are all spontaneously active, and a truly dynamic state is expected to emerge. Therefore, for each value of D one will expect the existence of a critical value of 〈α〉, below which the system remains in the quiescent state, and above which oscillations are observed. To determine the critical value of 〈α〉 as a function of D, we integrate the system of equations with a fixed value of D, and vary the values of 〈α〉. The strategy then consists in finding a value of 〈α〉 larger than the threshold, αl, for which the system is in a state where oscillations are observed, and a value of 〈α〉 smaller than the threshold, αs, for which the system is quiescent. Another calculation is then carried out for the value of (αs + αl)/2. This new value replaces αl (respectively, αs) if it leads to an oscillatory state (respectively, quiescent state). This leads to an efficient dichotomy algorithm. The determination of the threshold was carried out until a value with three significant digits was obtained. Fig. 7 shows the critical values of 〈α〉 as a function of D, the value of δα/〈α〉 being equal to ½. Thereafter we refer to this set of critical values as a transition curve.
Propagating versus non-propagating ectopic sources. The transition curve shown in Fig. 7 shows a visible change of slope occurring for a value of D1 ≈ 4.75 × 10⁻⁵ cm2/s, and α1 = 0.0912. Such change of slope in the (D,〈α〉) plane reflects two different behaviors of the solutions of our system. For D < D1 the state above the transition curve corresponds to a situation when an individual cell oscillates while all the others remain quiescent (notably, here we refer to the conditions very close to the transition curve). For D > D1, on the other hand, the solution above the transition curve involves the excitation of several cells leading to a signal that propagates away from the area where it originated. The range over which this signal propagates depends on D. This is illustrated in Fig. 8 A (top panel). The entire domain is shown, at an instant of time. (Unfilled area corresponds to quiescent cells, and solid area shows the excited cells.) For D ≤ D1, the activity remains confined close to the area where it originated (Fig. 8 A, D = 3 × 10⁻⁵). At values of D ≥ D1, activity spreads to several nearby cells (Fig. 8 A, D = 5 × 10⁻⁵), whereas, at D > D1, the train of waves propagate throughout the entire I-zone, leading to pacemaker-like activity (Fig. 8 A, D = 8 × 10⁻⁵). As D becomes larger, the wave pattern emerging from the effective pacemaker center remains the same all along the transition curve for the same distribution of α(i; j), whereas the wavefront velocity increases (data not shown).
A useful insight on the wave regimes can be obtained by representing the evolution of the system in x,t-scanning mode, that is, by plotting the activity along a chosen y line as a function of time. For example, Fig. 8 B shows dynamic behavior of the system when D = 8 × 10⁻⁵ and 〈α〉 = 0.10 (corresponding x,y frame can be seen in Fig. 8 A, top right panel). This figure also illustrates that the process was identical when either intracellular calcium or membrane voltage values were used to plot the activity. One can also see the confinement of the ectopic waves to the I-zone.
Importantly, in all our simulations both the I-zone and C-zone were present. However, in the simulations presented in this study the C-zone was not paced. It simply served as a quiescent network which neighbors the I-zone and illustrates inability of ectopic waves to escape from the I-zone. In the following figures, the non-active C-zone (which, in Fig. 8, appears as an unfilled rectangle next to the I-zone) was cropped from the figures to save journal space (interaction of the paced C-zone activity with the ectopic waves from the I-zone is a subject of our next article).
Fig. 9 presents x,t scans of the I-zone obtained at very low values of coupling (D < D1) and at increasingly large values of 〈α〉. At small values of 〈α〉, the activity spreads from well-identified sources and remains confined to small area around these sources. As the value of 〈α〉 increases, the wave spreads into a larger and larger area of the system, giving rise to an oscillation for each cell of the system. We never observed that the wave pattern reached a simple, periodic state, even for very long times of integration (>600 s). This suggests that the regime is chaotic.
Spiral waves were occasionally observed in region III of the parameter space (Fig. 7), as a result of the evolution of ectopic activity. A detailed graphic presentation of these events can be seen in Fig. 10.
Effect of changing coupling and/or automaticity. To study the transitions between the regimes in a systematic fashion we varied either 〈α〉 or D as a function of time, and recorded the pattern of activity in x,t scanning mode (Figs. 11 and 12). The rate of change for 〈α〉 and D were chosen to be slow enough, so the resulting pictures look qualitatively similar by doubling the rate of change of the parameters. The values chosen are d〈α〉/dt = 5 × 10⁻⁴ s−1, and dD/dt = 5 × 10⁻⁷ cm2/s2. Fig. 11 shows system behavior during gradual increase in 〈α〉 while D values are kept constant, and the Fig. 12 illustrates effects of gradual changes D while 〈α〉 is constant. In these simulations, the behavior below and above the threshold of excitation can be clearly seen. Activity starts at values slightly above the transition curve. At very low values of coupling, the wave does not spread to all the cells, even for fairly high values of 〈α〉. On the other hand, for D > 4.75 × 10⁻⁵ cm2/s, the recorded wave activity propagates throughout the entire I-zone, as shown in Fig. 8. The threshold values observed while increasing D are close to the thresholds corresponding to the transition curve. The wave patterns remain discontinuous for all 〈α〉 values, whenever D < D1.
Changing coupling and/or automaticity: the rate of transition. Each point above the transition curve is associated with dynamic events such as propagation of waves. Therefore, the rate of change of either coupling or automaticity has to be slow enough for the previous condition to reach its semi-steady state. Increasing the rate of change leads to an essential smearing of the transition curve toward the direction of change. It occurs because waves, initiated under conditions when ectopic activity existed, continue to propagate even after the transition curve was passed and the system transitioned into the region where no spontaneous activity is observed. The region where spontaneous activity does not exist, but the externally initiated waves can propagate is marked by V (Fig. 7).
Another interesting aspect associated with fast transitions is an occasional generation of spirals (Fig. 13). When coupling is increased, the system goes from the regions II and III above the transition curve where spontaneous activity is present, to the regions IV and V beneath the transition curve where no spontaneous activity is observed. The network then goes through a series of extinctions as each of the ectopic centers gets turned off. Therefore, after one source has disappeared, and before the next one disappears, one will have the debris of the previous interaction and waves coming from the last ectopic center, which can give rise to spirals (Fig. 13, bottom panel). When the rate of change is slow, the last ectopic center will have sufficient time to pace either debris or spirals away from the system (19). This reasoning supposes that the last ectopic source paces faster than the spiral wave. If not, then, the spiral wave will stay. When the very last ectopic center becomes silent, all the broken arms have been removed. On the contrary, if the system does not have enough time between the last and penultimate extinction, the debris will not go away, and its interaction with the last ectopic firing will give rise to a spiral which will passively propagate as the system now enters into the region V where propagation is possible. For a large system with many ectopic sources, they will disappear at critical values of coupling very close to each other. So the transition rate has to be very slow to remove the spirals. In addition, the drift induced by pacing may be very slow, and one has to move the broken wave arms a long way. These factors increase the likelihood of getting a spiral when the size of the system increases.
Effect of heterogeneity. All the results discussed so far correspond to a value of δα/〈α〉 = 1/2. Fig. 14 considers the case where the network is less heterogeneous and the value of δα/〈α〉 is reduced to one-quarter while keeping the same realization of the random variable used to construct 〈α〉. As one can see, the transition curves for the two values of δα/〈α〉 are similar: they consist of two branches, with a change of slope at a value D1. Point D1 separates the low values where the transition to a time-dependent regime occurs only at the level of individual cells from the higher values of D where the transition involves waves originating from a cluster of cells. The sources of initial activity involved in the transitions below or above D1 are identical for the two ratios δα/〈α〉 = ½ and δα/〈α〉 = ¼, assuming the identical initial distribution of α(i,j). Despite similarities in the general shape of the transition curves, one can also note the marked impact that heterogeneity has on the threshold values at which the system exhibits ectopic waves. At large values of D, the transition line, corresponding to δα/〈α〉 = ¼ is halfway between the transition line for δα/〈α〉 = ½ and a dotted horizontal line corresponding to δα = 0. This is explained theoretically in Appendix 3.
The dotted horizontal line in Fig. 7 and Fig. 14 illustrates network behavior when all cells are identical (i.e., δα = 0). In such a case, the entire network is either quiescent (below the dotted line) or is uniformly oscillating (above the dotted line). Notably the exact value of the αδα=0 = 0.1394 corresponds to A0–Ac = 0.3–0.1606 when the transition to oscillatory behavior occurs for a single cell (see Materials and Methods).
One can make an important conclusion here. Under control conditions (i.e., α = 0, D = 0.1 cm2/s), the system is found in the lower right-hand corner of the parameter space (note that D-axis shown in Fig. 7 will have to be significantly extended to include control values of D = 0.1 cm2/s). Heterogeneity will have a negligible impact on the overall network behavior here, because the system is far from the transition curve. However, a significant impact of heterogeneity on a system's behavior can be seen when it is found in a functional space, close to the regions II and III, where ectopic waves originate.
Different spatial distributions of the network elements. In our simulations we tested three different initial distributions of α(i,j). Different spatial arrangement of heterogeneous cells can lead to both similar (Fig. 15 A, D = 4 × 10⁻⁵ cm2/s) and different network behavior (Fig. 15 A, D = 7 × 10⁻⁵ cm2/s) under identical values of D and 〈α〉. The latter occurs due to the shift of the transition curve with each distribution. Thus, for sample #2, a combination of (〈α〉 = 0.10; D = 7 × 10⁻⁵ cm2/s) corresponds to a point beneath sample's #2 transition curve, and for sample #1 the same point is above its transition curve.
Notably, despite the differences in system behavior at any specific point of the diagram, the transitions between the regions and conclusions illustrated in Figs. 7–15 hold true for any initial distributions of α(i,j) relative to their transition curve. For example, Fig. 15 B shows two x,t sequences that illustrate the transition occurring during a gradual increase in D at fixed 〈α〉 = 0.10. It is evident that the transition for the two samples with different α(i,j) is, in effect, an identical process, although the exact values of D where the network becomes quiescent vary between the two distributions.
Another important issue is the size of the inner network. In some ways it is related to both heterogeneity and spatial distribution issues, as they both change with the size of the I-zone. A physical enlargement of the I-zone leads to the appearance of additional transition points D1, D2 and is further discussed in Theoretical Aspects, below, and in the Appendices.
Theoretical aspects
Our numerical study reveals three remarkable features, which we explored using theoretical considerations. Below is a brief overview of these results. Interested readers are referred to the Supplementary Materials for more details.
Role of low coupling
The first interesting phenomenon is that the new wave regimes (individual ectopic, local ectopic waves, spreading ectopic waves) can be observed only at very small values of D (D < 10−4 cm2/s, i.e., for values of D that are thousand-fold smaller than in control tissue), whereas at larger values of D only regular waves, very reminiscent of a system where all oscillators synchronize, are observed. Theoretical analysis of this issue, accomplished by studying circumstances under which synchronization occurs in such a system, indeed revealed that the new regimes occur for D < 10−4 cm2/s (see Appendix 1).
Transition from quiescent to oscillatory states
The second interesting phenomenon observed in our numerical study is that the transition from quiescent to oscillatory states occurs along branches of solutions, corresponding to various patterns of oscillations along the transition line (e.g., Fig. 8 A; in particular, compare 〈α〉 = 0.08 and 〈α〉 = 0.094). As one jumps from one pattern of activity to another, a clear slope discontinuity is observed along the transition curve. One can try to understand this phenomenon by studying, in a systematic manner, the existence and stability of a quiescent state. We carried out such analysis by using the simpler FitzHugh-Nagumo model; the equation-governing stability is then a Schroedinger equation (see Appendix 2). Our study provides a very natural explanation for the observation of different branches of eigensolutions going unstable, depending on the parameters in the model, and of the different parts of the transition curve (see Appendix 4; see also Fig. A2).
Stability results with randomly distributed cells
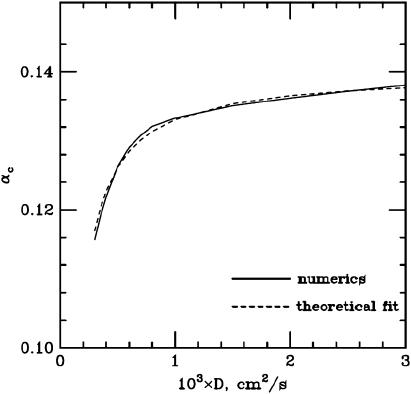
The third interesting phenomenon is the appearance of a transition between non-oscillatory and oscillatory regimes, along the transition curve, at a value of 〈α〉—which is smaller than the value αosc corresponding to the transition for a single cell. The theoretical analysis of the solutions of the stability problem allowed us to justify this fact (see Appendix 3). It also allowed us to determine the asymptotic shape of the transition curve at large values of D,
 |
(3) |
where B is a number that depends only on the precise distribution of α(i,j).
This prediction is found to be in a full agreement with the numerical results (see Fig. A1).
FIGURE A1.
Transition curves at large values of D. The values of α = αCR are shown at large values of D (continuous line). The fit (dashed line) is of the form αCR = αosc − B2/D; see Eq. 3 of the main text.
DISCUSSION
Mechanisms behind automaticity
We believe that the spatiotemporal patterns listed in Fig. 7 reflect a generic behavior that occurs regardless of specific ionic mechanisms underlying ectopic activity or cell-to-cell coupling. Indeed, ectopic arrhythmias can be initiated by a variety of triggers and have been shown to exist despite age or species-related differences in ionic channel expression. Thus, we hypothesized that although the molecular mechanisms which trigger ectopic activity can vary, the progression of ectopic activity is governed by the same general principles. Notably, the behavior identical to the one caused by the BaCl2-Heptanol application was observed (albeit only transiently) during wash-out from ischemia-like conditions or adrenergic stimulation in our previous studies (3,4). From a theoretical point of view, considerations developed in Theoretical Aspects, above, are indeed independent of the precise ionic description.
The term automaticity in this study refers to the myocyte's tendency to generate spontaneous action potentials. It reflects a changing balance between inward/outward currents during diastolic depolarization, leading to pacemaker-like activity. In our studies we have used barium to elicit ectopic activity via inhibition of repolarizing IK1 current (15). Notably, although barium may also affect slow and/fast components of delayed rectifier K current (IKr and IKs), reduce inactivation of ICa or block Ito, these effects are minor as compared with barium inhibition of IK1 (20). Moreover, recent studies have demonstrated the possibility of such a conversion in vivo, by the genetic suppression of this current in a small area of the guinea pig ventricle, which subsequently behaved as a pacemaker for the whole heart (21).
In vivo ectopic activity can be tied to either triggered activity (early and delayed after-depolarizations) or abnormal automaticity under β-adrenergic stimulation, ischemic conditions, or calcium overload (1). Notably, originally the terms abnormal automaticity and triggered activity implied a clear distinction between the two. The first meant a spontaneous, standalone pacemaker-like behavior, whereas the second required a preceding action potential to occur. However, the distinction between these two terms has become less and less clear, as spontaneous triggered activity (leakiness of sarcoplasmic reticulum, Ca2+ overload, elevated Ins,Ca and ICl(Na), upregulation of Na+/Ca2+ exchanger, etc.) has been reported both experimentally (22–24) and theoretically (25). Thus, we refer to spontaneously active myocytes, regardless of underlying mechanism, as ectopic.
Parameter space diagram
The diagram shown in Fig. 7 allows one to display and analyze the full range of spatiotemporal patterns that reflect different states of the network behavior. We want to emphasize the conceptual role of the diagram and point out that the exact values of x,y coordinates, i.e., the degree of IK1 inhibition reflected by the parameter α and/or the coupling coefficient D are of relative importance. The reasons behind it are twofold. First, from a mathematical point of view, the results are quantitatively robust. For example, changing the conductivity values used for the Beeler-Reuter equations from gNa = 4 mS/cm2 and gCa = 0.090 mS/cm2, used in this study, to the original values of gNa = 2.4 mS/cm2 and gCa = 0.045 mS/cm2, simply shifts the critical value from Acrit = 0.1606 to Acrit = 0.2303, while the rest of the diagram and transition results remain the same. Secondly, the exact values are not as important for physiological reasons as well, since plating density, age of cells, or species origins will affect both coupling and susceptibility to barium. This, however, does not change the fundamental relationships delineated in the Fig. 7.
Issue of heterogeneity
In vivo, structural heterogeneity is an intrinsic property of a complex myocardial structure (due to the presence of vessels, fatty deposits, changes in fiber orientation, etc.), that becomes progressively apparent with aging or disease and is associated with tissue fibrosis (26,27). A marked heterogeneity can be observed in border areas of healed infarcts with a few strands of myocytes intermingled with largely fibroblast-filled areas or regions of apoptotic myocytes (28,29). The heterogeneity issue is often discussed in the context of reentry formation (30); however, its role in ectopic arrhythmias remains poorly understood. The important part of the theoretical work presented here is the quantification of network heterogeneity as a factor in initiation of ectopic waves. Indeed, experimentally, one cannot eliminate intrinsic differences existing between individual myocytes or in the way they are coupled to their immediate neighbors. Theoretically, however, it is possible. As mentioned in Construction of the Parameter Space Diagram, above, if α(i,j) values are identical for all cells, the ectopic waves were not observed at all. Instead, the transition curve becomes horizontal and the network found to be either quiescent or uniformly oscillating. By increasing the degree of α(i,j) dispersion one effectively shifts the transition curve down and to the right (Fig. 14), thus enlarging the range of conditions in which the ectopic waves can be observed. It means that the heterogeneity decreases the automaticity threshold and that, under identical coupling conditions, a much smaller increase in automaticity is required to generate network activity. Similarly, under identical automaticity conditions, a much wider range of coupling values is associated with spontaneous ectopic waves.
Formation of spirals
Generation of spiral activity in excitable media has been studied extensively in the past by us and others (31–34). In vivo formation of spiral waves has been also observed (35–37). In preparations of cardiac myocytes, both spontaneous (38,39) and induced (40–42) spirals have been shown. The novelty of our data is not the fact that spiral activity exists in these preparations, but in defining the regions of functional space where spiral activity can be spontaneously generated.
Our numerical studies suggested, and the experiments confirmed, that spirals in our system can occur via two different mechanisms within two different regions of the functional space (for discussion purposes, let us call them cases A and B). Case A corresponds to the spiral formation that occurs under values of 〈α〉 and D found in region III (Fig. 7). This process was considered in Propagating Versus Non-Propagating Ectopic Sources, above, and is shown in Fig. 10. The network's physical size is an essential factor here (discussed in Eq. A2, below). The second case occurs when the system rapidly undergoes a transition from region III to V. This process was discussed under Changing Coupling and/or Automaticity: the Rate of Transition (Fig. 13). There are important similarities and differences between these two cases. Similarities include an actual event that initiates a spiral. It is a phenomenon, well-described in the past, when a continuous wave front interacts with debris. In our studies the wave front comes from what we call a propagating ectopic source (Fig. 8). Debris is either: a non-propagating ectopic cluster (case A) or an ectopic wave that is being turned off as coupling increases (case B). Another similarity between cases A and B is the probabilistic nature of spiral formation. Specifically, although in both cases spirals can happen in these regions of the parameter space, their actual occurrence will depend on a particular distribution of heterogeneous cells, as well as on previous history. The main difference between cases A and B is that in case B spiral activity is a result of a transition, with the rate of transition playing an essential role (Fig. 13 and see Changing Coupling and/or Automaticity: the Rate of Transition).
Ectopic nexus hypothesis and its implications
A bulk of our experimental data, as well as numerical and analytical studies, indicate a generic character of the ectopic nexus and transitions between different states of the network behavior. Furthermore, experiments suggest that ectopic waves within the I-zone always preceded the appearance of arrhythmias in the C-zone (Fig. 6). We thus suggest that the ectopic nexus will be critical for the development of arrhythmias in vivo as well. The reasons it escaped direct detection are probably manifold. Indeed, an in vivo ectopic nexus is likely to 1), be a microscopic phenomenon hardly detectable by either mapping or electrode recordings; 2), occur beneath the upper epicardial layer within a small area of the border zone; and 3), be short-lived both in time and space, because reperfusion rapidly relieves the conditions associated with ectopic nexus.
The existence of an ectopic nexus implies an essentially constant source of activation for the control network due to an added spatial component as ectopic waves continuously whirl alongside the border of the I-zone (and escape at the first spot alongside the border where conditions of an exit block are relieved). Thus, one can argue, that ectopic nexus may substantially widen the vulnerability window required for reentry formation (43).
Future studies
This study addresses the behavior of a network under changing conditions within the I-zone while the adjacent C-zone remained silent. Indeed, we mentioned that 1), the ectopic waves remain confined to the I-zone in both experiments and in numerical studies; and 2), little interaction between the C-zone and I-zone patterns occurs during the ectopic nexus itself. However, the interaction between the inner and outer networks becomes significant when the ectopic nexus conditions are relieved. In fact, such interaction is what leads to arrhythmias (Fig. 6). Therefore, our next step is to address interactions between the I-zone with altered 〈α〉 and D and a paced C-zone.
SUPPLEMENTARY MATERIALS
An online supplement to this article can be found by visiting BJ Online at http://www.biophysj.org. Included are two supplemental videos (.mpg files) that illustrate ectopic waves and spontaneous spiral activity localized to the I-zone. Images were acquired from monolayers of cardiac myocytes loaded with fluorescent indicator Fluo-4 and subjected to a local application of BaCl2-Heptanol (details in article text; see Experimental Studies in the Results section).
Supplementary Material
Acknowledgments
We are grateful to Drs. Ariel Escobar and Vadim Biktashev for valuable discussions, Maxime Castera for image processing software, and Luther Swift for excellent technical and editorial assistance. We also acknowledge the inspirational role of Dr. Simon E. Shnoll in these studies.
This work was supported by the National American Heart Association and the National Institutes of Health.
APPENDICES
Overview
These Appendices are an expanded version of the Theoretical Aspects subsection in Results, above. Here we provide theoretical explanations for several features observed in our numerical studies (see Numerical Studies subsection in Results, above).
APPENDIX 1: SYNCHRONIZATION OF THE SYSTEM AT LARGE VALUES OF D
Coupled oscillators with slightly different periods tend, under proper conditions, to synchronize. This conspicuous property has been noted for a broad class of natural phenomena (44), including physiology (45–47). As such, it has been extensively studied. Generally, synchronization occurs when the coupling is high enough. In such cases, the system oscillates with a well-defined frequency, each oscillator (cell) having its own phase.
In the present problem, cells may also synchronize, provided the coupling is large enough. In contrast, the new wave regimes, described in the previous section, correspond to a very low value of the coupling; they result from an assembly of unsynchronized oscillators. This suggests a transition between a fully synchronized state and a poorly coupled state. Below, we address this problem and provide an estimate for the diffusion coefficient above which synchronization is obtained.
We analyze this problem theoretically in the spirit of Keener and Sneyd (6). Since in experiment we deal with assemblies of heterogeneous but similar cells, we use the assumption that the dispersion of the oscillator's frequency is small. One may then use standard multiscale analysis techniques to study the evolution of the system. More precisely, one looks for a solution for each individual oscillator in the form U(ω0t + θ(i, j, t)), where U(ω0t) is the solution of the unperturbed system and ω0 is the unperturbed frequency, and derives an equation for the phase θ(i, j, t). The phase equation reduces in the limit where the phases of neighboring cells are close to
 |
(A1) |
where ξ is the inverse of a characteristic timescale, of the order 1 s, and η is a number of order 1, which can be explicitly computed by solving an auxiliary problem.
With this formulation, a synchronized state necessarily corresponds to a steady solution of the phase equation. Equation A1 has always a steady-state solution, which is unique up to a general phase translation. To determine whether this solution really corresponds to a synchronized solution, we estimate the maximum phase difference between two points in the system, δθ and δθ, to be of the order of  where L is the size of the system. When this phase difference is small enough,
  waves emitted by ectopic centers propagate throughout the system within one period; the solution then corresponds to a synchronized activity. On the other hand, when
  waves do not reach the end of the system within one period. In general, when several competing ectopic centers are present in the system, each ectopic center emits its own set of waves, which are no longer synchronized. Thus, the condition leading to a synchronization of the waves in the system is
 |
(A2) |
A synchronized solution occurs when the coupling D is large enough, compared to the frequency dispersion.
The values of ξ and η can be obtained either by solving an auxiliary problem (perturbation around a limit cycle), or alternatively, ξ can be obtained by studying the frequency dependence on α, and η by studying the problem of two coupled cells. Using the latter method, we find values of ξ ∼ 0.01 ms−1, and η ∼ 20. This leads to a critical value of D of the order of ∼10−4 cm2 s−1. At values of D larger than ∼10−4 cm2/s the wave activity is essentially synchronized over the whole system; new wave regimes of propagation can be observed, only for D ≲ 10−4 cm2 s−1, in agreement with the numerical observations of the previous section.
The size of the system plays an important role in the phenomena discussed here. The condition stated in Eq. A2 expresses that the characteristic time of phase relaxation in the entire system, L2/ηD, is short compared to the root-mean-square of the fluctuations of individual cells' periods.
APPENDIX 2: TRANSITION FROM QUIESCENT TO OSCILLATORY STATE: GENERAL FRAMEWORK
The nature of the transition observed between a quiescent state and a spontaneously active state, upon varying the parameters of the system (D and 〈α〉), is the main numerical observation of our work (see Fig. 7 of the main text). To understand the main features of this transition, it is appropriate to study it using linear stability theory of the quiescent state. As we show here, this analysis allows us to explain a number of important features observed in the Fig. 7 of the main text.
The first main result is that the transition curve is below the line corresponding to a uniform system, α = αosc. In particular, the behavior of the curve at large values of D can be obtained explicitly, as we show below in Stability Results with Randomly Distributed Cells.
Another very interesting aspect of the transition curve of Fig. 7 is that it has a broken shape. Again, this can be understood with our analysis: the existence of well-characterized modes of destabilization along the transition curve (see Figs. 7 and 8) is a manifestation of the structure of the most unstable eigenmode in this instability problem. In a large system, several eigenmodes, with very different spatial characteristics, may compete. A transition from one eigenmode to another leads to a discontinuity of the slope of the curve, as illustrated in Fig. 8.
A full analytical study, using the Beeler-Reuter model, used numerically in this work, has not been carried out. The fact that the transition to an oscillation state occurs through an homoclinic bifurcation is a source of technical difficulties. It is instructive to investigate instead the mathematically simpler FitzHugh-Nagumo problem, which has been studied by us numerically in a similar context (3), and leads to results qualitatively very similar to the one obtained here with the more realistic Beeler-Reuter model.
Briefly, the FitzHugh-Nagumo system is written in the form of
 |
(A3) |
 |
(A4) |
As in the Beeler-Reuter model, e is the membrane potential, and the coupling term is given by Eq. 2 of the main text. The variable w represents the slow currents, and α controls the automaticity of the system. As in our numerical study, we consider the case where the values of α vary from cell to cell, with a Gaussian, uncorrelated distribution from cell to cell. In this system, one can show the existence of a quiescent state in the square-lattice geometry, for any value of the control parameters, D and α (6).
Introducing a perturbation
 |
(A5) |
and linearizing the FitzHugh-Nagumo system, one obtains, after some elementary manipulations,
 |
(A6) |
 |
(A7) |
The growth or the decay of a perturbation is given by the sign of the real part of λ; a positive real part of λ leads to an instability of the steady state, whereas if the real parts of all the eigenvalues, λ, are negative, the system is stable. The growth rate, λ, is determined by an eigenvalue problem, described by Schroedinger Eqs. A6 and A7, well-known in various physical contexts (48). All the eigenvalues (possible values of μ) are real. Eq. A7 implies that an instability appears when
 |
(A8) |
At the instability threshold, for μ = μc, the value of λ is purely imaginary. In the case where all cells are identical, e0 is the same everywhere, and the transition occurs at a value αosc, corresponding to e0 = ec, which is f′(ec) = +kε.
APPENDIX 3: STABILITY RESULTS WITH RANDOMLY DISTRIBUTED CELLS
In our problem, where the cell properties are random, the potential (f′(e0) in Eq. A6) is also a fluctuating function of space, which can be thought of as a random potential. In this sense, our stability problem is very reminiscent of the Schroedinger equation problem, studied in the context of localization in condensed matter physics (49).
The case where the coupling coefficient is large can be completely analyzed. To derive Eq. 3, we begin by rewriting Eq. A6 as
 |
(A9) |
where the coupling term in Eq. A6 is now the discrete Laplacian operator, independent of D. In the case where D is large, the potential term, f′(e0)/D, is formally small compared to the Laplacian term. The solution is then almost uniform, and instability occurs very close to α = αosc.
The value of α where the instability occurs can be determined in an expansion in powers of 1/D. We write α = (αosc − δα)(1 + ζ(x)), where ζ is a random function of the position, of mean value 0, and δα is the perturbation of the mean value of α. We assume that the inhomogeneity ζ is small; this is a reasonable assumption, consistent with the numerical values used for the calculations presented in the main text. As a result, the value of e0 is close to ec. When k is large enough, e0 can be simply determined as
 |
(A10) |
where A = k/(k − f′(e0)) is a positive number. By substituting the value of e0 above in Eq. A9, and by doing a straightforward Taylor series expansion (f′(e0) ≈ f′(ec) + f″(ec)(e0 − ec) + …), one obtains
 |
(A11) |
In the cases of interest, we note that f″(ec) > 0.
The solution can then be searched for in perturbation, in powers of 1/D,
 |
(A12) |
 |
(A13) |
The solution at the lowest order is δe0 = 1, provided δα = 0. At first-order, the solution is determined by
 |
(A14) |
The value of μ1 can be determined by multiplying this equation by δe0, and integrating throughout the system. Using the fact that the mean of ζ(x) is equal to zero, one obtains μ1 = 0, which implies that the transition between non-oscillating and oscillating is given by δα = 0. At the following order, δe2 is given by
 |
(A15) |
Again, multiplying the equation by δe0 = 1, and integrating over the entire system, one obtains
 |
(A16) |
The sign of this last quantity comes from elementary manipulations in the above integrals. As a result, the value of the μ obtained from our analysis is
 |
(A17) |
From this equation, it is immediately clear that the transition (μ = μc) occurs when α = αosc − B2/D. This result, consistent with our numerical results (see Fig. A1), is stated in the main text (Stability Results with Randomly Distributed Cells, in the Results section, above).
FIGURE A2.
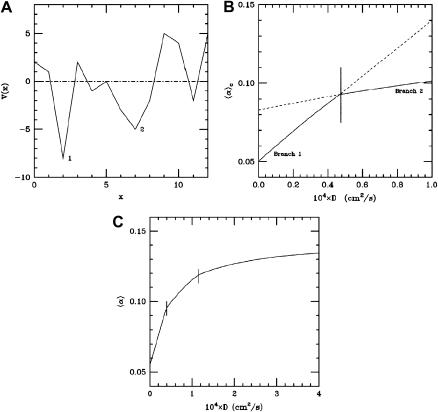
Transition between branches of solutions. (A) Schematic representation of the values of α, hence of the potential V (x) = f′(e0)/D in Eq. A9. Two minima are shown. The deepest one, 1, corresponds to the minimum branch when D is very small. The shallowest one, 2, corresponds to the minimum branch at higher values of D. (B) The branches of solutions 1 and 2 correspond to two straight lines. The experimentally observable mode of destabilization corresponds to the lowest of the two branches. A crossing between the two branches, 1 and 2, is observed in the (D,α) plane. (C) The transition curve, corresponding to another distribution of α(i,j), with two crossing between branches with a different spatial structure.
APPENDIX 4: CROSSING BETWEEN BRANCHES OF SOLUTIONS
In fact, an infinite set of modes can be found by solving the linearized problem, giving rise to an infinite set of possible growth rates and associated eigenmodes. The growth of the solution, as well as the structure in space of the growing modes, is thus determined by solving an eigenvalue problem, formulated as a partial differential equation.
An example of transition between two types of solutions is schematically illustrated in Fig. A2. Fig. A2 A shows the potential, f′(e0), or equivalently, the value of α. Two minima, indicated on the figure by 1 and 2 are seen. Each minimum gives rise to a branch of solutions in the (D,α) plane (see Fig. A2 B). The experimentally observed mode of destabilization corresponds to the lowest branch of the two (solid line). Since minimum 1 is deeper than minimum 2, this minimum is the first one to become unstable, when D is very small. On the other hand, at larger values of D, the shallower minimum 2 will become more unstable than minimum 1. This transition thus leads to a crossing of two branches, as shown in Fig. A2 B. This mechanism is the origin of the phenomenon observed in Fig. 2 of the main text. Note that the number of crossing between different modes can be larger than 1. As an example, Fig. A2 C shows a case with two crossings, instead of one, as shown in Fig. 7 of the main text.
References
- 1.Carmeliet, E. 1999. Cardiac ionic currents and acute ischemia: from channels to arrhythmias. Physiol. Rev. 79:917–1017. [DOI] [PubMed] [Google Scholar]
- 2.Arutunyan, A., D. R. Webster, L. M. Swift, and N. Sarvazyan. 2001. Localized injury in cardiomyocyte network: a new experimental model of ischemia-reperfusion arrhythmias. Am. J. Physiol. Heart Circ. Physiol. 280:H1905–H1915. [DOI] [PMC free article] [PubMed] [Google Scholar]
- 3.Arutunyan, A., A. Pumir, V. Krinsky, L. Swift, and N. Sarvazyan. 2003. Behavior of ectopic surface: effects of β-adrenergic stimulation and uncoupling. Am. J. Physiol. Heart Circ. Physiol. 285:H2531–H2542. [DOI] [PMC free article] [PubMed] [Google Scholar]
- 4.Arutunyan, A., L. M. Swift, and N. Sarvazyan. 2002. Initiation and propagation of ectopic waves: insights from an in vitro model of ischemia-reperfusion injury. Am. J. Physiol. Heart Circ. Physiol. 283:H741–H749. [DOI] [PMC free article] [PubMed] [Google Scholar]
- 5.Beeler, G. W., and H. Reuter. 1977. Reconstruction of the action potential of ventricular myocardial fibres. J. Physiol. 268:177–210. [DOI] [PMC free article] [PubMed] [Google Scholar]
- 6.Keener, J., and J. Sneyd. 1998. Mathematical Physiology. Springer Verlag, Berlin and New York.
- 7.Guckenheimer, J., and P. Holmes. 1983. Nonlinear Oscillations, Dynamical Systems, and Bifurcations of Vector Fields. Springer-Verlag, New York.
- 8.Pumir, A., and V. Krinsky. 1999. Unpinning of a rotating wave in cardiac muscle by an electric field. J. Theor. Biol. 199:311–319. [DOI] [PubMed] [Google Scholar]
- 9.Masuda, H., and N. Sperelakis. 1993. Inwardly rectifying potassium current in rat fetal and neonatal ventricular cardiomyocytes. Am. J. Physiol. 265:H1107–H1111. [DOI] [PubMed] [Google Scholar]
- 10.Wahler, G. M. 1992. Developmental increases in the inwardly rectifying potassium current of rat ventricular myocytes. Am. J. Physiol. 262:C1266–C1272. [DOI] [PubMed] [Google Scholar]
- 11.Press, W., S. Teukolsky, W. Vetterling, and B. Flannery. 1992. Numerical Recipes. Cambridge University Press, New York.
- 12.Kleber, A. G., and Y. Rudy. 2004. Basic mechanisms of cardiac impulse propagation and associated arrhythmias. Physiol. Rev. 84:431–488. [DOI] [PubMed] [Google Scholar]
- 13.Delmar, M., and J. Jalife. 1987. Low Ba-induced pacemaker current in well-polarized cat papillary muscle. Am. J. Physiol. Heart Circ. Physiol. 252:H258–H268. [DOI] [PubMed] [Google Scholar]
- 14.Shen, J. B., and M. Vassalle. 1996. Barium-induced diastolic depolarization and controlling mechanisms in guinea pig ventricular muscle. J. Cardiovasc. Pharmacol. 28:385–396. [DOI] [PubMed] [Google Scholar]
- 15.Silva, J., and Y. Rudy. 2003. Mechanism of pacemaking in I(K1)-downregulated myocytes. Circ. Res. 92:261–263. [DOI] [PMC free article] [PubMed] [Google Scholar]
- 16.Arutunyan, A., L. Swift, and N. Sarvazyan. 2004. Multiple injury approach and its use for toxicity studies. Cardiovasc. Toxicol. 4:1–10. [DOI] [PMC free article] [PubMed] [Google Scholar]
- 17.Beauchamp, P., C. Choby, T. Desplantez, K. de Peyer, K. Green, K. A. Yamada, R. Weingart, J. E. Saffitz, and A. G. Kleber. 2004. Electrical propagation in synthetic ventricular myocyte strands from germline connexin43 knockout mice. Circ. Res. 95:170–178. [DOI] [PubMed] [Google Scholar]
- 18.Niggli, E., A. Rudisuli, P. Maurer, and R. Weingart. 1989. Effects of general anesthetics on current flow across membranes in guinea pig myocytes. Am. J. Physiol. 256:C273–C281. [DOI] [PubMed] [Google Scholar]
- 19.Krinsky, V. I., and K. I. Agladze. 1983. Interaction of rotating waves in an active chemical medium. Phys. 8D:50–56. [Google Scholar]
- 20.Shi, H., H. Z. Wang, and Z. Wang. 2000. Extracellular Ba2+ blocks the cardiac transient outward K+ current. Am. J. Physiol. Heart Circ. Physiol. 278:H295–H299. [DOI] [PubMed] [Google Scholar]
- 21.Miake, J., E. Marban, and H. B. Nuss. 2002. Biological pacemaker created by gene transfer. Nature. 419:132–133. [DOI] [PubMed] [Google Scholar]
- 22.Maldonado, C., Z. Y. Li, W. B. Wead, T. Szabo, and J. Kupersmith. 1996. Mechanisms of triggered activity induction at the border zone of normal and abnormal cardiac tissue. J. Electrocardiol. 29:309–318. [DOI] [PubMed] [Google Scholar]
- 23.Miura, M., P. A. Boyden, and H. E. ter Keurs. 1999. Ca2+ waves during triggered propagated contractions in intact trabeculae. Determinants of the velocity of propagation. Circ. Res. 84:1459–1468. [DOI] [PubMed] [Google Scholar]
- 24.Bers, D. M. 2002. Calcium and cardiac rhythms: physiological and pathophysiological. Circ. Res. 90:14–17. [PubMed] [Google Scholar]
- 25.Luo, C. H., and Y. Rudy. 1994. A dynamic model of the cardiac ventricular action potential. II. Afterdepolarizations, triggered activity, and potentiation. Circ. Res. 74:1097–1113. [DOI] [PubMed] [Google Scholar]
- 26.Peters, N. S., J. Coromilas, N. J. Severs, and A. L. Wit. 1997. Disturbed connexin43 gap junction distribution correlates with the location of reentrant circuits in the epicardial border zone of healing canine infarcts that cause ventricular tachycardia. Circulation. 95:988–996. [DOI] [PubMed] [Google Scholar]
- 27.Dupont, E., T. Matsushita, R. A. Kaba, C. Vozzi, S. R. Coppen, N. Khan, R. Kaprielian, M. H. Yacoub, and N. J. Severs. 2001. Altered connexin expression in human congestive heart failure. J. Mol. Cell. Cardiol. 33:359–371. [DOI] [PubMed] [Google Scholar]
- 28.Dispersyn, G. D., L. Mesotten, B. Meuris, A. Maes, L. Mortelmans, W. Flameng, F. Ramaekers, and M. Borgers. 2002. Dissociation of cardiomyocyte apoptosis and dedifferentiation in infarct border zones. Eur. Heart J. 23:849–857. [DOI] [PubMed] [Google Scholar]
- 29.Wong, S. S., A. L. Bassett, J. S. Cameron, K. Epstein, P. Kozlovskis, and R. J. Myerburg. 1982. Dissimilarities in the electrophysiological abnormalities of lateral border and central infarct zone cells after healing of myocardial infarction in cats. Circ. Res. 51:486–493. [DOI] [PubMed] [Google Scholar]
- 30.Ursell, P. C., P. I. Gardner, A. Albala, J. J. Fenoglio, Jr., and A. L. Wit. 1985. Structural and electrophysiological changes in the epicardial border zone of canine myocardial infarcts during infarct healing. Circ. Res. 56:436–451. [DOI] [PubMed] [Google Scholar]
- 31.Pumir, A., F. Plaza, and V. I. Krinsky. 1994. Control of rotating waves in cardiac muscle: analysis of the effect of an electric field. Proc. R. Soc. Lond. B. Biol. Sci. 257:129–134. [DOI] [PubMed] [Google Scholar]
- 32.Krinsky, V. 1999. Qualitative theory of reentry. In Cardiac Electrophysiology, From Cell to Bedside. D. P. Zipes and J. Jalife, editors. Saunders, Philadelphia, PA. 320–326.
- 33.Winfree, A. T. 1990. The Geometry of Biological Time. Springer-Verlag, Berlin and New York.
- 34.Chen, P. S., A. Garfinkel, J. N. Weiss, and H. S. Karagueuzian. 1997. Spirals, chaos, and new mechanisms of wave propagation. Pacing Clin. Electrophysiol. 20:414–421. [DOI] [PubMed] [Google Scholar]
- 35.Allessie, M. A., F. I. Bonke, and F. J. Schopman. 1973. Circus movement in rabbit atrial muscle as a mechanism of tachycardia. Circ. Res. 33:54–62. [PubMed] [Google Scholar]
- 36.Davidenko, J. M., A. V. Pertsov, R. Salomonsz, W. Baxter, and J. Jalife. 1992. Stationary and drifting spiral waves of excitation in isolated cardiac muscle. Nature. 355:349–351. [DOI] [PubMed] [Google Scholar]
- 37.Efimov, I. R., V. Sidorov, Y. Cheng, and B. Wollenzier. 1999. Evidence of three-dimensional scroll waves with ribbon-shaped filament as a mechanism of ventricular tachycardia in the isolated rabbit heart. J. Cardiovasc. Electrophysiol. 10:1452–1462. [DOI] [PubMed] [Google Scholar]
- 38.Bub, G., L. Glass, N. G. Publicover, and A. Shrier. 1998. Bursting calcium rotors in cultured cardiac myocyte monolayers. Proc. Natl. Acad. Sci. USA. 95:10283–10287. [DOI] [PMC free article] [PubMed] [Google Scholar]
- 39.Bub, G., A. Shrier, and L. Glass. 2002. Spiral wave generation in heterogeneous excitable media. Phys. Rev. Lett. 88:058101. [DOI] [PubMed] [Google Scholar]
- 40.Bursac, N., F. Aguel, and L. Tung. 2004. Multiarm spirals in a two-dimensional cardiac substrate. Proc. Natl. Acad. Sci. USA. 101:15530–15534. [DOI] [PMC free article] [PubMed] [Google Scholar]
- 41.Entcheva, E., S. N. Lu, R. H. Troppman, V. Sharma, and L. Tung. 2000. Contact fluorescence imaging of reentry in monolayers of cultured neonatal rat ventricular myocytes. J. Cardiovasc. Electrophysiol. 11:665–676. [DOI] [PubMed] [Google Scholar]
- 42.Iravanian, S., Y. Nabutovsky, C. R. Kong, S. Saha, N. Bursac, and L. Tung. 2003. Functional reentry in cultured monolayers of neonatal rat cardiac cells. Am. J. Physiol. Heart Circ. Physiol. 285:H449–H456. [DOI] [PubMed] [Google Scholar]
- 43.Starmer, C. F., V. N. Biktashev, D. N. Romashko, M. R. Stepanov, O. N. Makarova, and V. I. Krinsky. 1993. Vulnerability in an excitable medium: analytical and numerical studies of initiating unidirectional propagation. Biophys. J. 65:1775–1787. [DOI] [PMC free article] [PubMed] [Google Scholar]
- 44.Kuramoto, Y. 1984. Chemical Oscillations, Waves and Turbulence. Springer Verlag, Berlin and New York.
- 45.Michaels, D. C., D. R. Chialvo, E. P. Matyas, and J. Jalife. 1990. Dynamics of synchronization in the sinoatrial node. Ann. N. Y. Acad. Sci. 591:154–165. [DOI] [PubMed] [Google Scholar]
- 46.Joyner, R. W., and F. J. van Capelle. 1986. Propagation through electrically coupled cells. How a small SA node drives a large atrium. Biophys. J. 50:1157–1164. [DOI] [PMC free article] [PubMed] [Google Scholar]
- 47.Falcke, M., and H. Levine. 1998. Pattern selection by gene expression in Dictyostelium discoideum. Phys. Rev. Lett. 80:3875–3878. [Google Scholar]
- 48.Landau, L. D., and I. M. Lifshitz. 1959. Quantum Mechanics (Kvantovaya Mekhanika). Pergamon Press, Armonk, NY.
- 49.Thouless, D. J. 1978. Percolation and localization. In Ill-Condensed Matter. R. Balian, R. Maynard, and G. Toulouse, editors. North-Holland, Amsterdam, The Netherlands.
Associated Data
This section collects any data citations, data availability statements, or supplementary materials included in this article.


