

Abstract
The osmotic pressure of chondroitin sulfate (CS) solution in contact with an aqueous 1:1 salt reservoir of fixed ionic strength is studied using a recently developed coarse-grained molecular model. The effects of sulfation type (4- vs. 6-sulfation), sulfation pattern (statistical distribution of sulfate groups along a chain), ionic strength, CS intrinsic stiffness, and steric interactions on CS osmotic pressure are investigated. At physiological ionic strength (0.15 M NaCl), the sulfation type and pattern, as measured by a standard statistical description of copolymerization, are found to have a negligible influence on CS osmotic pressure, which depends principally on the mean volumetric fixed charge density. The intrinsic backbone stiffness characteristic of polysaccharides such as CS, however, is demonstrated to contribute significantly to its osmotic pressure behavior, which is similar to that of a solution of charged rods for the 20-disaccharide chains considered. Steric excluded volume is found to play a negligible role in determining CS osmotic pressure at physiological ionic strength due to the dominance of repulsive intermolecular electrostatic interactions that maintain chains maximally spaced in that regime, whereas at high ionic-strength steric interactions become dominant due to electrostatic screening. Osmotic pressure predictions are compared to experimental data and to well-established theoretical models including the Donnan theory and the Poisson-Boltzmann cylindrical cell model.
INTRODUCTION
Articular cartilage is an avascular tissue that provides a low-friction, protective lining to the ends of contacting bones during joint locomotion. The tissue consists of a dense extracellular matrix of aggrecan and type II collagen that is maintained by a sparse volume fraction (∼2%) of cells. Aggrecan is a high-molecular-weight proteoglycan (1–3.5 MDa) that consists of a linear protein backbone (∼300 Å contour length) with ∼100 covalently bound anionic chondroitin sulfate (CS) glycosaminoglycans (GAGs), as well as a smaller molecular-weight fraction of keratin sulfate GAGs and other oligosaccharides (Fig. 1) (1,2). With the aid of link protein, aggrecan associates noncovalently with high-molecular-weight hyaluronic acid to form supramolecular complexes, helping to retain it in the extracellular matrix. The high negative charge density presented by the CS chains on aggrecan generates an osmotic swelling pressure that maintains articular cartilage in a hydrated state (60–80% water by weight) even under substantial compressive loads, and plays a central role in determining its compressive mechanical properties (3,4).
FIGURE 1.

Schematic (left) and atomic force microscope image (right) of a single aggrecan molecule, illustrating the core protein main chain and the grafted GAG side chains (cp, core protein; CS, chondroitin sulfate; KS, keratan sulfate; N, N-terminal domain; C, carboxy-terminal domain; G1, globular domain 1; G2, globular domain 2; G3, globular domain 3; and IGD, interglobular domain). Images are courtesy of Laurel Ng (12).
The CS constituent of aggrecan varies in chemical composition depending on the state of health or disease of articular cartilage (osteoarthritis or rheumatoid arthritis), anatomical site, depth within the cartilage layer, and age of the organism (5–12). For example, the fraction of 6-sulfated CS disaccharides in human femoral condyle cartilage increases with age from ∼0.5 to 0.8 from birth to the age of 20 years with a concomitant decrease in 4-sulfation, after which it plateaus. Additionally, the concentration of 6-sulfated CS disaccharides in knee synovial fluid has been observed to be significantly lower in rheumatoid arthritis and osteoarthritis than in healthy tissue (10) and the concentration of 4-sulfated CS disaccharides higher in osteoarthritic hip cartilage, with only slight changes in overall GAG content (13). Considering the important role that CS plays in determining the mechanical properties of articular cartilage and these observed variations in CS chemical composition, it is of significant biological interest to understand the connection between CS composition and its osmotic pressure and conformation in detail. It is also of primary interest to gain a comprehensive understanding of the molecular origin of the mechanical properties of GAGs and proteoglycans due to their important role in tissue engineering and biomaterials applications, as well as in other native biological tissues such as the corneal stroma and central nervous system (1,14–16).
The specific objectives of this study are twofold. First, we investigate the effects of CS chemical composition, namely sulfation type, sulfation pattern, and molecular weight, on CS osmotic pressure under physiological conditions (0.15 M NaCl) to gain insight into the potentially relevant biomechanical function of these variations. Second, we evaluate the relative roles played by intrinsic versus electrostatic CS backbone stiffness as well as steric excluded volume interactions to gain a better understanding of the molecular origin of CS osmotic pressure. The latter aim is to aid in the development and application of analytical models of cartilage biomechanics (17–19). Toward this end, we employ a recently developed coarse-grained molecular model that enables the computation of solution conformational and thermodynamic properties of GAGs (20). The model uses systematic coarse-graining from an all-atom representation of the disaccharide building blocks of GAGs to achieve computational tractability that enables the simulation of physiologically relevant system sizes while retaining the underlying chemical identity of the sugars. In our previous work, we applied the coarse-grained model to chondroitin (CH), chondroitin 4-sulfate (C4S), chondroitin 6-sulfate (C6S), and hyaluronic acid in infinitely dilute solution and studied the effects of sulfation type, ionic strength, and pH on their conformation and titration behavior (20). In the current work, we demonstrate theoretically that the model is also directly applicable to the computation of GAG osmotic pressure, and we use it to investigate mechanistically the CS chemical composition-osmotic pressure relationship. Osmotic pressure predictions are compared with experimental data of Ehrlich and others (21), and contrasted with two well-established models of polyelectrolyte solutions—the Donnan theory and the Poisson-Boltzmann cylindrical cell model. Although the ultimate aim of this line of research is to study the physiological solution conformation and mechanical properties of aggrecan, the current investigation into the solution behavior of CS is viewed as a valuable and necessary step toward that end, both for purposes of model validation and because we believe that a fundamental understanding of the solution properties of aggrecan requires a comprehensive understanding of the properties of its biochemical constituents.
MODELING
CH is a linear (unbranched) polysaccharide consisting of repeating disaccharide units of D-glucuronic acid (GlcUA) and N-acetyl-D-galactosamine (GalNAc), alternately linked in β1,3 and β1,4 glycosidic linkages (Fig. 2). C4S and C6S are modified forms of CH in which the GalNAc residue is sulfated at C4 and C6, respectively (Fig. 2). The polysaccharide constituents of aggrecan consist predominantly of CS ranging from 10 to 30 kDa, which is equivalent to ∼20–60 disaccharide units.
FIGURE 2.

Disaccharide repeat units of CH, C4S, and C6S.
Coarse-grained GAG model
We present only an overview of the coarse-grained GAG model here and refer the reader to Bathe et al. (20) for details. The model is topologically defined by the sequence of chemical and virtual bonds depicted in Fig. 3. All internal degrees of freedom including bond lengths, valence angles, and torsion angles are treated as rigid except for the glycosidic torsion angles, which predominate polysaccharide conformational flexibility (22–25). Values of the rigid internal degrees of freedom are equated with their equilibrium ensemble averages computed from room-temperature all-atom simulations of isolated, solvated disaccharides. The all-atom simulations are performed without constraints on carbohydrate bond length, bond angle, and torsional degrees of freedom employing an implicit solvent model. The conformation-dependent GAG free energy is decomposed into effective bonded and nonbonded interactions occurring between neighboring (bonded) and non-neighboring (nonbonded) monosaccharides. Bonded glycosidic torsion angle potentials of mean force (PMFs),  are calculated using simple Boltzmann inversion of the equilibrium probability distributions obtained from disaccharide simulations,
  for each linkage (β1,3, β1,4) and GAG type (CH, C4S, C6S). In the PMF expression, φ ≡ (H1 – C1 – O1 – CJ′) and ψ ≡ (C1 − O1 − CJ′ − HJ′) denote the glycosidic dihedral torsion angles (J′ = 3 and 4 for the β1,3 and β1,4 linkages, respectively), α and β denote the identities of the neighboring monosaccharides (e.g., GlcUA, GalNAc, GalNAc4S, and GalNAc6S), kB is the Boltzmann constant, and T is absolute temperature. The PMFs are conformation-dependent free energies that include the effects of specific chemical interactions (e.g., hydrogen bonding, exo-anomeric effect) occurring across each glycosidic linkage, as well as the effects of the conformational entropy of all degrees of freedom other than the glycosidic torsions, (φ,ψ).
FIGURE 3.

Definition of the coarse-grained model bonded backbone structure (thick solid lines) based on the all-atom disaccharide representation for the (top) β1,3 and (bottom) β1,4 linkages.
Electrolyte-screened electrostatic interactions between nonbonded monosaccharides are modeled using a Debye-Hückel (DH) interaction potential between monosaccharide center-of-charge sites and nonbonded steric interactions are included using a repulsive Lennard-Jones (LJ) potential acting between monosaccharide center-of-geometry sites. This simple nonbonded treatment was shown to quantitatively reproduce the experimental conformation and titration behavior of GAGs (20). Here it will be demonstrated that it reproduces their experimentally observed osmotic pressure behavior as well.
Osmotic pressure
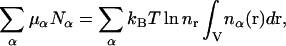
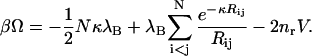
To derive the expression used to calculate the osmotic pressure of a solution of polyelectrolytes, we begin by considering N identical, fully dissociated negatively charged colloids of unit valence in a volume V at temperature T, suspended in an aqueous solution of a fully dissociated and symmetric 1:1 electrolyte. The colloid result is then applied to the case of polyelectrolytes by associating each polyelectrolyte charge site with a charged colloid and incorporating the effects of polyelectrolyte connectivity and steric excluded volume.
In the framework of Poisson-Boltzmann (PB) theory, water is modeled as a uniform dielectric with dielectric permittivity ɛ and the micro-ion (electrolyte) species are treated as spatially varying fields with number densities, nα(r) (α = ±). Each micro-ion species is in osmotic (electrochemical) equilibrium with an aqueous reservoir of fixed ionic strength with micro-ion electrochemical potentials, μr = kBT ln nr, where nα = nr and μα = μr (α = ±) are the mean number densities and electrochemical potentials of the micro-ion species in the reservoir. The total free energy of the colloidal solution is given by (26)
 |
(1) |
where 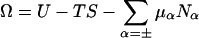 is the grand potential, or equivalently the effective Hamiltonian (excluding the colloid kinetic energy) or colloid potential of mean force, when the colloids are in configuration {RN}, where β = (kBT)−1, and Λ is the thermal de Broglie wavelength. U is the total internal electrostatic energy, S is the micro-ion entropy, and the electrochemical potential terms ensure osmotic equilibrium with the electrolyte reservoir. Ω is a free energy that depends on both the colloid configuration {RN} and the thermodynamic state (N,V,T; μr). It implicitly includes the averaged effects of the thermally and osmotically equilibrated micro-ion degrees of freedom (particle numbers and particle positions) on the colloidal interactions.
The electrostatic internal energy, U, is (27–29)
 |
(2) |
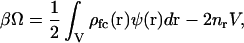
where ρfc(r) is the colloidal (fixed charge) density, ρm(r) is the micro-ion charge density, and ψ(r) is the electrostatic potential. The dependence of ρfc, ρm, and ψ on {RN} has been dropped for simplicity and the volume integral in Eq. 2 is carried out over all space.
The micro-ion entropy, S, corresponding to nonlinear PB theory, is
 |
(3) |
where each micro-ion species is treated as an inhomogeneous ideal gas. To be consistent with linearized PB theory, S[nα(r)] must be functionally expanded to quadratic order in nα(r) at a suitable expansion point,  Only then will the functional minimization of Ω, subject to the constraints of Poisson's equation and electroneutrality, yield the linearized PB equation (28). In the present study we choose
  corresponding to linearization of the PB equation at the reference (zero) potential in the reservoir, which results in the well-known Debye-Hückel equation (30,31). Although this is by far the most common choice employed in the literature, it has been shown that the optimal expansion point corresponds to the Donnan potential and its corresponding number densities (26,28,32,33). Functional expansion of S to quadratic order at this point yields
 |
(4) |
where  is the volumetric mean micro-ion number density and all volume integrals are carried out over the space accessible to the solvent.
Finally, the electrochemical potential terms are
 |
(5) |
where equality of the electrochemical potentials in the solution and reservoir has been employed.
The evaluation of Ω requires knowledge of ψ(r) and nα(r), which may be obtained self-consistently from the linearized, mean-field PB equation (30). In general, for asymmetric colloids of finite molecular volume, ψ(r), and therefore Ω, will depend on the orientation and position of all N colloids in a complex manner involving multi-body terms because of the nonlinear geometric dependence introduced into the PB equation via the low dielectric and salt-excluding colloid domains. The assumption of point colloids, however, removes that nonlinearity and results in an electrostatic potential that is a simple linear superposition of DH potentials (30,34–36),
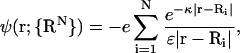 |
(6) |
where e is the electronic charge, κ = (8πλB NA cs)1/2 is the inverse Debye length, λB ≡ e2/ɛkBT is the Bjerrum length, defined to be the distance at which the Coulombic interaction energy of two monovalent charges embedded in a uniform dielectric medium is equal to kBT (λB = 7.14 Å in water at 298 K), and the dependence of ψ(r) on {RN} has been made explicit. The linearized Boltzmann relation relates nα(r) to ψ(r) in the solvent space, 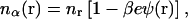 to which the mobile ion charge density is related by
  and it is reemphasized that monovalent mobile ion species have been assumed. The fixed charge density due to the colloids,
 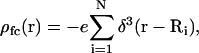 and the foregoing expressions may be used to analytically evaluate Eqs. 2, 4, and 5. The result is a closed-form solution to Ω, which in dimensionless form is (36)
 |
(7) |
The first term is the favorable electrostatic internal self-energy of the colloids, which is due to the local electrostatic energy-well that each colloid resides in because of its surrounding oppositely charged micro-ion cloud. The second term is the standard DH interaction energy, UDH(Rij), between colloids i and j, and the third term is the contribution due to the micro-ion translational (mixing) entropy.
Eq. 7 can be derived alternatively in a more straightforward manner, yet with less physical insight, by employing the generalized grand potential of linearized PB theory presented by Deserno and von Grünberg (28) (their Eq. 20),
 |
(8) |
where the Debye-Hückel expansion point,  has again been used (an overbar is used in their notation to denote the expansion point and their nb is equivalent to our nr). Evaluation of the integral in Eq. 8 leads directly to Eq. 7 (36).
Turning to polyelectrolytes, we consider for generality a monodisperse solution of M polyelectrolytes, each consisting of N/M fully dissociated charge sites of unit valence. The foregoing theory may be applied directly to this system by associating the colloids with the charge sites on the polyelectrolyte backbones. Indeed, this is the inherent assumption of the common DH model of polyelectrolytes. Neglecting the conformation-independent polymer kinetic energy, the effective Hamiltonian for a specific conformation of polyelectrolytes is assumed to consist of independent electrostatic and non-electrostatic contributions, Heff = Felec + Fnon-elec, where the conformation-dependent electrostatic free energy is equated with the colloid result, Felec ≡ Ω, and Fnon-elec contains all non-electrostatic bonded contributions and nonbonded contributions (see Eq. 4 in Bathe et al., (20)), assumed independent and decoupled from the electrostatic free energy. Of course, this assumes that excluded volume effects, as modeled, for example, by an LJ potential, do not affect Felec. This assumption is most suitable for state points at which the Debye length is greater than the length scale of LJ interactions.
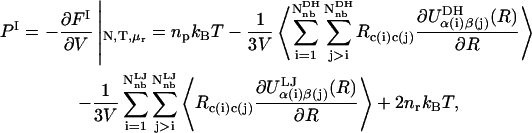
The polyelectrolyte osmotic pressure, Π, is defined as the difference in pressure between the polyelectrolyte (I) and aqueous electrolyte reservoir (II) compartments, Π ≡ PI − PII, where the pressure in the latter is given by  in the van't Hoff approximation, consistent with PB theory, and FII denotes the total free energy of the reservoir solution. Assuming that the only nonbonded contribution to Fnon-elec is an LJ potential, the pressure in the polyelectrolyte compartment may be derived by applying the molecular virial theorem to Eq. 1, replacing Ω with Heff (37),
 |
(9) |
where FI denotes the total free energy of the polyelectrolyte-aqueous-electrolyte solution and np is the mean number density of polyelectrolyte molecules and accounts for their translational (mixing) entropy contribution to the osmotic pressure. Brackets denote ensemble averaging over the polyelectrolyte conformational degrees of freedom at fixed temperature and volume and Rc(i)c(j) is the distance between the centers of mass of the polyelectrolyte molecules to which nonbonded sites i and j belong. The double summations run separately over all nonbonded DH and LJ sites. When the minimum image convention is employed, the double summations in Eq. 9 are performed over all nonbonded (nb) sites, including inter- and intramolecular interactions. Inclusion of the latter is important because it allows for the possibility that charge sites on different images of the same parent chain interact, effectively making an intermolecular contribution to the pressure (37).
Combining the expressions for the pressure in the polyelectrolyte and reservoir compartments, the final expression for the osmotic pressure is
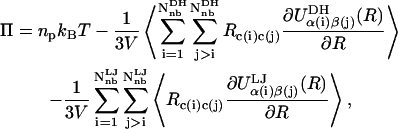 |
(10) |
where it is noted that the micro-ion translational entropy contribution has canceled with its counterpart in the reservoir due to the choice of the reservoir potential as our linearization point for the PB equation. The validity of Eq. 10 has been confirmed by computing the osmotic pressure for a static FCC lattice of point charge colloids and comparing the results with those obtained using the PB spherical cell model for colloids (36). The result in Eq. 10 has been presented previously in similar form in the colloidal literature (e.g., Eq. 3.10 in Stevens et al., (38)); however, to the best of our knowledge, it has not been derived and presented for polyelectrolytes such as those considered here.
As discussed in our previous work (20), several important assumptions are made in deriving the coarse-grained model that limit its ability to predict CS osmotic pressure quantitatively. Principal among these approximations are the neglect of the low dielectric and salt-excluding properties of the GAG molecular domain and the linearization of the Poisson-Boltzmann equation about the (zero) reservoir electrostatic potential. The effects of each assumption on the ability of the model to predict Π quantitatively have been studied in detail, and it was demonstrated that the former and latter approximations lead to under- and overpredictions of Π, respectively (36). Additionally, the fact that CS chains have a linear charge density of 1.4 charge units per Bjerrum length (assumed to equal 7 Å in water at room temperature) along the backbone chain implies, according to the Manning criterion, that a fraction of counterions will condense in the vicinity of the chain, effectively renormalizing its linear charge density to 1 (39). However, as discussed in our previous work, it is our view that the linear charge density of CS is close enough to the critical value of 1 that renormalization is not justified without more detailed theoretical and experimental investigation (e.g., explicit solvent and counterion simulations should be performed accounting for the molecular nature of water, counterions, and CS to accurately determine its effective charge density, because the Manning criterion assumes a linear array of equally spaced charges and ignores molecular details of the solvent and polymer). Despite the known shortcomings of the model, comparison with experimental osmotic pressure data in Results and Discussion suggests that the coarse-grained model is still predictive of CS osmotic pressure. Moreover, qualitative trends in the results presented, such as the effects of sulfation pattern or type on Π, for example, are expected to be unaffected by the precise level of accuracy of the model.
Finally, with regard to biologically relevant solvent environments, it is noted that the coarse-grained model does not consider the effects on Π of divalent cations such as calcium, which has been shown experimentally to reduce somewhat CS osmotic pressure at physiological ionic strength when present in concentrations as low as 0.0018 M (21), or the effects of different types of monovalent ions (e.g., Na+ versus K+). Although it is important to consider reductions in GAG osmotic pressure due to the presence of calcium, particularly considering the fact that C4S has been shown to have a higher propensity to bind Ca2+ than C6S (25), here we focus on the effects of 4- vs. 6-sulfation in the presence of monovalent salt only and reserve an investigation accounting for divalent ions to future work.
Statistical description of sulfation
In addition to investigating the differences between 4- vs. 6-sulfation on CS osmotic pressure, it is of interest to study how the distribution of sulfates (4- or 6-) along individual CS chains affects the pressure (i.e., the sulfation pattern). To this end, we employ a traditional first-order Markov model for the statistical description of copolymers (40).
Following Fredrickson and Milner (41) and Fredrickson and others (42), copolymers are assumed to consist of two types of monomers, A and B. In the present context A and B represent sulfated and unsulfated disaccharide monomers, respectively, and each chain has the same degree of polymerization. The copolymer sequences are statistically determined by the overall fraction of A, f ≡ p(A), and the transition probability matrix,
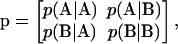 |
(11) |
where p(K/L) is the conditional probability that a monomer of type K immediately follows a monomer of type L on the chain. Conservation of probability requires that 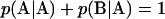 and
and 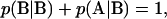 and stationarity of the Markov process requires that
  be satisfied. These three constraints leave only one degree of freedom in p, which is chosen to be the linear combination,
  The two parameters (f, λ) then fully specify the statistical description of AB copolymers in the system, where f ∈[0,1] and λ∈[−1,1].
As demonstrated by Fredrickson and others (42), λ denotes the strength of the chemical correlations along the chain. The value λ = −1 requires that  resulting in an alternating AB copolymer where there is only one molecular species present. When λ = 0, there are no chemical correlations between A and B monomers, resulting in a mixture of ideal random AB copolymers. Finally, λ = 1 results in a mixture of A and B homopolymers with population fractions f and (1 − f), respectively.
SIMULATION PROTOCOL
CS solutions up to polymer concentrations of 80 mg/mL and reservoir ionic strengths between 0.15 M and 5 M were simulated at room temperature (298 K) in a cubic cell employing periodic boundary conditions. The equilibrium distribution of states in the constant (N,V,T; μr)-ensemble was generated using the Metropolis Monte Carlo algorithm with the standard acceptance criterion,  where r is a pseudo-random deviate between 0 and 1, and ΔHeff is the change in the effective Hamiltonian between successive conformations (43).
Trial conformations were generated using glycosidic torsion angle pivot moves (44,45), rigid chain translation moves, and rigid chain rotation moves with frequencies of 0.4, 0.4, and 0.2, respectively, where rigid rotations were performed about the instantaneous chain center-of-mass. Detailed balance was satisfied by selecting at random the move types and the chains or glycosidic torsion angles to which they were applied. Maximum move sizes were adjusted on-the-fly to maintain an acceptance rate of 40–60%. Finite size effects on GAG conformation and osmotic pressure were investigated and it was found that at least 100 chains must be simulated for the highest GAG molecular weight (32 disaccharides) and concentration considered in this study. The DH potential was truncated at three Debye lengths and shifted by a constant factor to equal zero at the cutoff and a doubly linked cell list algorithm was employed for the computation of nonbonded interactions.
Although the simulation appears to be carried out in a standard canonical (N,V,T) ensemble, it is important to note that it is, in fact, carried out in the semi-grand canonical ensemble (N,V,T; μr) without explicit sampling of the micro-ion particle numbers and positional degrees of freedom. That sampling has already been performed implicitly in our utilization of PB theory to derive Heff, which includes the thermally and electrochemically equilibrated effects of the micro-ion degrees of freedom on the electrostatic free energy of any polyelectrolyte conformation.
Initial conformations of helical GAGs were generated with random orientations and locations in the simulation cell. 104 cycles were subsequently used to equilibrate the system and 104 cycles were used to compute averages, where a cycle consists of N conformation-altering moves, N being the number of monosaccharides in the system. Efficient sampling of the osmotic pressure was achieved with this relatively low number of cycles (relative to explicit solvent simulations of polyelectrolytes, for example) because of the strong, long-ranged electrostatic interaction between GAGs that maintains them well-separated at physiological ionic strength (0.15 M NaCl). Additionally, the absence of the micro-ion and water degrees of freedom in the model, which would otherwise severely hamper efficient sampling of polyelectrolyte conformation space, lead to significantly improved computational efficiency.
Thus, although our coarse-graining of the atomistic description of GAGs is partly responsible for enabling the simulation of the large system sizes considered in this study, the computational efficiency of the model is largely due to the use of mean-field PB theory for the water and micro-ion degrees of freedom. Indeed, use of the effective Hamiltonian not only enhances the sampling of polyelectrolyte conformational space by preaveraging over the solvent degrees of freedom, it also eliminates the need to treat long-range Coulombic interactions using algorithms such as (particle mesh or conventional) Ewald summation. Of course, the relative speedup obtained by coarse-graining the solvent is maximal at dilute GAG concentrations, and as the GAG concentration is increased the speedup achieved by eliminating the solvent degrees of freedom decreases proportionately (holding the number of GAG molecules fixed).
As an example, consider that a typical simulation consists of 100, 16-disaccharide GAG chains, constituting a total of 6400 nonbonded interaction sites in the coarse-grained model representation. This compares with ≈80,000 nonbonded interaction sites that would be required in an explicit, all-atom GAG model, representing a more than 10-fold reduction in the number of GAG interaction sites. Use of the Poisson-Boltzmann equation for the water and mobile ion degrees of freedom, however, eliminates 12,000,000 water and 1000 mobile ion interaction sites, respectively, at 0.15 M NaCl and a GAG concentration of 100 mg/mL. At the lower GAG concentration of 10 mg/mL those figures increase by factors of 10. Thus, the GAG concentrations and system sizes considered in this study are in a regime where a coarse-grained treatment of both the solvent and polysaccharide degrees of freedom is required to obtain a computationally tractable model in terms of both memory and CPU-time requirements. Despite the progress made in simulating large GAG system sizes via coarse-graining, however, we are still limited to reservoir ionic strengths greater than 0.1 M, due to the DH potential cutoff of three Debye lengths that puts a lower limit on the size of the simulation cell employed.
RESULTS AND DISCUSSION
Molecular weight and reservoir ionic-strength dependence
The osmotic pressure, Π, of fully sulfated C4S at physiological ionic strength exhibits strongly nonideal behavior for each molecular weight considered in Fig. 4 (4–32 disaccharides or 1.8–14.6 kDa, using 457 Da/disaccharide) up to the maximum physiological concentration of 80 mg/mL. A virial expansion may be used to quantify the extent of nonideality in this dilute to semidilute regime (the overlap concentration is ≈300 and 1 mg/mL for 4- and 32-disaccharides, respectively),
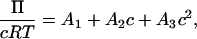 |
(12) |
where  is the number average molecular weight, R = 8.3145 × 10³ Pa L/K mol is the molar ideal gas constant, c is the concentration (g/L or mg/mL), and the virial expansion has been truncated after the third virial coefficient, A3. In the context of the Debye-Hückel model used, A1 is due solely to the ideal gas or van't Hoff contribution to the osmotic pressure that results from the polyelectrolyte mixing entropy, because the mobile ion translational entropy contribution is equal in the polyelectrolyte and reservoir compartments. As expected, 1/A1 is equal to
  in the monodisperse sample of C4S considered and A1 monotonically approaches zero with increasing degree of polymerization (Table 1). The second virial coefficient, A2, represents the contribution of two-body, intermolecular GAG interactions to the osmotic pressure, and together with A3 quantifies the deviation of the osmotic pressure from ideality.
FIGURE 4.

Dependence of fully sulfated C4S osmotic pressure on polymer concentration for various molecular weights (4–32 disaccharides or 1.8–14.6 kDa) at physiological ionic strength (0.15 M). Statistical error bars are smaller than the symbols.
TABLE 1.
Molecular-weight dependence of the virial coefficients for C4S in contact with a 0.15 M 1:1 electrolyte reservoir

|
||||
|---|---|---|---|---|
| # disaccharides | kDa | A1 × 10−4(mol/g) | A2 × 10−6 (mol L/g2) | A3 × 10−8 (mol L2/g3) |
| 4 | 1.8 | 5.5 | 7.0 | 4.6 |
| 8 | 3.7 | 2.7 | 5.2 | 5.3 |
| 16 | 7.3 | 1.4 | 4.4 | 5.7 |
| 32 | 14.6 | 0.7 | 4.0 | 5.9 |
Increasing the reservoir ionic strength for 16-disaccharide (7.3 kDa) C4S decreases Π significantly up to 1.0 M added salt (Fig. 5 and Table 2), demonstrating the long-recognized importance of electrostatic effects in determining CS osmotic pressure (3). Above 1.0 M ionic strength, intermolecular electrostatic interactions are nearly completely screened so that further increases in the ionic strength result in only a small decrease in Π, which is dominated by the polyelectrolyte van't Hoff (mixing entropy) contribution and steric excluded volume effects in this regime. Qualitatively similar results were found in the experimental study of Ehrlich and others (21) (their Table 3).
FIGURE 5.

Reservoir ionic-strength dependence of C4S osmotic pressure (16-disaccharides). Statistical error bars are smaller than the symbols.
TABLE 2.
Reservoir ionic strength dependence of the virial coefficients for C4S (16-disaccharides or 7.31 kDa)
| I (M) | A1 × 10−4 (mol/g) | A2 × 10−6 (mol L/g2) | A3 × 10−8 (mol L2/g3) |
|---|---|---|---|
| 0.15 | 1.4 | 4.3 | 5.8 |
| 0.5 | 1.4 | 2.3 | 0.7 |
| 1.0 | 1.4 | 1.6 | 0.3 |
| 2.0 | 1.4 | 1.6 | 0.1 |
| 5.0 | 1.4 | 1.6 | * |
Denotes that the value is smaller than the error in the calculation.
Effect of sulfation type and pattern
Pertaining to the sulfation type and pattern of CS, there are two biologically relevant questions that we wish to address. First, does changing the type of sulfation from 4- to 6-sulfation of the GalNAc residue affect Π? Second, given a fixed type of sulfation and mean overall degree of sulfation (e.g., 50% of all disaccharides are sulfated), does the statistical distribution (pattern) of sulfates along individual chains affect Π?
To answer the first question, we studied independent solutions of pure C4S and pure C6S at physiological ionic strength (16-disaccharides). Interestingly, differences in the osmotic pressure of the two solutions were found to be negligible (Fig. 6 a). This result is attributed to the small difference in position of the 4- vs. 6-carbon (∼2 Å) relative to the mean intermolecular spacing of the CS chains (∼20 Å at 80 mg/mL), which remain maximally spaced in physiological ionic strength solution (Debye length ∼10 Å) due to electrostatic repulsion. Intermolecular charge-site radial distribution functions (RDFs), which were found to be highly similar for the two types of CS, support this interpretation (36).
FIGURE 6.

Effect of 4- vs. 6-sulfation (left, 16-disaccharides) and 4-sulfation pattern (right, 32-disaccharides) on osmotic pressure at physiological ionic strength (0.15 M NaCl). Statistical error bars are smaller than the symbols.
To investigate the effect of sulfation pattern on Π, we varied the statistical distribution of sulfates on C4S chains using the statistical description of copolymerization outlined in Modeling.
The effect of sulfation pattern on Π was investigated for 24-disaccharide C4S chains by setting the overall average degree of sulfation to 50% (f = 0.5) and varying λ between −1 and 1 (Fig. 6 b). Interestingly, Π is relatively insensitive to λ, varying by <10% at even the highest computed concentration of 80 mg/mL. At this molecular weight and reservoir ionic strength, intermolecular electrostatic interactions dominate in determining Π. They may be decomposed into carboxylate-carboxylate (c-c), carboxylate-sulfate (c-s), and sulfate-sulfate (s-s) interactions, the first of which is affected only indirectly by λ through changes in the mean conformation of CS chains. Similarly, the number of intermolecular c-s interactions is unaffected by λ because each sulfate group is capable of interacting with all carboxylate groups that do not belong to the same chain. Thus, the only electrostatic interactions that are directly affected by λ are s-s interactions, because when sulfates are placed on the same chain the number of intermolecular s-s interactions decreases proportionately. In other words, increasing the blockiness of sulfation in essence deactivates intermolecular s-s interactions by concentrating sulfate groups on single chains. For this reason, Π is lowest for the case of λ = 1 (a 50:50 mixture of CH and 100% sulfated C4S homopolymers). Nevertheless, the magnitude of the reduction in Π is small for λ = 1 because as explained, c-c, c-s, and many intermolecular s-s interactions are not affected directly by λ. Intermolecular charge group RDFs, again, corroborate this interpretation (36).
Effect of CS intrinsic stiffness
Like most polysaccharides, GAGs are intrinsically stiff polymers due to the limited mobility present in the glycosidic linkage torsions intervening conformationally inflexible monosaccharides. Unlike other polysaccharides, however, the backbone chain of GAGs is additionally stiffened by electrostatic interactions (20,22,46). It is of fundamental biomechanical interest to understand the role that GAG stiffness plays in determining its osmotic pressure and compressibility, as well as to ascertain the relative contributions of intrinsic versus electrostatic stiffness to those properties.
To address these questions, we recomputed the osmotic pressure of C4S after (1), fixing the glycosidic torsion angles at their minimum energy values so that the chains were rigid and highly extended, and (2), setting the glycosidic PMFs to be independent of the torsion angle values,  which made the glycosidic torsions effectively freely rotating and thus the chains intrinsically highly flexible relative to the real molecule.
The osmotic pressure of the rigid-chain model (C4S-RIGID, 20-disaccharides) is only slightly higher than that of the real molecule (C4S, 20-disaccharides) at the ionic strengths (0.15 and 1 M NaCl) and GAG concentrations (up to 80 mg/mL) considered (Fig. 7 a). This finding is attributed to the fact that C4S is nearly rodlike at each ionic strength, as demonstrated by the ratio of the mean-square end-to-end distance to the mean-square radius of gyration (Fig. 7 b), where 〈s2〉/〈r2〉 = 11 and 6 for a rigid rod and a random coil, respectively. The osmotic pressure of the freely-rotating chain model (FRC), however, is significantly lower than that of the real C4S molecule (≈50% at 0.15 M NaCl and 80 mg/mL; Fig. 7 a) because of its more compact, coil-like conformation, 〈s2〉/〈r2〉 ≈ 6–7 (Fig. 7 b), which delays the concentration-dependent onset of intermolecular electrostatic interactions that contribute to the osmotic pressure. The same qualitative differences in the experimental osmotic pressure behavior of flexible- (sodium poly(styrene sulfonate)) and stiff-chain (150-basepair DNA, sodium pectinate, and sodium (carboxymethy1)cellulose) polyelectrolytes has been noted previously (see Wang and Bloomfield (47) and references therein).
FIGURE 7.

(a) Osmotic pressure of C4S compared with C4S models assuming rigid (C4S-RIGID) and freely rotating (C4S-FRC) glycosidic torsion angles at 0.15 and 1.0 M ionic strength (20-disaccharides) and (b) ratio of mean-square end-to-end distance to mean-square radius of gyration for the three models. The osmotic pressure of the C4S and the C4S-RIGID models nearly coincide at 1 M ionic strength in a and the conformation of the C4S-RIGID model is shown only once in b because it is ionic-strength independent. Statistical error bars are smaller than the symbols in a and b.
Considering that the intrinsic persistence length, a0, of C4S is on the same order as the contour length of the 20-disaccharide chains examined ((a0 = 96 Å) ≈ (L = 200 Å)) (20)—suggesting that the chains are highly extended even in the absence of electrostatic interactions—it is reasonable to expect that its osmotic pressure will be similar to that of a solution of rigid rods. As demonstrated by the C4S-FRC model, however, when the intrinsic stiffness of C4S is reduced considerably ((a0 = 8 Å) ≪ (L = 200 Å)), the chains collapse because electrostatic interactions are apparently insufficient to maintain an extended, rodlike conformation. Taken together, these results suggest that at physiological ionic strength the osmotic pressure of C4S (20-disaccharides) is similar to that of a solution of rigid rod polyelectrolytes, and that the intrinsic, not electrostatic, backbone stiffness of C4S leads to this behavior. Similar results are to be expected for other GAGs in this molecular weight regime, such as CH, C6S, and hyaluronic acid, because they have a similar intrinsic stiffness to C4S.
It is also worthy of note that the conformations of the C4S and C4S-FRC models do not depend significantly on polyelectrolyte concentration at either ionic strength (0.15 or 1 M), even well above the overlap concentrations of 1 and 20 mg/mL, respectively. This is because each molecule is already nearly in its unperturbed, θ-state under dilute conditions because of electrostatic screening caused by the electrolyte species. Thus, additional screening incurred by chain overlap has insignificant consequences on chain conformation.
Effect of steric excluded volume
Non-electrostatic, steric interactions lead to a reduction in polymer configurational entropy via molecular volume exclusion, which tends to increase Π. In previous theoretical analyses of aggrecan (48,49) and CS (21) osmotic pressure, it was assumed that the non-electrostatic (bare or steric) excluded volume contribution to Π is independent of ionic strength and equal to its limiting high ionic-strength value. Accordingly, it was equated with the (assumed ionic-strength independent) configurational entropy contribution of the GAGs, which is calculated in a straightforward manner using mean-field Flory-Huggins theory (48–50). The remaining non-electrostatic contribution to the osmotic pressure is due to GAG mixing entropy, and is given by the van't Hoff (ideal gas) term in Eq. 10. This decoupling of electrostatic and non-electrostatic contributions to the solution free energy then naturally enables the use of the Donnan theory or the Poisson-Boltzmann cylindrical cell model to calculate the electrostatic contribution to Π, and has long-standing precedence in the modeling of polymer solutions and networks (50,51). In reality, however, intermolecular electrostatic interactions mediate non-electrostatic (steric) interactions by introducing an additional interaction length scale, namely the Debye length. This additional length scale renders the non-electrostatic free energy potentially dependent on ionic strength.
To test the validity of the foregoing assumption that the steric excluded volume contribution to Π is independent of ionic strength, we recomputed Π at various ionic strengths with the repulsive LJ potential deactivated so that only electrostatic interactions were present in the model (Fig. 8). Interestingly, although Π differed significantly between the two models in the high ionic-strength limit of 5 M NaCl, as expected (DH, electrostatics only and DH-LJ, electrostatics plus steric interactions), Π was nearly identical in the two models at 0.15 M. Because the polymer mixing entropy contribution is independent of ionic strength, this finding suggests that steric interactions make a negligible contribution to Π at 0.15 M ionic strength and thus that their contribution is in fact significantly dependent on the reservoir ionic strength. The ionic-strength dependence of the steric contribution to Π arises because repulsive electrostatic interactions maintain CS chains well separated in solution at 0.15 M ionic strength and the physiological GAG concentrations considered (20−80 mg/mL, which corresponds to mean interchain spacings of ≈20−40 Å), despite the disordering effects of entropy, which excludes shorter-ranged steric interactions from occurring (Debye length ≈10 Å at 0.15 M compared to steric excluded volume length scale of ≈4 Å). In contrast, at 5 M ionic strength, electrostatic interactions are nearly fully screened (Debye length ≈1 Å), allowing chains to come into close proximity and to interact sterically. Chain center-of-mass RDFs corroborate the foregoing interpretation (36). Intermolecular steric interactions are also mediated by increasing chain stiffness (or persistence length) that results from decreasing ionic strength. The 16-disaccharide CS chains considered are rodlike even in the high ionic-strength limit (Bathe et al., (20) and Fig. 7), however, so this effect should be of secondary importance in comparison to the dominance of electrostatic over bare intermolecular-excluded volume at low ionic strength.
FIGURE 8.

C4S osmotic-pressure (16-disaccharides) dependence on ionic strength with the repulsive LJ potential activated (DH-LJ) and deactivated (DH). Differences are everywhere <1% for 0.15 M ionic strength. Statistical error bars are smaller than the symbols.
Comparison with experiment and theory
CS osmotic pressure has been investigated experimentally at different ionic strengths (0.015–2 M NaCl) using equilibrium dialysis (21). In that study, the fractions of 4- vs. 6-sulfated disaccharides were 30% and 70%, respectively, the overall fraction of sulfated disaccharides was measured to be 80% (their Table 1), but the molecular-weight distribution of the sample was unknown (C. P. Winlove, personal communication). Considering that Π depends strongly on CS molecular weight for chain lengths <∼20 disaccharides (Fig. 4), a rigorous comparison between the coarse-grained model predictions and the experimental data is impossible. As an alternative, we compare the osmotic pressure of monodisperse samples of 8-, 16-, and 32-disaccharide C4S chains with experiment and draw tentative conclusions about the predictive capabilities of the model. Consistent with experiment, CS chains were assumed to be 80% sulfated, ideal random C4S copolymers (λ = 0), where 6-sulfation is neglected because it was found that the type of sulfation has a negligible influence on Π (Fig. 6 a).
At physiological ionic strength (0.15 M), the coarse-grained model underpredicts the experimental Π for the highest molecular weight considered (14.6 kDa or 32-disaccharides), but agreement improves successively as the chain length is decreased to 8-disaccharides (3.7 kDa) because of the concomitantly increasing magnitude of the van't Hoff contribution (Fig. 9 a). Similar disagreement at high molecular weight and successive improvement in agreement as the molecular weight is decreased is observed at 2 M ionic strength.
FIGURE 9.

Experimental (MW unknown; 80% sulfated; 30% C6S, and 70% C4S) (21) CS osmotic pressure compared with (a) coarse-grained molecular model (10-, 20-, and 40-disaccharides; 80% sulfated, f = 0.8; random copolymer, λ = 0) and (b) the Donnan theory, the PB cylindrical cell model (a = 5.5 Å; d = 5 Å), and the mean-field theory estimate for the steric excluded volume contribution (SEVC) to Π.
In addition to experiment, it is desirable to compare the coarse-grained model osmotic pressure predictions with those of other, well-established models of polyelectrolyte solutions. Two alternative models that are commonly used to predict the electrostatic contribution to the osmotic pressure of polyelectrolytes are the Donnan theory (52) and the PB cylindrical cell model (53). Each has been applied previously to predict GAG excess osmotic pressure in cartilage, as well as in solutions of aggrecan and GAGs (21,54). Here, we use each to compute the electrostatic contribution to Π. We also use mean-field Flory-Huggins theory to compute the steric excluded volume, configurational entropy contribution to Π in the high ionic-strength limit (48–50).
In ideal Donnan theory, the osmotic pressure of a charged colloidal species in equilibrium with an aqueous 1:1 salt reservoir is given by 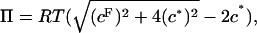 where cF is the (polymer) fixed charge density, c* is the reservoir ionic strength, R is the molar ideal gas constant, and ideality of the mobile ion species has been assumed. Donnan theory invokes only the assumptions of electroneutrality, and electrochemical equilibrium and ideality of the mobile ion species (i.e., activity coefficients equal unity).
In the cylindrical cell model, each polyelectrolyte molecule is viewed as uniformly spaced from its nearest neighbors and correlations in molecular positions are assumed absent. This allows for the defactorization of the semi-grand canonical partition function corresponding to the N-polyelectrolyte-aqueous-electrolyte system into N identical grand canonical partition functions, each corresponding to a single polyelectrolyte-solution domain. The polyelectrolyte is treated as an infinitely long, uniformly charged, rigid cylinder of radius a, surrounded by an outer cylindrical annulus of aqueous electrolyte solution, which is modeled using PB theory. The PB equation is solved in cylindrical coordinates subject to the boundary conditions of fixed polyelectrolyte surface-charge density and zero electrical field flux at the outer boundary (symmetry or electroneutrality condition). The cylindrical cell model contains only two free parameters—the polyelectrolyte radius and its linear charge density—each of which may, in principle, be determined from structural data (e.g., scattering data) (55). In practice, however, the polyelectrolyte radius and linear charge density must be adjusted, sometimes significantly, to fit multiple types of experimental data for the same molecule (e.g., osmotic pressure and titration data) (21,54,56,57). In applying the cylindrical cell model to calculate Πelec, values must be chosen for the structural parameters, a, the polyelectrolyte radius and d, the linear spacing between charge groups. The value of the latter is fixed by the maximum end-to-end distance per monosaccharide, which is 5 Å for CS, and the value of the former was chosen to be 5.5 Å, consistent with the previous osmotic pressure modeling study of Buschmann and Grodzinsky (54). The surface-charge density was chosen to reflect the 80% mean sulfation measured experimentally.
Osmotic pressure results from the Donnan theory and the nonlinear NLPB cylindrical cell model are compared with experiment (data of Ehrlich et al. (21)) in Fig. 9 b. If one assumes tentatively that at 0.15 M ionic strength non-electrostatic contributions to Π are negligible, then it may be concluded that the cylindrical cell model performs well at that state point whereas the Donnan theory overestimates Π. Similarly, if it is assumed at 2 M ionic strength that the electrostatic contribution to Π is zero—consistent with experimental observations (21)—then the cell model is predictive at that state point too, whereas the Donnan theory again overestimates the electrostatic contribution to Π. If our tentative assumption regarding the predominance of the electrostatic contribution to Π at 0.15 M ionic strength is removed, then agreement between each model and experiment is worsened because the electrostatic contribution to Π would be less than the experimental Π shown in Fig. 9 b.
In the high ionic-strength limit, the mean-field lattice treatment of Flory-Huggins theory may be applied to calculate the steric excluded volume contribution to Π arising from polymer configurational entropy. In that model, the number of permissible polymer configurations is counted assuming that each polymer monomer occupies a successive lattice site. The effects of volume exclusion are incorporated in a mean-field manner by reducing the number of accessible configurations on the lattice based on the overall polymer volume fraction in solution. The resulting osmotic pressure for a monodisperse polymer sample is Πconf = c2RT/[M0(ρ0 − c)], where c is the polymer concentration (mg/mL), M0 is the molecular weight of the polymer repeat unit (457 Daltons for C4S/C6S), and ρ0 is the mass density of desiccated polymer (700 mg/mL for CS). The mixing entropy contribution to Π could also be calculated in a straightforward manner if the molecular weight of the CS sample interrogated experimentally were known, using Πmix = cRT/M, where M is the polymer molecular weight. If one tentatively assumes that, experimentally, the contribution of Πmix to Π were negligible, then one would conclude from Fig. 9 b that the mean-field result for Πconf is quantitatively predicted (Πmix/Πconf = 0.6, 0.3, and 0.15 for 10-, 20-, and 40-disaccharide CS-GAGs, respectively). However, the mean-field result is noticeably higher than that predicted by the coarse-grained model (Fig. 9 a, 2 M) even with Πmix included in the latter. This is likely due to the failure of the mean-field treatment to account for polymer-polymer spatial correlations.
CONCLUSIONS AND OUTLOOK
As noted in the Introduction, the chemical composition of the constituent CS chains present on aggrecan varies considerably with the anatomical site and depth of articular cartilage, as well as with the age of the organism and disease state of the tissue. Given the fact that CS plays a fundamental role in determining the compressive mechanical properties of the tissue and that chondrocytes—the cells that maintain the matrix—are continuously subject to compressive mechanical loading in their biomechanical environment, it is of primary biological interest to understand how changes in CS chemical composition affect its mechanical properties. A comprehensive understanding of the biomechanical properties of GAGs and proteoglycans is also of fundamental interest to biology and bioengineering because of their widespread presence in biological tissues and their use in biomaterials applications.
Confirming results of previous experimental investigations, we find that CS sulfation type (4- vs. 6-sulfation) has a negligible influence on Π, which is primarily determined by CS fixed-charge density (21,58). Unlike those studies, however, we were also able to probe specifically the effects of sulfation pattern on CS osmotic pressure. Similarly to sulfation type, sulfation pattern was also found to be inconsequential on Π for CS chains that are moderately (50%) sulfated, as might be found in arterial tissue (59). This finding is attributed to the fact that the predominant contribution to Π arises from intermolecular carboxylate-carboxylate and carboxylate-sulfate interactions, neither of which is affected by variation of sulfation pattern at fixed average overall degree of sulfation. An important biological consequence of these findings is that, in synthesizing proteoglycans with the aim of achieving a desired matrix osmotic pressure and compressibility, cells are not constrained by sulfation type and pattern—the specification of which may be reserved for functions related to biochemical signaling.
In addition to variations in CS chemical composition, the relative contributions to Π of intrinsic versus electrostatic CS conformational stiffness were probed. By deactivating the bonded potentials of mean force associated with the glycosidic linkage torsion angles, thereby making the CS chains intrinsically highly flexible, it was demonstrated that it is indeed the intrinsic, not electrostatic, stiffness of CS that makes its osmotic pressure a strongly increasing function of polyelectrolyte concentration at ionic strengths equal to or greater than physiological (0.15 M), much like a solution of charged rigid rods (for the 20-disaccharide chains probed). This finding is likely generally applicable to charged polysaccharides in this regime of molecular weight, and makes the important conceptual distinction that CS behaves like a charged rod not because of its electrostatically induced stiffness, but because it is an intrinsically stiff polymer. Whether Nature utilized this feature of polysaccharides to its benefit in designing the extracellular matrices of biological tissues in their relatively high ionic-strength environment of 0.15 M remains an open yet intriguing question.
There is some ambiguity in the literature regarding the role of steric excluded volume interactions in determining CS and aggrecan osmotic pressure at physiological ionic strength (21,48,49,54,58). By deactivating the repulsive LJ potential (i.e., steric interactions) in the coarse-grained model, we were able to demonstrate that it plays a negligible role in determining Π at physiological GAG concentrations and ionic strength because intermolecular electrostatic interactions maintain GAGs maximally spaced and out of the range of steric interactions. In contrast, steric interactions are paramount at high ionic strengths when electrostatic interactions are highly screened so that chains may come into close proximity. Although the latter finding is consistent with conclusions drawn by experimental (21) and theoretical (48,49) investigators, the former finding is novel and is in contradiction to assumptions made in the application of theoretical models such as the Poisson-Boltzmann cylindrical cell model and Flory-Huggins theory to predict GAG or aggrecan osmotic pressure (21,48,49). In those studies, it was assumed that the magnitude of the GAG steric, or bare, excluded volume contribution to Π is independent of ionic strength and equal to its value in the high ionic-strength limit (when it is equal to the non-electrostatic, polymer configurational entropy contribution to the osmotic pressure). In contrast, the findings of this study clearly indicate that the magnitude of steric effects is dependent on ionic strength and reduced to 0 by 0.15 M. Although the contribution of GAG configurational entropy to the osmotic pressure at 0.15 M ionic strength was not calculated explicitly in the present study, a natural consequence of enhanced intermolecular electrostatic interactions that maintain chains maximally spaced in solution at low ionic strength is of course to reduce the importance of polymer-polymer correlations and the related polymer configurational entropy contribution to Π (the effects of internal chain configurational entropy were shown to be negligible in Fig. 7 a). Indeed, this is the basis for the success of the Poisson-Boltzmann cylindrical cell model—it relies on a defactorization of the N-polymer partition function into N independent and equal partition functions—in predicting the osmotic pressure of strongly charged polyelectrolyte solutions such as aggrecan and GAGs at 0.15 M ionic strength (53,54). Of course, our findings are based on an approximate molecular model that contains numerous potentially limiting assumptions, including an idealized (spherically symmetric) model of steric interactions and the use of suboptimal Debye-Hückel theory, and we have only examined a limited molecular-weight-concentration regime. Nevertheless, the foregoing findings merit further investigation in this regard. Indeed, the concept of competing electrostatic and steric excluded volume length scales is well established in polyelectrolyte solution theory (60–62), and the assumption of independent electrostatic and non-electrostatic free energy contributions has been scrutinized recently in polyelectrolyte network solutions as well (63). Finally, our results bring to light the importance of measuring the molecular-weight distribution of the GAG sample used in investigating osmotic pressure experimentally due to the potentially significant contribution of GAG mixing entropy to Π.
Regarding the use of simpler theoretical models than the coarse-grained model to predict Π, the finding that sulfation type and pattern and steric interactions have minimal effects on Π certainly justifies their use over the considerably more complex and computationally expensive coarse-grained model. This is particularly the case considering that, with a judicious choice of model parameters, the cell model is able to predict experimental osmotic pressure data quantitatively. Based on previous modeling and experimental studies that have demonstrated the similarity of CS and aggrecan osmotic pressure (when measured as a function of fixed charge density) (54,58,64), similar conclusions for the utility of the coarse-grained model, or lack thereof, may be anticipated in applying it to predict the osmotic pressure of aggrecan solutions. However, as with other comb polymers (65–71), the conformation of aggrecan is anticipated to have a significant dependence on CS chain length, sulfation density, and grafting density on the protein backbone. Aggrecan conformation is relevant to the nonequilibrium mechanical properties of cartilage (e.g., via polymer entanglement) as well as possibly to the modulation of enzyme binding affinity, and its investigation clearly requires the use of a molecular-based model such as that developed and applied herein. Moreover, it is only through the use of more detailed, higher-order models such as that employed here that the use of simpler models may, in the end, be justified rigorously, and the theoretical basis for their validity understood fundamentally.
Acknowledgments
Note added in proof: During the proof-revision stage of this work, a related experimental study appeared in this journal (Chahine et al. (2005) 89:1543–1550). In that study, similar observations to ours were made regarding the effects of sulfation type and steric excluded volume on CS osmotic pressure.
Fruitful discussions with Anna Plaas, Timothy Hardingham, Markus Deserno, and Luc Belloni are gratefully acknowledged, as is funding from the Department of Defense (National Defense Science and Engineering Graduate Fellowship to M.B.) and the National Institutes of Health (grants No. GM065418 to B.T. and No. AR45779 to A.J.G.).
Mark Bathe's present address is Arnold Sommerfeld Center for Theoretical Physics, Ludwig Maximilian University, Munich, Germany.
References
- 1.Hascall, V. C., and G. K. Hascall. 1981. Proteoglycans. In Cell Biology of Extracellular Matrix. E.D. Hay, editor. Plenum Press, New York. 39–63.
- 2.Doege, K. J., M. Sasaki, T. Kimura, and Y. Yamada. 1991. Complete coding sequence and deduced primary structure of the human cartilage large aggregating proteoglycan, aggrecan, human-specific repeats, and additional alternatively spliced forms. J. Biol. Chem. 266:894–902. [PubMed] [Google Scholar]
- 3.Maroudas, A. 1976. Balance between swelling pressure and collagen tension in normal and degenerate cartilage. Nature. 260:808–809. [DOI] [PubMed] [Google Scholar]
- 4.Grodzinsky, A. J. 1983. Electromechanical and physicochemical properties of connective tissue. CRC Crit. Rev. Biomed. Eng. 9:133–199. [PubMed] [Google Scholar]
- 5.Roughley, P. J., and E. R. Lee. 1994. Cartilage proteoglycans—structure and potential functions. Microsc. Res. Tech. 28:385–397. [DOI] [PubMed] [Google Scholar]
- 6.Plaas, A. H. K., S. Wong-Palms, P. J. Roughley, R. J. Midura, and V. C. Hascall. 1997. Chemical and immunological assay of the nonreducing terminal residues of chondroitin sulfate from human aggrecan. J. Biol. Chem. 272:20603–20610. [DOI] [PubMed] [Google Scholar]
- 7.Hardingham, T. 1998. Chondroitin sulfate and joint disease. Osteoarthr. Cartilage. 6:3–5. [DOI] [PubMed] [Google Scholar]
- 8.Platt, D., J. L. E. Bird, and M. T. Bayliss. 1998. Ageing of equine articular cartilage: structure and composition of aggrecan and decorin. Equine Vet. J. 30:43–52. [DOI] [PubMed] [Google Scholar]
- 9.Bayliss, M. T., D. Osborne, S. Woodhouse, and C. Davidson. 1999. Sulfation of chondroitin sulfate in human articular cartilage—the effect of age, topographical position, and zone of cartilage on tissue composition. J. Biol. Chem. 274:15892–15900. [DOI] [PubMed] [Google Scholar]
- 10.Lewis, S., M. Crossman, J. Flannelly, C. Belcher, M. Doherty, M. T. Bayliss, and R. M. Mason. 1999. Chondroitin sulphation patterns in synovial fluid in osteoarthritis subsets. Ann. Rheum. Dis. 58:441–445. [DOI] [PMC free article] [PubMed] [Google Scholar]
- 11.Plaas, A. H. K., L. A. West, S. Wong-Palms, and F. R. T. Nelson. 1998. Glycosaminoglycan sulfation in human osteoarthritis: disease-related alterations at the non-reducing termini of chondroitin and dermatan sulfate. J. Biol. Chem. 273:12642–12649. [DOI] [PubMed] [Google Scholar]
- 12.Ng, L., A. J. Grodzinsky, P. Patwari, J. Sandy, A. Plaas, and C. Ortiz. 2003. Individual cartilage aggrecan macromolecules and their constituent glycosaminoglycans visualized via atomic force microscopy. J. Struct. Biol. 143:242–257. [DOI] [PubMed] [Google Scholar]
- 13.Mankin, H. J., and L. Lippiello. 1971. The glycosaminoglycans of normal and arthritic cartilage. J. Clin. Invest. 50:1712–1719. [DOI] [PMC free article] [PubMed] [Google Scholar]
- 14.Iozzo, R. V. 1998. Matrix proteoglycans: from molecular design to cellular function. Annu. Rev. Biochem. 67:609–652. [DOI] [PubMed] [Google Scholar]
- 15.Morgenstern, D. A., R. A. Asher, and J. W. Fawcett. 2002. Chondroitin sulphate proteoglycans in the CNS injury response. Progr. Brain Res. 137:313–332. [DOI] [PubMed] [Google Scholar]
- 16.Wight, T. N. 2002. Versican: a versatile extracellular matrix proteoglycan in cell biology. Curr. Opin. Cell Biol. 14:617–623. [DOI] [PubMed] [Google Scholar]
- 17.Ateshian, G. A., M. A. Soltz, R. L. Mauck, I. M. Basalo, C. T. Hung, and W. M. Lai. 2003. The role of osmotic pressure and tension-compression nonlinearity in the frictional response of articular cartilage. Transp. Porous Media. 50:5–33. [Google Scholar]
- 18.Eisenberg, S. R., and A. J. Grodzinsky. 1987. The kinetics of chemically induced nonequilibrium swelling of articular-cartilage and corneal stroma. J. Biomech. Eng. Trans. ASME. 109:79–89. [DOI] [PubMed] [Google Scholar]
- 19.Lai, W. M., J. S. Hou, and V. C. Mow. 1991. A triphasic theory for the swelling and deformation behaviors of articular-cartilage. J. Biomech. Eng. Trans. ASME. 113:245–258. [DOI] [PubMed] [Google Scholar]
- 20.Bathe, M., G. C. Rutledge, A. J. Grodzinsky, and B. Tidor. 2005. A coarse-grained molecular model for glycosaminoglycans: Application to chondroitin, chondroitin sulfate, and hyaluronic acid. Biophys. J. 88:3870–3887. [DOI] [PMC free article] [PubMed] [Google Scholar]
- 21.Ehrlich, S., N. Wolff, R. Schneiderman, A. Maroudas, K. H. Parker, and C. P. Winlove. 1998. The osmotic pressure of chondroitin sulphate solutions: experimental measurements and theoretical analysis. Biorheology. 35:383–397. [DOI] [PubMed] [Google Scholar]
- 22.Cleland, R. L. 1971. Ionic polysaccharides. V. Conformational studies of hyaluronic acid, cellulose, and laminaran. Biopolymers. 10:1925–1948. [Google Scholar]
- 23.Perico, A., M. Mormino, R. Urbani, A. Cesaro, E. Tylianakis, P. Dais, and D. A. Brant. 1999. Local dynamics of carbohydrates. I. Dynamics of simple glycans with different chain linkages. J. Phys. Chem. B. 103:8162–8171. [Google Scholar]
- 24.Brant, D. A., and K. D. Goebel. 1975. General treatment of configurational statistics of polysaccharides. Macromolecules. 8:522–530. [DOI] [PubMed] [Google Scholar]
- 25.Rodriguez-Carvajal, M. A., A. Imberty, and S. Perez. 2003. Conformational behavior of chondroitin and chondroitin sulfate in relation to their physical properties as inferred by molecular modeling. Biopolymers. 69:15–28. [DOI] [PubMed] [Google Scholar]
- 26.von Grünberg, H. H., R. van Roij, and G. Klein. 2001. Gas-liquid phase coexistence in colloidal suspensions? Europhys. Lett. 55:580–586. [Google Scholar]
- 27.Belloni, L. 2000. Colloidal interactions. J. Phys. Condens. Matter. 12:R549–R587. [Google Scholar]
- 28.Deserno, M., and H. H. von Grünberg. 2002. Osmotic pressure of charged colloidal suspensions: a unified approach to linearized Poisson-Boltzmann theory. Phys. Rev. E. 66:Art. No. 011401. [DOI] [PubMed]
- 29.Trizac, E., and J. P. Hansen. 1996. Free energy of electric double layers around finite particles. J. Phys. Condens. Matter. 8:9191–9199. [Google Scholar]
- 30.McQuarrie, D. A. 1975. Statistical Mechanics. Harper & Row, New York.
- 31.Debye, P. W., and E. Hückel. 1923. Theory of the Electrolytes I. Zeitschrift für Physik. 24:305–324. [Google Scholar]
- 32.Tamashiro, M. N., and H. Schiessel. 2003. Where the linearized Poisson-Boltzmann cell model fails: spurious phase separation in charged colloidal suspensions. J. Chem. Phys. 119:1855–1865. [Google Scholar]
- 33.Bathe, M., A. J. Grodzinsky, B. Tidor, and G. C. Rutledge. 2004. Optimal linearized Poisson-Boltzmann theory applied to the simulation of flexible polyelectrolytes in solution. J. Chem. Phys. 121:7557–7561. [DOI] [PubMed] [Google Scholar]
- 34.van Roij, R., M. Dijkstra, and J. P. Hansen. 1999. Phase diagram of charge-stabilized colloidal suspensions: van der Waals instability without attractive forces. Phys. Rev. E. 59:2010–2025. [Google Scholar]
- 35.Chan, D. Y. C. 2001. Density functional theory of charged colloidal systems. Phys. Rev. E. 6306:Art. No. 061806. [DOI] [PubMed]
- 36.Bathe, M. 2004. Inverse Monte Carlo simulation of biomolecular conformation and coarse-grained molecular modeling of chondroitin sulfate conformation, titration, and osmotic pressure. Ph.D. dissertation. Massachusetts Institute of Technology, Cambridge, MA.
- 37.Theodorou, D. N., T. D. Boone, L. R. Dodd, and K. F. Mansfield. 1993. Stress tensor in model polymer systems with periodic boundaries. Makromol. Chem. Theory Sim. 2:191–238. [Google Scholar]
- 38.Stevens, M. J., M. L. Falk, and M. O. Robbins. 1996. Interactions between charged spherical macroions. J. Chem. Phys. 104:5209–5219. [Google Scholar]
- 39.Manning, G. S. 1969. Limiting laws and counterion condensation in polyelectrolyte solutions. I. Colligative properties. J. Chem. Phys. 51:924. [Google Scholar]
- 40.Odian, G. 1981. Principles of Polymerization. Wiley-Interscience, New York.
- 41.Fredrickson, G. H., and S. T. Milner. 1991. Thermodynamics of random copolymer melts. Phys. Rev. Lett. 67:835–838. [DOI] [PubMed] [Google Scholar]
- 42.Fredrickson, G. H., S. T. Milner, and L. Leibler. 1992. Multicritical phenomena and microphase ordering in random block copolymer melts. Macromolecules. 25:6341–6354. [Google Scholar]
- 43.Metropolis, N., A. W. Rosenbluth, M. N. Rosenbluth, A. H. Teller, and E. Teller. 1953. Equation of state calculations by fast computing machines. J. Chem. Phys. 21:1087–1092. [Google Scholar]
- 44.Madras, N., and A. D. Sokal. 1988. The pivot algorithm: a highly efficient Monte Carlo method for the self-avoiding walk. J. Stat. Phys. 50:109–186. [Google Scholar]
- 45.Sokal, A. D. 1996. Monte Carlo methods for the self-avoiding walk. Nucl. Phys. B Suppl. 47:172–179. [Google Scholar]
- 46.Almond, A., and J. K. Sheehan. 2003. Predicting the molecular shape of polysaccharides from dynamic interactions with water. Glycobiology. 13:255–264. [DOI] [PubMed] [Google Scholar]
- 47.Wang, L. X., and V. A. Bloomfield. 1990. Osmotic pressure of semidilute solutions of flexible, globular, and stiff-chain polyelectrolytes with added salt. Macromolecules. 23:194–199. [Google Scholar]
- 48.Kovach, I. S. 1995. The importance of polysaccharide configurational entropy in determining the osmotic swelling pressure of concentrated proteoglycan solution and the bulk compressive modulus of articular cartilage. Biophys. Chem. 53:181–187. [DOI] [PubMed] [Google Scholar]
- 49.Kovach, I. S. 1996. A molecular theory of cartilage viscoelasticity. Biophys. Chem. 59:61–73. [DOI] [PubMed] [Google Scholar]
- 50.Flory, P. J. 1953. Principles of Polymer Chemistry. Cornell University Press, Ithaca, NY.
- 51.Flory, P. J., and J. Rehner. 1943. Statistical mechanics of cross-linked polymer networks. J. Chem. Phys. 11:512–520. [Google Scholar]
- 52.Donnan, F. G. 1924. The theory of membrane equilibria. Chem. Rev. 1:73–90. [Google Scholar]
- 53.Fixman, M. 1979. Poisson–Boltzmann equation and its application to polyelectrolytes. J. Chem. Phys. 70:4995–5005. [Google Scholar]
- 54.Buschmann, M. D., and A. J. Grodzinsky. 1995. A molecular-model of proteoglycan-associated electrostatic forces in cartilage mechanics. J. Biomech. Eng. Trans. ASME. 117:179–192. [DOI] [PubMed] [Google Scholar]
- 55.Holm, C., J. F. Joanny, K. Kremer, R. R. Netz, P. Reineker, C. Seidel, T. A. Vilgis, and R. G. Winkler. 2004. Polyelectrolyte theory. In Polyelectrolytes with Defined Molecular Architecture II, Advances in Polymer Science, Vol. 166. M. Schmidt, editor. Springer Science, New York. 67–111.
- 56.Cleland, R. L. 1984. Theory of potentiometric titration of polyelectrolytes: a discrete-site model for hyaluronic acid. Macromolecules. 17:634–645. [Google Scholar]
- 57.Ullner, M., and B. Jonsson. 1996. A Monte Carlo study of titrating polyelectrolytes in the presence of salt. Macromolecules. 29:6645–6655. [Google Scholar]
- 58.Urban, J. P. G., A. Maroudas, M. T. Bayliss, and J. Dillon. 1979. Swelling pressures of proteoglycans at the concentrations found in cartilaginous tissues. Biorheology. 16:447–464. [DOI] [PubMed] [Google Scholar]
- 59.Wight, T. N., and M. J. Merrilees. 2004. Proteoglycans in atherosclerosis and restenosis—key roles for versican. Circ. Res. 94:1158–1167. [DOI] [PubMed] [Google Scholar]
- 60.Muthukumar, M. 1997. Dynamics of polyelectrolyte solutions. J. Chem. Phys. 107:2619–2635. [Google Scholar]
- 61.Ghosh, K., G. A. Carri, and M. Muthukumar. 2002. Phase transitions in solutions of semiflexible polyelectrolytes. J. Chem. Phys. 116:5299–5307. [Google Scholar]
- 62.Warren, P. B. 1997. Simplified mean field theory for polyelectrolyte phase behaviour. J. Phys. II. 7:343–361. [Google Scholar]
- 63.Mann, B. A., C. Holm, and K. Kremer. 2005. Swelling of polyelectrolyte networks. J. Chem. Phys. 122:154903. [DOI] [PubMed] [Google Scholar]
- 64.Maroudas, A., and C. Bannon. 1981. Measurement of swelling pressure in cartilage and comparison with the osmotic pressure of constituent proteoglycans. Biorheology. 18:619–632. [DOI] [PubMed] [Google Scholar]
- 65.Rathgeber, S., T. Pakula, A. Wilk, K. Matyjaszewski, and K. L. Beers. 2005. On the shape of bottle-brush macromolecules: systematic variation of architectural parameters. J. Chem. Phys. 122:Art. No. 124904. [DOI] [PubMed]
- 66.Elli, S., F. Ganazzoli, E. G. Timoshenko, Y. A. Kuznetsov, and R. Connolly. 2004. Size and persistence length of molecular bottle-brushes by Monte Carlo simulations. J. Chem. Phys. 120:6257–6267. [DOI] [PubMed] [Google Scholar]
- 67.Denesyuk, N. A. 2003. Conformational properties of bottle-brush polymers. Phys. Rev. E 67. [DOI] [PubMed]
- 68.Saariaho, M., A. Subbotin, O. Ikkala, and G. ten Brinke. 2000. Comb copolymer cylindrical brushes containing semiflexible side chains: a Monte Carlo study. Macromol. Rapid Comm. 21:110–115. [Google Scholar]
- 69.Saariaho, M., A. Subbotin, I. Szleifer, O. Ikkala, and G. ten Brinke. 1999. Effect of side chain rigidity on the elasticity of comb copolymer cylindrical brushes: a Monte Carlo simulation study. Macromolecules. 32:4439–4443. [Google Scholar]
- 70.Saariaho, M., I. Szleifer, O. Ikkala, and G. ten Brinke. 1998. Extended conformations of isolated molecular bottle-brushes: influence of side-chain topology. Macromol. Theory Sim. 7:211–216. [Google Scholar]
- 71.Wintermantel, M., M. Gerle, K. Fischer, M. Schmidt, I. Wataoka, H. Urakawa, K. Kajiwara, and Y. Tsukahara. 1996. Molecular bottlebrushes. Macromolecules. 29:978–983. [Google Scholar]