Abstract
Deletion of oligosaccharide side chains near the receptor binding site of influenza virus A/USSR/90/77 (H1N1) hemagglutinin (HA) enhanced the binding of HA to erythrocyte receptors, as was also observed with A/FPV/Rostock/34 (H7N1). Correlated with the enhancement of binding activity, the cell fusion activity of HA was reduced. A mutant HA in which three oligosaccharide side chains were deleted showed the highest level of binding and the lowest level of fusion among the HAs tested. The cell fusion activity of the oligosaccharide deletion mutant of HA, however, was drastically elevated when the binding activity was reduced by deletion of four amino acids adjacent to the receptor binding site. Thus, a reciprocal relationship was observed between the receptor binding and the cell fusion activities of H1/USSR HA. No difference was observed, however, in lipid mixing activity, so-called hemifusion, between wild-type (WT) and oligosaccharide deletion mutant HAs. Soluble dye transfer testing showed that even the HA with the lowest cell fusion activity was able to form fusion pores through which a small molecule such as calcein could pass. However, electron microscopic studies revealed that a large molecule such as hemoglobin hardly passed through the fusion pores formed by the mutant HA, whereas hemoglobin did efficiently pass through those formed by the WT HA. These results suggested that interference in the process of dilation of fusion pores occurs when the binding of HA to the receptor is too tight. Since the viral nucleocapsid is far larger than hemoglobin, appropriate receptor binding affinity is important for virus entry.
Influenza virus hemagglutinin (HA) mediates virus entry into a host cell through two functions, receptor binding and membrane fusion. HA is a homotrimeric transmembrane protein with an ectodomain composed of a globular head and a stem (26). The receptor binding site is located in the head region, while the fusion site is carried by the stem region. Proteolytic cleavage of HA into the HA1 and HA2 subunits is a prerequisite for fusion activity, and cleaved HA mediates membrane fusion under acidic conditions (11, 22, 25).
The HA1 and HA2 subunits are functionally specialized; HA1 binds to cellular receptors, and HA2 mediates membrane fusion. It is generally accepted that HA1 and HA2 are functionally independent of each other; for example, H7/Rostock HA-expressing cells show high cell fusion activity even when receptor binding activity is not detectable (16). Epand et al. (8) and Leikina et al. (12) showed that, in the absence of HA1, the ectodomain of HA2 promotes lipid mixing between liposomes and cell-cell hemifusion (fusion of outer leaflets of lipid bilayer membranes), respectively.
On the other hand, there are several reports indicating that HA1 is important for the function of HA2. The fusion-active form of HA2 is believed to be maintained by a structural constraint of the HA1 region (3, 4, 5). Ramalho-Santos and Pedriso de Lima (21) proposed that receptor binding activity plays an essential role in the hemifusion process. Thus, the relationship between receptor binding and fusion activities remains debatable and requires resolution.
To examine whether the binding activity of HA1 affects the fusion activity of HA2, it is necessary to artificially manipulate the binding activity of HA1. As previously described, the binding activity of HA can be elevated by deletion of glycosylation sites near the receptor binding pocket of HA (17). In the present study, we made various oligosaccharide deletion mutants of H1/USSR HA which show various degrees of receptor binding activities and compared their cell fusion activities. We found that the higher the binding activity of the HAs, the lower the fusion activity. In the present report, we show that the decrease in fusion activity is directly caused by the increase in binding activity and that the tight binding of HA to receptors can interfere with the fusion pore dilation process.
MATERIALS AND METHODS
cDNAs of HA and site-specific mutagenesis.
cDNAs encoding wild-type (WT) and mutant HAs from influenza virus A/FPV/Rostock/34 (H7N1) were subcloned by using the BamHI site in simian virus 40 (SV40) expression vector pA11SVL3 (16). The cDNA of HA from influenza virus A/USSR/90/77 (H1N1) was provided by E. Nobusawa of Nagoya City University. Site-specific mutagenesis of H1/USSR HA was done by using an M13 system and a Skulptur mutagenesis kit (Amersham, London, United Kingdom). To delete the glycosylation sites at amino acids (aa) 87 and 131, Thr at aa 89 and 129 was replaced with Ala, and for the sites at aa 155 and 160, Ser at aa 157 and Asn at aa 160 were replaced with Val and Asp, respectively. cDNAs of the WT and 15 mutants were subcloned into SV40 expression vectors and transfected into CV-1 cells, an established monkey kidney cell line. HA-SV40 recombinants were prepared as described previously (16, 19) and used for the expression of mutant HAs. The cDNAs in the SV40 expression vectors were transfected into CV-1 cells with the DNA of a helper virus, and HA-SV40 recombinants were recovered by freezing-thawing of transfected cells.
Expression of HAs in CV-1 cells.
After infection with HA-SV40 recombinants, CV-1 cells were incubated in Dulbecco's minimum essential medium (DMEM) supplemented with 5% fetal calf serum at 37°C for 2 days. To detect HA protein, the HA-expressing cells in a six-well plate (35-mm diameter per well; Simitomo Beklite, Tokyo, Japan) were labeled with 25 μCi of [35S]methionine in 1 ml of methionine-free DMEM for 2 h, chased for 1 h, and then solubilized in radioimmunoprecipitation assay buffer. HA was precipitated with anti-A/USSR/90/77 rabbit serum and protein A-Sepharose CL-4B (Sigma) and analyzed by polyacrylamide gel electrophoresis (PAGE) with precast gradient gels (PAGEL; Atto, Tokyo, Japan). The results were analyzed with a BAS-2000 II (Fuji Photo Film Co., Tokyo, Japan) bioimaging analyzer.
Digestion with endo H and N-glycosidase F.
HA-expressing cells were labeled with [35S]methionine as described above. After the chase, HA on the cell surface was treated with trypsin (10 μg/ml, 37°C, 15 min), and the cells were solubilized in radioimmunoprecipitation assay buffer. HA was recovered by immunoprecipitation and denatured at 95°C for 3 min in 50 mM phosphate buffer (pH 7.0) containing 1.0% sodium dodecyl sulfate (SDS) and 0.5% β-mercaptoethanol. After excess SDS was blocked with Triton X-100 (final concentration, 1%), HA was digested with endoglycosidase H (endo H) and N-glycosidase F (Boehringer Mannheim, Mannheim, Germany) at a concentration of 0.1 mU/μl and 0.1 U/μl, respectively, for 6 h at 37°C and then analyzed by PAGE.
Immunofluorescence staining of HA-expressing cells.
CV-1 cells were seeded on a Nunc Lab-Tek chamber slide and infected with HA-SV40 recombinants. At 48 h postinfection (p.i.), the cells were fixed with 1% paraformaldehyde in phosphate-buffered saline (PBS) and stained by indirect methods with anti-A/USSR/90/77 hyperimmune rabbit serum, biotinylated anti-rabbit immunoglobulin G donkey serum, and streptavidin-fluorescein (Amersham).
For flow cytometric analysis, HA-expressing CV-1 cells were detached from culture dishes by EDTA and trypsin treatments and fixed with 2% paraformaldehyde in PBS for 15 min at room temperature. Cells were washed with 2% glycine in PBS and incubated with fluorescein isothiocyanate-conjugated anti-A/USSR/90/77 goat immunoglobulin G (Biogenesis) for 1 h at 37°C. Cells were then resuspended in 1 ml of PBS and subjected to fluorescence-activated cell sorter (FACS) (Becton Dickinson) analysis.
Hemadsorption test.
CV-1 cells in the six-well plate (35-mm diameter per well) were infected with HA-SV40 recombinants. At 2 days p.i., the HA-expressing cells were treated with Vibrio cholerae neuraminidase (VCNA) (test neuraminidase; Boehring Institut, Marburg, Germany) as described previously (16), and then a freshly prepared guinea pig erythrocyte suspension was added to the pretreated cell culture. Unbound erythrocytes were removed by rinsing the culture with an excess of PBS containing Mg and Ca ions. For quantification of hemadsorption, the erythrocytes bound to the cell surface were hemolyzed with 0.5 ml of distilled water, the lysate was clarified by centrifugation at 10,000 × g for 1 min, and the optical density of released hemoglobin was measured at 575 nm.
Release kinetics test.
The affinity of the binding of HA to cellular receptors was evaluated by measuring the kinetics of release of erythrocytes in the presence of VCNA as follows. Hemadsorption testing was done as described above, 20 mU of VCNA in 2 ml of PBS containing Mg and Ca ions was added to the culture, and then the culture was incubated at 37°C for 0 to 120 min. Released erythrocytes were collected by a brief centrifugation and hemolyzed with 0.5 ml of distilled water. Erythrocytes remaining on the HA-expressing cells after incubation with VCNA were also hemolyzed with 0.5 ml of distilled water. The hemoglobin level in each sample was assayed as described above.
Cell fusion test.
HA-expressing CV-1 cells were treated with trypsin (final concentration, 10 μg per ml) for 15 min at 37°C for the cleavage activation of HA and then were treated with acidic RPMI 1640 medium (pH 4.8) for 5 min at 37°C to trigger a fusion reaction. The medium was changed to neutral DMEM containing 5% fetal calf serum, and the cell culture was incubated for 4 h. Next, the cells were fixed with ethanol and stained with Giemsa solution, and the number of cells involved in fusion was determined by counting nuclei in syncytia. The number of HA-expressing cells was estimated by counting hemadsorption-positive cells under a microscope after hemadsorption testing. The specific fusion activity of each mutant HA was expressed as the fusion index, which is the total number of nuclei in syncytia per microscopic field divided by the number of hemadsorption-positive cells per field, as described previously (18).
Fusion test with R18-labeled or calcein-filled erythrocytes.
Guinea pig erythrocytes were labeled with the membrane probe octadecyl rhodamine B (R18; Molecular Probes, Eugene, Oreg.) or with the aqueous dye calcein-AM (calcein; Molecular Probes) for 30 min at 37°C as described previously (18). After removal of excess R18 or calcein by repeated centrifugations, the erythrocytes were used for fusion tests. Trypsin-pretreated HA-expressing cells were subjected to hemadsorption testing with R18-labeled or calcein-filled erythrocytes; after washing, unbound erythrocyte fusion testing was carried out as described above. At 10 min after fusion induction, the reaction was stopped by fixing the cells with 1% chilled paraformaldehyde, and the transfer of R18 or calcein from the labeled erythrocytes into the HA-expressing cells was examined under a fluorescence microscope.
We carried out a quantitative evaluation of erythrocytes from which dye transfer occurred. The fluorescence of calcein-filled erythrocytes was very weak because of a quenching effect. When the quenching effect was dissolved by dye transfer into HA-expressing cells, the erythrocytes became more clearly visible under a fluorescence microscope. To evaluate quantitatively the erythrocytes in which dequenching occurred, we analyzed the fluorescence intensity of erythrocytes by using an IBAS2000 system (Zeiss-Kontron, Eching, Germany). The intensity was graduated in 255 grades, and grades of 100 or over were scored as dye transfer positive.
Electron microscopic observations.
Samples for electron microscopic observations were prepared in the same way as described above, except that nonlabeled erythrocytes were used in place of labeled ones. After the fusion reaction, hemadsorbing cells were collected by using a rubber policeman, sedimented by brief centrifugation (300 × g for 3 min), and doubly fixed with 2.5% glutaraldehyde in 0.1 M cacodylate buffer (pH 7.3) for 90 min followed by 2.5% OsO4 in the same buffer. Thin sections were prepared by a previously reported method (14), stained with both uranyl acetate and lead citrate solutions, and then examined with a JEM 2000 EX electron microscope.
RESULTS
Expression of WT and oligosaccharide deletion mutant HAs of the H1/USSR strain.
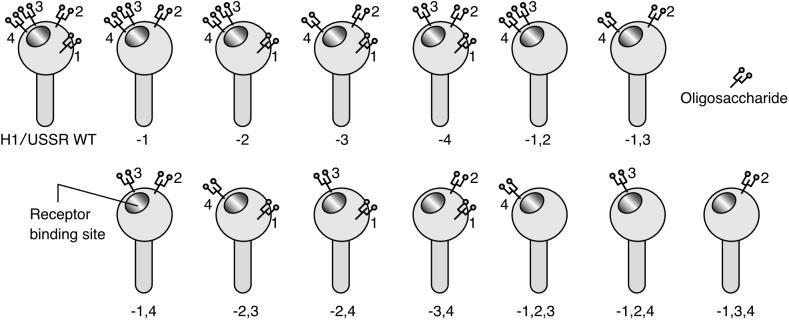
In the vicinity of the receptor binding site of the H1/USSR HA, there are four potential N glycosylation sites and thus the possibility of 15 variations in deletion mutants. All the possible mutants were made by site-directed mutagenesis and expressed in CV-1 cells through an SV40 expression vector as described in Materials and Methods. The mutants were named as follows. Glycosylation sites at aa 87, 127, 155, and 160 of the H1/USSR HA were numbered 1, 2, 3, and 4, respectively; a mutant that lost both site 1 and site 2 was named −1,2. HA-expressing CV-1 cells were subjected to cell surface immunostaining without permeabilization. All HAs, except for the −2,3,4 and −1,2,3,4 mutants, were as efficiently expressed on the cell surface as was WT HA (data not shown). The 13 mutant HAs that were efficiently expressed (Fig. 1) were used for further studies.
FIG. 1.
WT HA of the A/USSR/90/77 strain and its mutants that were examined for biological activities. Glycosylation sites near the receptor binding site of influenza virus A/USSR/90/77 (subtype H1) HA were deleted through site-directed mutagenesis. Mutant HAs that were expressed as efficiently as WT HA are listed schematically. For the naming of the mutants, refer to the text.
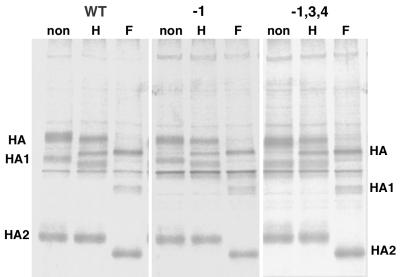
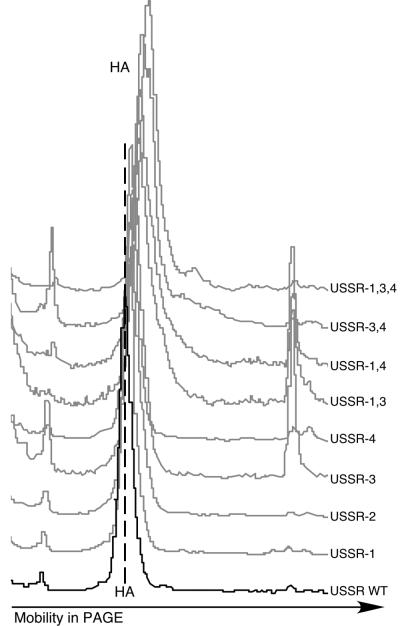
To evaluate the intracellular transport of expressed HAs, HA-expressing cells were labeled with [35S]methionine for 2 h and chased for 1 h at 2 days p.i. as described in Materials and Methods. Then, the cell culture was treated with trypsin (10 μg/ml for 10 min at 37°C) to cleave the HA protein that had accumulated on the cell surfaces. The HA protein was recovered by immunoprecipitation, subjected to endo H and N-glycosidase F digestion, and then analyzed by PAGE as described in Materials and Methods. Representative results are shown in Fig. 2. No significant differences in the processing of oligosaccharides, ability to be cleaved, or transport efficiency were observed between the WT and mutant HAs. The results of PAGE of the WT HA and the 13 mutant HAs were analyzed with the BAS-2000 II bioimaging analyzer, and their densitometric patterns are combined in Fig. 3. Each deletion of a glycosylation site caused a slight increase in the electrophoretic mobility in PAGE, demonstrating that all four sites are used for glycosylation.
FIG. 2.
Expression and transport of WT and mutant HAs in CV-1 cells. HA-expressing CV-1 cells were labeled with [35S]methionine at 37°C for 2 h, chased for 1 h, and treated with trypsin to cleave the HA on the cell surface. HA protein was recovered by immunoprecipitation, subjected to endo H and N-glycosidase F digestion, and analyzed by SDS-PAGE. Representative data are shown here. Lanes H, after endo H digestion. Lanes F, after N-glycosidase F digestion. Lanes non, not digested.
FIG. 3.
Mobility of WT and mutant HAs in SDS-PAGE. [35S]methionine-labeled HAs were recovered by immunoprecipitation and subjected to PAGE. The mobility of each HA protein in PAGE was analyzed with a BAS-2000 II bioimaging analyzer, and the densitometric patterns were combined.
Affinity of binding of HAs to erythrocyte receptors.
CV-1 cells expressing the WT HA and the 13 mutant HAs were subjected to hemadsorption tests with guinea pig erythrocytes. All the HAs of the H1/USSR strain showed clear hemadsorption without any pretreatment (data not shown). In a previous study, it was found that hemadsorption was hardly observed with H7/Rostock WT HA-expressing CV-1 cells unless the cells were pretreated with VCNA or viral neuraminidase was coexpressed (16). The present study demonstrated that the H1/USSR WT HA did not require neuraminidase to show hemadsorption activity.
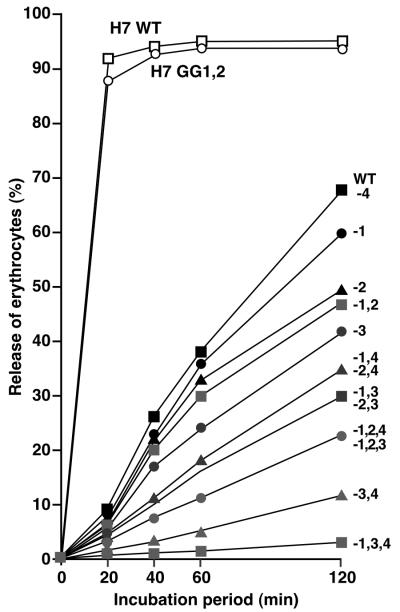
To compare the receptor binding affinities of these HAs, we examined the kinetics of release of erythrocytes from HA-expressing cells by VCNA treatment. Erythrocytes were bound to HA-expressing cells that had been pretreated with VCNA. This pretreatment is essential for H7 WT HA to bind erythrocytes. After any unbound erythrocytes were washed away, erythrocytes were released from HA-expressing cells in the presence of 20 mU of VCNA in 2 ml of medium at 37°C. The amounts of erythrocytes released and bound were measured by hemolysis as described in Materials and Methods. The percentage of released erythrocytes was calculated, and the average of triplicate experimental data for each HA was plotted in Fig. 4. Erythrocytes bound to the H7 HAs were released very rapidly, whereas erythrocytes bound to the H1 HAs were released slowly, demonstrating that the receptor binding affinity of the H1 HAs is far higher than that of the H7 HAs. Furthermore, the kinetics of the release of H1 HAs varied over a very wide range that corresponded to oligosaccharide deletions, whereas those for the H7 HAs varied over a narrow range. Thus, experiments with H1 HAs are clearly suitable for any study concerning the relationship between receptor binding and fusion activities.
FIG. 4.
Kinetics of erythrocyte release from HA-expressing cells by VCNA treatment. After hemadsorption, monolayers were incubated at 37°C with 20 mU of VCNA in 2 ml of PBS containing Mg and Ca ions. Released and remaining erythrocytes were evaluated by measuring the optical density of hemoglobin after hemolysis. H7 GG1,2, oligosaccharide-deleted mutant HA which shows higher binding activity than H7 WT (17).
As shown in Fig. 4, erythrocytes bound to H1 WT HA were more efficiently released by VCNA treatment than those bound to the mutant HAs. In association with the deletion of oligosaccharides, the release of erythrocytes became more suppressed, indicating that the affinity of binding of HAs to erythrocyte receptors was elevated by the oligosaccharide deletion. Mutant −1,3,4 showed the highest binding affinity among the HAs tested. Erythrocytes bound to mutant −1,3,4 were hardly released by VCNA treatment even after 2 h of incubation.
Cell fusion activity of mutant HAs.
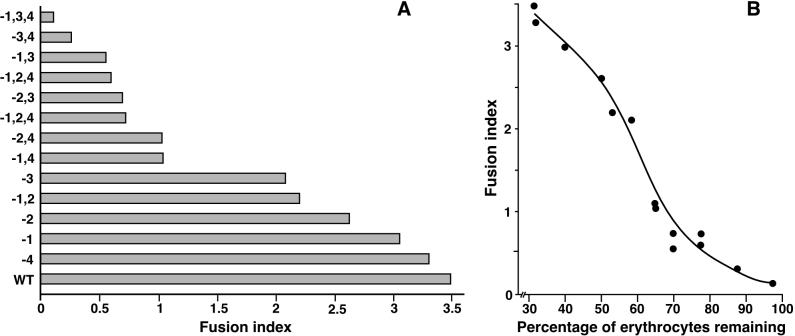
In the next experiment, the specific cell fusion activities of the H1 HAs were assayed. Triplicate cultures of HA-expressing cells were treated with trypsin (10 μg per ml) for 15 min at 37°C for the cleavage activation of HA. One of the cultures was used for hemadsorption to count HA-expressing cells under a microscope. The remaining two cultures were treated with an acidic medium to induce a fusion reaction. The number of fused cells was determined by counting nuclei in syncytia. The specific fusion activity was expressed as the fusion index, which is the number of fused cells divided by the number of hemadsorption-positive cells. As shown in Fig. 5A, WT HA showed the highest fusion activity, and the activity became lower in association with the deletion of oligosaccharides.
FIG. 5.
Cell fusion activities of WT and mutant HAs (A) and relationship between fusion and binding activities (B). Specific cell fusion activity was expressed as a fusion index, that is, the number of cells involved in fusion divided by the number of HA-expressing cells. The binding activity of HA was expressed as the percentage of erythrocytes remaining on HA-expressing cells after 2 h of incubation with VCNA.
The fusion index of each HA was plotted against the percentage of erythrocytes remaining on the HA-expressing cells after 2 h of VCNA treatment, which should reflect HA binding intensity (Fig. 5B). A reciprocal correlation was obvious between the receptor binding and the cell fusion activities. However, there remains the possibility that the low fusion activity of the mutants was due to a structural instability of HA caused by the deletion of oligosaccharides; in other words, the elevated binding intensity might not have been responsible for the decrease in fusion activity. In the following experiments, we examined this possibility.
Recovery of fusion activity by reduction of binding activity.
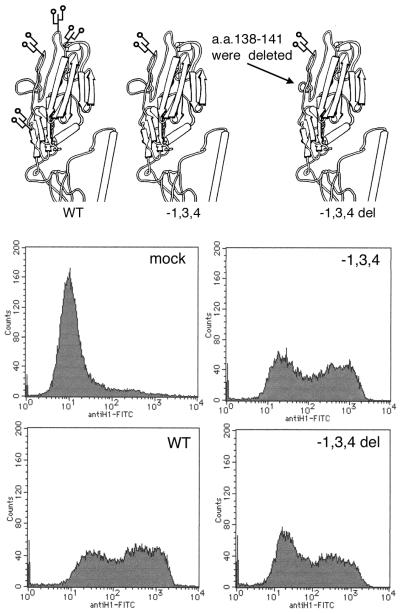
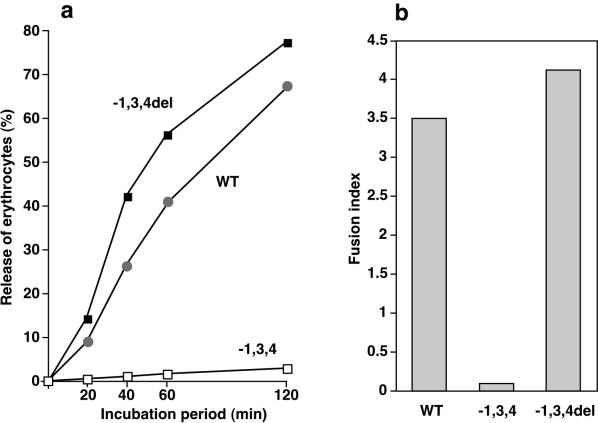
We tried to reduce the binding activity of mutant −1,3,4, which showed the highest level of binding to erythrocyte receptors, without affecting glycosylation sites. It was found that the binding activity was reduced when four amino acids (aa 138 to 141) adjacent to the receptor binding site were deleted by site-specific mutagenesis; the resulting mutant was named −1,3,4del (Fig. 6). Erythrocytes bound to mutant −1,3,4del were rapidly released by VCNA treatment (Fig. 7a). Then, the specific fusion activity of −1,3,4del was compared with those of the WT and −1,3,4. The reduced fusion activity of −1,3,4 was markedly recovered by deletion of the four amino acids (Fig. 7b), and −1,3,4del now showed the highest fusion activity and the lowest binding intensity among the HAs tested. To confirm that the difference in the specific fusion activity was not due to different levels of expression of the HAs, we assayed cell surface antigen expression levels for these three HAs by FACS analysis. As shown in Fig. 6, the levels of expression of the HA antigens were comparable. There still remains the possibility that the amino acid deletion accidentally compensated for the instability of HA, which in turn might have been caused by the oligosaccharide deletion, and that the reduction of binding activity occurred simultaneously and independently of the recovery of fusion activity. However, this possibility is very difficult to justify and is most improbable. Thus, the above results demonstrate that the enhanced binding activity was responsible for the reduced fusion activity.
FIG. 6.
Deletion of four amino acids adjacent to the receptor binding site and FACS analysis for the levels of cell surface expression of the mutant and WT HAs. A part of the three-dimensional model of the H3 HA monomer of Wilson et al. (26) was used to illustrate H1 WT and mutant HAs. An uninfected CV-1 cell culture was used for mock infection. FITC, fluorescein isothiocyanate.
FIG. 7.
Decrease in receptor binding affinity (a) and restoration of cell fusion activity (b) associated with the deletion of four amino acids (mutant −1,3,4del).
At which step of the fusion process does interference occur?
The membrane fusion reaction is thought to proceed through three steps: the first step is lipid mixing of the outer leaflets of the membrane, so-called hemifusion; the second is fusion pore formation; and the third is enlargement of the fusion pore (2, 6). In the following experiment, we analyzed at which step of the fusion reaction interference may occur as a result of the deletion of oligosaccharides by using mutant −1,3,4, which showed the lowest cell fusion activity among the HAs tested.
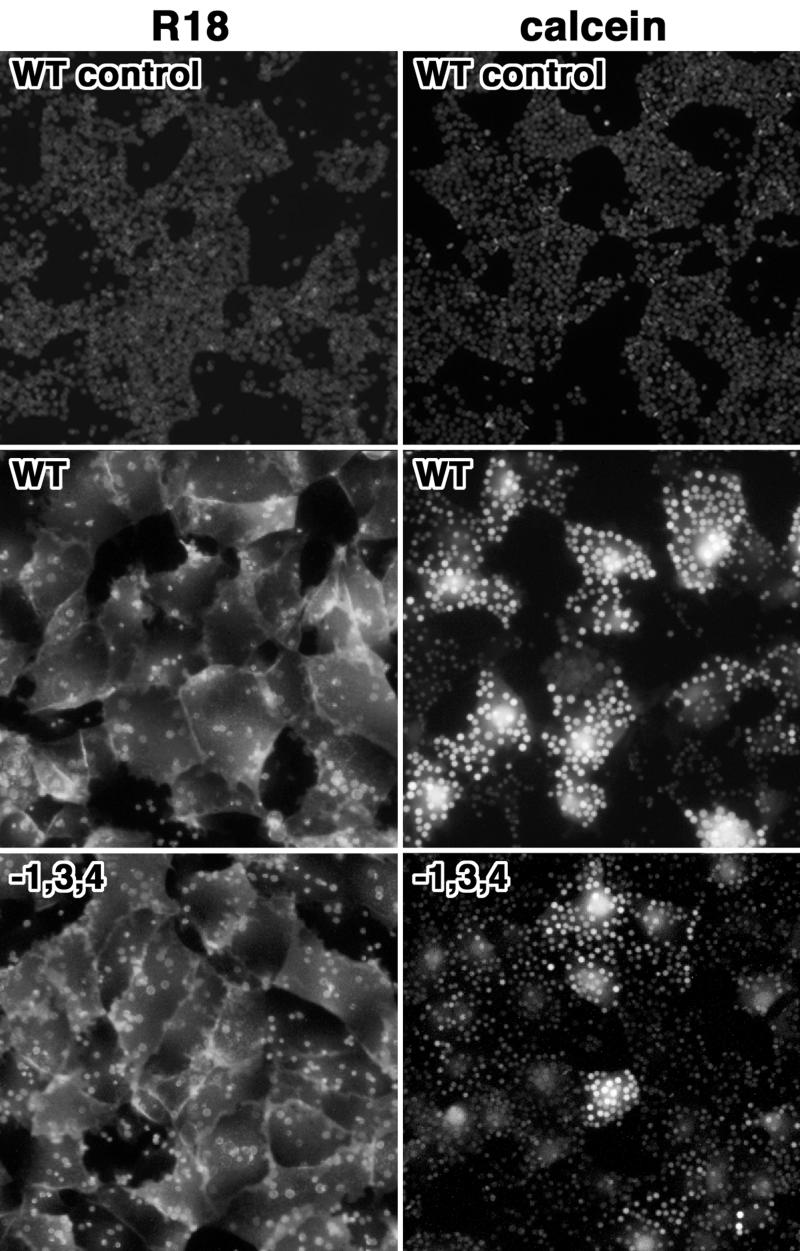
The hemifusion ability of HA was examined by measuring the transfer of R18-labeled lipid from the erythrocyte membrane to the membrane of HA-expressing cells. WT and −1,3,4 HA-expressing cells were treated with trypsin for the cleavage activation of HA and overlaid with R18-labeled erythrocytes. Unbound erythrocytes were washed, and the cells and erythrocytes were treated with acidic medium (pH 4.8) to induce a fusion reaction. As shown in Fig. 8, R18-labeled lipid was transferred from the erythrocyte membrane to the membrane of mutant −1,3,4 HA-expressing cells as well as to that of WT HA-expressing cells. No difference in hemifusion activity was detected between the two HAs.
FIG. 8.
Hemifusion activity and fusion pore formation assayed with labeled lipid R18 and soluble dye calcein. WT and mutant −1,3,4 HA-expressing cells were subjected to hemadsorption with R18- and calcein-labeled erythrocytes, respectively, and the fusion reaction was triggered by acidification. As a control, fusion was triggered with a neutral medium.
Next, we examined the second step of the fusion reaction, namely, fusion pore formation, with the two HAs. Fresh guinea pig erythrocytes filled with calcein were laid over HA-expressing cells and treated with a low pH as described above. Calcein transfer occurred in mutant HA-expressing cells in a manner similar to that seen for WT HA-expressing cells (Fig. 8). This result indicated that fusion pores were formed with the mutant HA. However, it appeared that fewer target cells were stained with calcein in panel −1,3,4 of Fig. 8 and that the staining was less intense.
We next tried to quantitatively evaluate the erythrocytes in which calcein transfer occurred. When the fusion pore was formed between the erythrocyte and the HA-expressing cell, calcein should have been transferred to the cell and the quenching effect should have been dissolved. Thus, erythrocytes with fusion pores should be clearly detectable by fluorescence microscopy. The fluorescence intensity of erythrocytes bound to HA-expressing cells was analyzed by using an IBAS2000 system as described in Materials and Methods. Totals of 47.2% of 2,301 erythrocytes bound to the WT and 27.6% of 2,793 erythrocytes bound to the mutant were scored as dye transfer positive. This result indicated that the efficiency of pore formation was 1.71-fold higher with the WT than with the mutant.
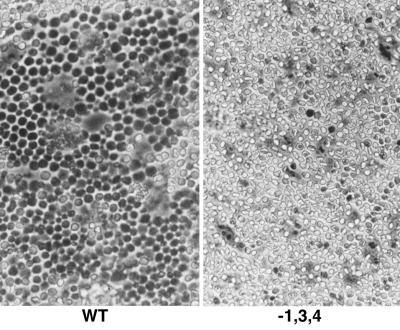
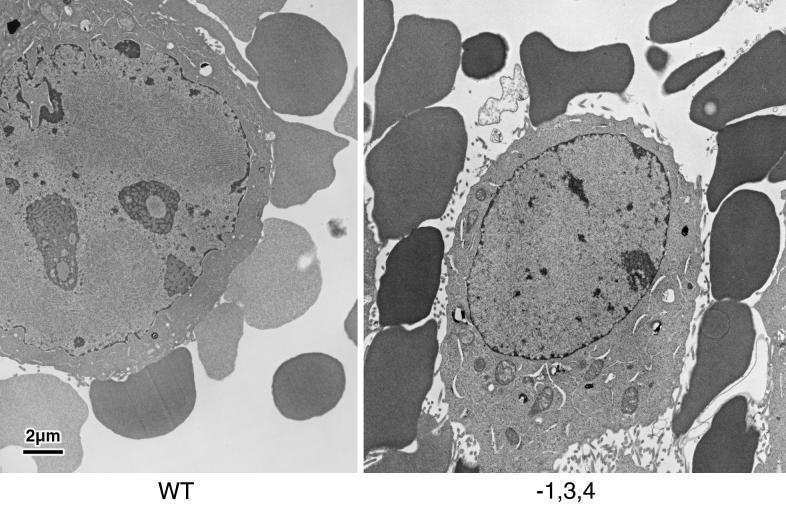
However, under phase-contrast microscopy, most of the erythrocytes bound to the WT seemed to have been altered in form and brightness after the acid treatment, whereas those bound to the mutant remained unchanged (Fig. 9). From this observation, we postulated that hemoglobin may be transferred from erythrocytes to WT HA-expressing cells. To examine hemoglobin transfer from erythrocytes to cells, acid-treated specimens were subjected to electron microscopic observations. Erythrocytes bound to WT HA-expressing cells showed a low density, whereas erythrocytes bound to mutant HA-expressing cells showed a high density (representative images are shown in Fig. 10). Since there was no detectable hemoglobin in the culture fluid under these conditions (data not shown), the images demonstrate that the WT HA made a large pore between the erythrocyte and the cell through which hemoglobin could easily pass, whereas the pore made by the mutant HA was not large enough for hemoglobin to pass through. From these observations, we conclude that it is likely that interference with dilation of the fusion pore occurs when the binding intensity of HA is too high. Since the viral nucleocapsid is larger than hemoglobin, this interference is a major problem for virus entry into cells.
FIG. 9.
Erythrocytes bound to HA-expressing cells after triggering of the fusion reaction. Erythrocytes and cells were observed through a phase-contrast microscope after triggering of the fusion reaction.
FIG. 10.
Electron microscopic observation of erythrocytes and HA-expressing cells after triggering of the fusion reaction.
DISCUSSION
The present study confirmed the concept that the oligosaccharide side chains near the receptor binding site of HA control the affinity of binding of HA to cellular receptors; this concept was originally proposed from studies with H7/Rostock HA (16, 17, 24). In the present study, we found that there is a reciprocal relationship between the receptor binding and the fusion activities of H1/USSR HA. Such a relationship was not observed with the H7/Rostock WT and mutant HAs. This difference may be due to the fact that the absolute receptor binding activity of the H7 HAs was far lower than that of the H1 HAs (Fig. 4). Even the receptor binding of the H7 HA oligosaccharide deletion mutants may not be so tight as to interfere with the fusion reaction. Moreover, the difference in the VCNA release kinetics between H7 WT and mutant HAs was not as evident as that observed with the H1 HAs. These factors may explain why a reciprocal relationship was not observed with the H7 HAs. However, we found a similar relationship between the H1 WT and H7 WT HAs; that is, the specific fusion activity expressed as a fusion index was far higher with the H7 HA than with the H1 HA (19). Hence, there was a reciprocal relationship beyond the HA strains. Thus, the oligosaccharides near the receptor binding site could function to enhance fusion activity by regulating the receptor binding affinity of the H1 HAs.
It is generally accepted that sideways relocation of the globular subunits of HA1 from the top of the HA molecule is required for fusion activity (9, 10). From this point of view, we at first thought that such relocation of HA1 would be hindered when HA1 was bound tightly to receptors of the target cell. However, hemifusion and fusion pore formation were observed even in mutant −1,3,4, which showed the lowest cell fusion activity, indicating that the relocation of HA1 might take place even with that mutant. No difference was detected between the mutant and the WT with respect to hemifusion. However, the efficiency of fusion pore formation was found to be 1.71-fold lower in mutant −1,3,4, than in the WT. Although a low efficiency of pore formation might be one of the reasons for the low cell fusion activity of the mutant, it was not low enough to be the sole explanation for the low activity of this mutant. Since the cell fusion activity of the mutant was lower than that of the WT by less than 1/30, another process after pore formation could be hindered. Electron microscopic studies showed that hemoglobin might have poured into the cytoplasm of WT HA-expressing cells through the pores formed by the WT, whereas hemoglobin might have hardly passed through the pores formed by mutant −1,3,4. From these observations, we concluded that HA-receptor binding that is too tight interferes with the enlargement of fusion pores.
Many studies have been published concerning the relationship between HA binding and fusion activities (1, 7, 12, 13, 15, 20, 21, 23), and most indicate that the binding of HA to receptors is necessary for an efficient fusion reaction. The question is whether this concept is inconsistent with our conclusions from the present study. Data other than ours have shown that the binding of HA aids hemifusion (and, in some studies, pore formation as well) by mediating membrane contact. On the other hand, in the present study, we demonstrated that the tight binding of HA to receptors interfered with a rather late stage of fusion, that is, the enlargement of fusion pores. Moreover, in our system, HA-expressing cells are originally adhered to with neighboring cells in a confluent monolayer cell culture. Therefore, this system would not be suitable for examining whether HA needs to bind to target cell membranes to initiate the fusion process. From these results, we conclude that it is likely that tight connections of HA and receptors act positively on hemifusion (and perhaps do so until pore formation) but act negatively on pore dilation. Thus, it may be very important for HA to adjust its binding activity to satisfy the above demand. Since an amino acid exchange in the receptor binding site may cause a drastic change in binding activity (as shown in Fig. 7) and sometimes spoil the activity itself, the control of binding activity by oligosaccharide side chains is important for the delicate adjustment of binding intensity.
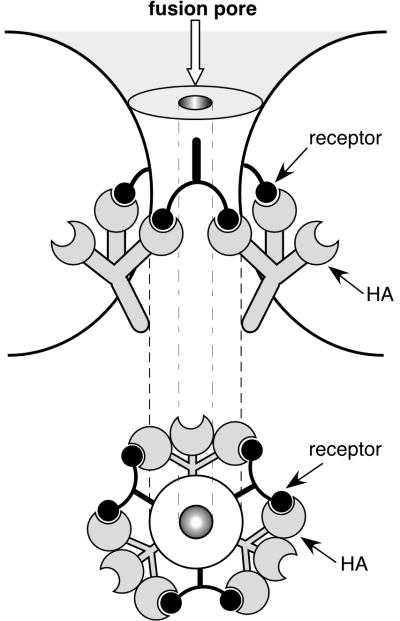
We propose a hypothesis to answer the question of how the tight binding of HA to receptors interferes with fusion pore dilation. Since an HA spike has trivalent binding sites and receptor molecules have mostly multiple sialotermini, HA spikes could cross-link receptor molecules, as schematically illustrated in Fig. 11. If HAs tightly cross-link receptor molecules surrounding a fusion pore, like a hoop, pore dilation might well be inhibited. If the hoop is very small, then interference with calcein transfer might also occur; otherwise, only hemoglobin transfer would be affected. If the hoop is incomplete, hemoglobin transfer would be permitted; in other words, pore dilation would occur.
FIG. 11.
Schematic illustration of a probable mechanism of interference by tight binding of HA to receptors.
Acknowledgments
We thank Yasuko Tanaka and Sachiyo Omori of the Department of Microbiology and Kazuko Yamane, Taiji Suda, and Kenzo Uehira of the Research Center of Electron Microscopy, Kawasaki Medical School, for excellent help in this study.
This work was supported by a grant-in-aid from the Japanese Ministry of Education, Science and Culture (C09670321) and by Kawasaki Medical School (project research grants 11-503 and 12-403).
REFERENCES
- 1.Alford, D., H. Ellens, and J. Bentz. 1994. Fusion of influenza virus with sialic acid-bearing target membranes. Biochemistry 33:1977-1987. [DOI] [PubMed] [Google Scholar]
- 2.Bonnafous, P., and T. Stegmann. 2000. Membrane perturbation and fusion pore formation in influenza hemagglutinin-mediated membrane fusion. J. Biol. Chem. 275:6160-6166. [DOI] [PubMed] [Google Scholar]
- 3.Bullough, P. A., F. M. Hughson, J. J. Skehel, and D. C. Wiley. 1994. Structure of influenza haemagglutinin at the pH of membrane fusion. Nature 371:37-43. [DOI] [PubMed] [Google Scholar]
- 4.Carr, C. M., and P. S. Kim. 1993. A spring-loaded mechanism for the conformational change of influenza hemagglutinin. Cell 73:823-832. [DOI] [PubMed] [Google Scholar]
- 5.Chen, J., S. A. Wharton, W. Weissenhorn, L. J. Calder, F. M. Hughson, J. J. Skehel, and D. C. Wiley. 1995. A soluble domain of the membrane-anchoring chain of influenza virus hemagglutinin (HA2) folds in Escherichia coli into the low-pH-induced conformation. Proc. Natl. Acad. Sci. USA 92:12205-12209. [DOI] [PMC free article] [PubMed] [Google Scholar]
- 6.Chernomordic, L. V., V. A. Frolov, E. Leikina, P. Bronc, and J. Zimmerberg. 1998. The pathway of membrane fusion catalyzed by influenza hemagglutinin: restriction of lipids, hemifusion, and lipidic fusion pore formation. J. Cell Biol. 140:1369-1382. [DOI] [PMC free article] [PubMed] [Google Scholar]
- 7.Ellens, H., J. Bentz, D. Mason, F. Zhang, and J. M. White. 1990. Fusion of influenza hemagglutinin-expressing fibroblasts with glycophorin-bearing liposomes: role of hemagglutinin surface density. Biochemistry 29:9697-9707. [DOI] [PubMed] [Google Scholar]
- 8.Epand, R. F., J. C. Macosko, C. J. Russell, Y. K. Shin, and R. M. Epand. 1999. The ectodomain of HA2 of influenza virus promotes rapid pH dependent membrane fusion. J. Mol. Biol. 286:489-503. [DOI] [PubMed] [Google Scholar]
- 9.Godley, L., J. Pfeifer, D. Steinhauer, B. Ely, G. Shaw, R. Kaufmann, E. Suchanek, C. Pado, J. J. Skehel, D. C. Wiley, and S. Wharton. 1992. Introduction of intersubunit disulfide bonds in the membrane-distal region of the influenza hemagglutinin abolishes membrane fusion activity. Cell 68:635-645. [DOI] [PubMed] [Google Scholar]
- 10.Kemble, G. W., T. Danieli, and J. M. White. 1994. Lipid-anchored influenza hemagglutinin promotes hemifusion, not complete fusion. Cell 76:383-391. [DOI] [PubMed] [Google Scholar]
- 11.Klenk, H.-D., and R. Rott. 1988. The molecular basis of influenza virus pathogenicity. Adv. Virus Res. 34:247-281. [DOI] [PMC free article] [PubMed] [Google Scholar]
- 12.Leikina, E., D. L. LuDuc, J. C. Macosko, E. Epand, R. Epand, Y.-K. Shin, and L. V. Chernomordik. 2001. The 1-127 HA2 construct of influenza virus hemagglutinin induces cell-cell hemifusion. Biochemistry 40:8378-8386. [DOI] [PubMed] [Google Scholar]
- 13.Lima, M. C. P., J. Ramalho-Santos, D. Flasher, V. A. Slepushkin, S. Nir, and N. Düzgünes. 1995. Target cell membrane sialic acid modulates both binding and fusion activity of influenza virus. Biochim. Biophys. Acta 1236:323-330. [DOI] [PubMed] [Google Scholar]
- 14.Matsumoto, A., H. Izutsu, N. Miyashita, and M. Ohuchi. 1998. Plaque formation by and plaque cloning of Chlamydia trachomatis biovar trachoma. J. Clin. Microbiol. 36:3013-3019. [DOI] [PMC free article] [PubMed] [Google Scholar]
- 15.Millar, B. M. G., L. J. Calder, J. J. Skehel, and D. C. Wiley. 1999. Membrane fusion by surrogate receptor-bound influenza hemagglutinin. Virology 257:415-423. [DOI] [PubMed] [Google Scholar]
- 16.Ohuchi, M., A. Feldmann, R. Ohuchi, and H.-D. Klenk. 1995. Neuraminidase is essential for fowl plague virus hemagglutinin to show hemagglutinating activity. Virology 212:77-83. [DOI] [PubMed] [Google Scholar]
- 17.Ohuchi, M., R. Ohuchi, A. Feldmann, and H.-D. Klenk. 1997. Regulation of receptor binding affinity of influenza virus hemagglutinin by its carbohydrate moiety. J. Virol. 71:8377-8384. [DOI] [PMC free article] [PubMed] [Google Scholar]
- 18.Ohuchi, M., C. Fischer, R. Ohuchi, A. Herwig, and H.-D. Klenk. 1998. Elongation of the cytoplasmic tail interferes with the fusion activity of influenza virus hemagglutinin. J. Virol. 72:3554-3559. [DOI] [PMC free article] [PubMed] [Google Scholar]
- 19.Ohuchi, R., M. Ohuchi, W. Garten, and H.-D. Klenk. 1997. Oligosaccharides in the stem region maintain the influenza virus hemagglutinin in the metastable form required for fusion activity. J. Virol. 71:3719-3725. [DOI] [PMC free article] [PubMed] [Google Scholar]
- 20.Ramalho-Santos, J., M. C. P. Lima, and S. Nir. 1996. Partial fusion activity of influenza virus toward liposomes and erythrocyte ghosts is distinct from viral inactivation. J. Biol. Chem. 271:23902-23906. [DOI] [PubMed] [Google Scholar]
- 21.Ramalho-Santos, J., and M. C. Pedriso de Lima. 1998. The influenza virus hemagglutinin: a model protein in the study of membrane fusion. Biochim. Biophys. Acta 1376:147-154. [DOI] [PubMed] [Google Scholar]
- 22.Skehel, J. J., and D. C. Wiley. 2000. Receptor binding and membrane fusion in virus entry: the influenza hemagglutinin. Annu. Rev. Biochem. 69:531-569. [DOI] [PubMed] [Google Scholar]
- 23.Stegmann, T., I. Bartoldus, and J. Zumbrunn. 1995. Influenza hemagglutinin-mediated membrane fusion: influence of receptor binding on the lag phase preceding fusion. Biochemistry 34:1825-1832. [DOI] [PubMed] [Google Scholar]
- 24.Wagner, R., T. Wolff, A. Herwig, S. Pleschka, and H.-D. Klenk. 2000. Interdependence of hemagglutinin glycosylation and neuraminidase as regulators of influenza virus growth: a study by reverse genetics. J. Virol. 74:6316-6323. [DOI] [PMC free article] [PubMed] [Google Scholar]
- 25.Wiley, D. C., and J. J. Skehel. 1987. The structure and function of the hemagglutinin membrane glycoprotein of influenza virus. Annu. Rev. Biochem. 56:365-395. [DOI] [PubMed] [Google Scholar]
- 26.Wilson, I. A., J. J. Skehel, and D. C. Wiley. 1981. Structure of the haemagglutinin membrane glycoprotein of influenza virus at 3 Å resolution. Nature 289:366-373. [DOI] [PubMed] [Google Scholar]


