Abstract
The anisotropic diffusion of water in chive (Allium schoenoprasum) tissues has been investigated using two-dimensional nuclear magnetic resonance methods: diffusion-diffusion correlation spectroscopy and diffusion-relaxation correlation spectroscopy. Corresponding one-dimensional T2 and diffusion measurements confirm independently the results of the two-dimensional investigations. In particular the diffusion-diffusion correlation spectroscopy method proves to be very powerful in resolving the different components of the diffusion tensor at different sites in the sample.
INTRODUCTION
Water and other solvent molecules exhibit anisotropic diffusion behavior in materials with anisotropic structures. NMR methods are particularly useful in investigating diffusion anisotropy, which not only aids in elucidating structures of mesophases of soft matter, but also provides a source of contrast in magnetic resonance imaging of tissues (1). One of the problems in diffusion anisotropy measurements is to relate the orientation of an experimental sample and the laboratory reference frame (2). For example, the lamellar phase of a lyotropic liquid crystal may exhibit local anisotropic structure, but macroscopic isotropy. For such polydomain materials, elucidation of diffusion anisotropy is difficult although it is possible to correlate motions in different directions using one-dimensional (1D) pulsed field gradient (PFG) NMR methods (3) along with appropriate modeling approaches.
By contrast, diffusion-diffusion correlation spectroscopy (DDCOSY) (2,4) provides a model-free approach that directly yields quantitative information about the diffusion tensor  for a given diffusion observation time Δ, in a single two-dimensional (2D) experiment. DDCOSY has been used to study polydomain lamellar liquid crystal phase (40 wt % C10E3 in water) (2). Diffusion-relaxation correlation spectroscopy (DRCOSY) (5) may be used to directly determine diffusion coefficients and their correlated T2 relaxation times for multiple phases in a single 2D experiment, again for a given diffusion observation time. Both DDCOSY and DRCOSY have the potential to resolve, by means of the second dimension, either D or T2 in situations where these cannot be resolved in a 1D distribution. Furthermore, the probability distribution of spins associated with each diffusion component may be determined. DRCOSY has been successfully applied to analyze the aging of different cheese samples (5) and to determine T2-discriminated diffusion behavior of drug molecules in polyelectrolyte multi-layer capsules (drug carriers) (6). In this work, we demonstrate an application of these two 2D methods in investigating anisotropic diffusion of water in plant tissue.
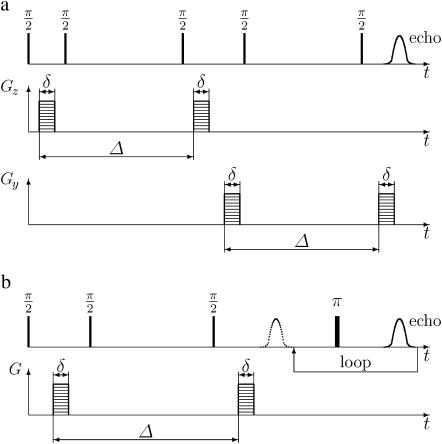
The DDCOSY pulse sequence shown in Fig. 1 a, consists of two pulsed gradient stimulated echo (PGSTE) sequences (7) (instead of the two PGSE sequences used in the original DDCOSY (2,4). In the DDCOSY experiment the amplitudes of the gradient pulse pairs may be changed independently. Furthermore, these two gradient pairs may be applied collinearly or orthogonally to correlate successive molecular diffusion along either collinear or orthogonal axes of laboratory reference frame. The resulting NMR signal is a function of the applied pulsed field gradient wave-vectors qi and qj and is given by
 |
(1) |
where M is the echo amplitude, M0 is the initial echo amplitude, p is the joint probability of the contribution to the signal from Dii and Djj,  γ, G, δ being the gyromagnetic ratio, gradient strength and gradient duration, respectively. i and j are x, y, or z directions in the laboratory frame.
FIGURE 1.
(a) DDCOSY consists of two successive independent orthogonal (or collinear) PGSTE sequences. (b) DRCOSY combines a PGSTE and a multi-echo sampling CPMG sequence.
The DRCOSY pulse sequence is shown in Fig. 1 b (P. Galvosas, Y. Qiao, and P. T. Callaghan, unpublished), and consists of a combination of PGSTE and a multi-echo sampling Carr-Purcell-Meiboom-Gill (CPMG) sequence (9). The key change of the current DRCOSY over that previous published (5) is that a complete CPMG echo train is acquired rather than a single final echo in the CPMG part of the sequence. The obvious advantage of the current DRCOSY is that the experimental time may be greatly reduced since signal is acquired through the entire time domain within one excitation through an echo train instead of needing to carry out separate experiments for many repetitions while increasing the loop counter. As a result, the data need to be processed in the time domain, in our case by analyzing the amplitude of each successive echo. The resulting signal is given by:
 |
(2) |
where p is the joint probability of the contribution to the signal from D and T2.
The relationships expressed in Eqs. 1 and 2 are Laplace transformations from p to M. In a generalized representation we have to consider the discrete Laplace transformation
 |
(3) |
where M is the measured 2D data set, X is the wanted 2D distribution p, E is the noise acquired together with the data and K1 and K2 is the kernel correspond to the exponential factors in Eqs. 1 and 2, respectively.
To obtain X from M, inverse Laplace transformation is required. Such a procedure for processing 2D NMR data has been introduced by Venkataramanan et al. (10) and Song et al. (11). As shown by Venkataramanan (10) it is possible to obtain a fit to the data M by minimizing the expression
 |
(4) |
where ‖·‖ is the Frobenius norm of a matrix. The second term in Eq. 4 is a regularization parameter α which must be chosen for each individual data set (see 11). To accelerate the numerical computation, it is recommended to reorganize Eq. 4 and to reduce the dimension of the problem before the numerical minimization (10).
Since the introduction of the 2D inverse Laplace transformation and its first application in processing experimental data by Song (11), this method has been successfully applied into data processing of a growing number systems, such as the fluids in porous rocks (11), microemulsions (5), microencapsulated drugs (6) as well as liquid crystals (2,12), which strongly suggests the reliability and the reproducibility of this method. Commercial software for 2D inverse Laplace transformation is available (www.magritek.com).
EXPERIMENTAL METHODS
Two NMR samples were prepared: an aligned sample (Fig. 2, left) and a chopped sample (Fig. 2, right). The aligned sample is a whole living chive plant used immediately after being removed from soil. The chopped sample contains cylindrical chive pieces each of length 2 ∼ 5 mm, with wet cotton wool near the top of the NMR tube to maintain humidity.
FIGURE 2.
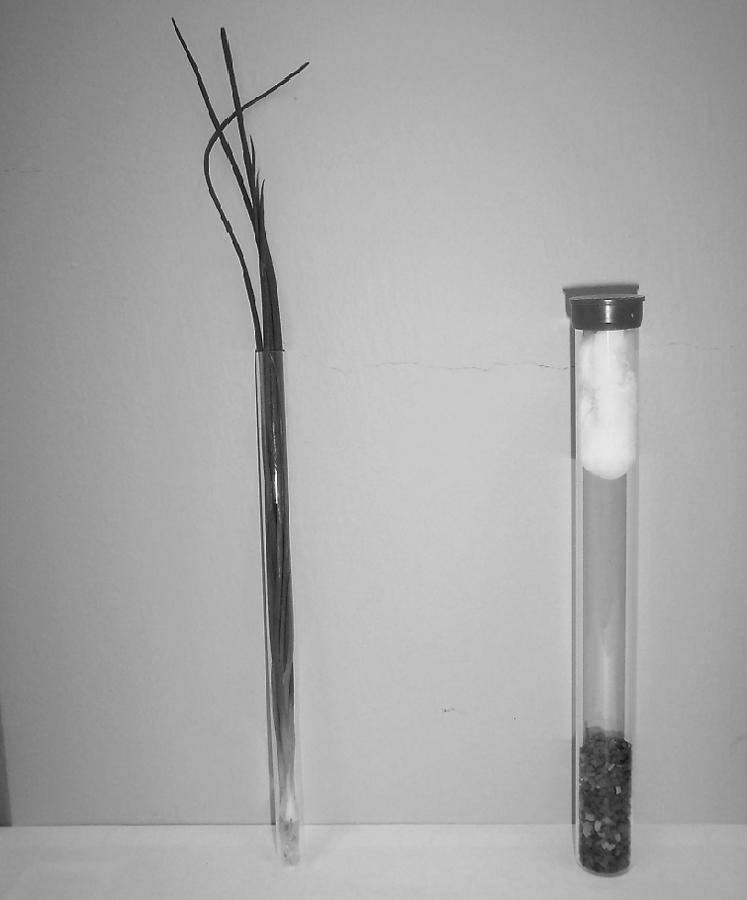
A photo of the aligned chive sample (left) and the chopped chive sample (right). The aligned chive sample is a whole chive plant in a 10-mm NMR tube. The chopped chive sample consists 2 ∼ 5 mm long cylindrical pieces placed in a 20-mm NMR tube with random orientations.
All NMR experiments were performed using a Bruker AMX300 NMR spectrometer equipped with a Bruker micro-imaging system (Micro2.5). This provides a maximum gradient strength Gmax = 0.937 T/m. All experiments were carried out at 1H resonance frequency of 300.14 MHz at room temperature (∼22°C). T1 and T2 relaxation times for both samples were determined using an inversion recovery sequence (processed in the frequency domain using the area under the water peak obtained by Fourier transformation of the free induction decay) and multi-echo sampling CPMG sequence (processed in the time domain, using the amplitude of each echo), respectively.
1D diffusion measurements on the aligned sample using the PGSTE pulse sequence were carried out using a series of PGSTE encoding times Δ. The gradient pairs were applied along the longitudinal axis and the transverse axis of the plant in the lab frame z direction and x direction. The T1 of the aligned sample was found to be ∼1 s, and therefore, the greatest Δ was chosen to be 1.5 s. The PGSTE data were processed in the frequency domain (using the area under the water peak) to obtain the NMR echo attenuation as a function of the applied pulsed field gradient. Subsequent processing of the echo attenuation with the 1D inverse Laplace transformation yielded the probability distribution of diffusion coefficients.
Two-dimensional (2D) DRCOSY and DDCOSY experiments were carried out on the chopped sample after obtaining the T1 and T2 relaxation times of this sample. The T1 of this sample was found to be 1 s. The NMR spectrum acquired consists only of one single line arising from the water. Hence, processing the data in the frequency domain does not lead to additional information compared to the processing in the time domain. The application of the DRCOSY where multi-echo CPMG trains were used as described in the introduction (acquiring and processing in the time domain) is therefore the optimal choice, since one can take full advantage of the much shorter experimental time, which is crucial for research involving a living and decaying biological sample. However, an equivalent fast pulse sequence using only the time domain does not exist for the DDCOSY. Therefore there the processing of the experimental data was carried out via the frequency domain by integration of the water peak resulted in a 2D matrix of intensities depending on q1 and q2.
DRCOSY experiments were carried out at Δ of 30 ms and 300 ms. DRCOSY maps were obtained through the inverse Laplace transformation of these 2D matrices of signal intensities. Note that the probability distributions present in the final DRCOSY maps were corrected for T2 decay by taking into account the calculable signal attenuation for T2 relaxation that occurred during the PGSTE pulse sequence.
In the DDCOSY experiments, Δ was chosen to be 30 ms and 300 ms. Before the inverse Laplace transformation of this 2D matrix, the data of the very first gradient step in both directions were discarded to avoid any distortion of the signals at zero gradient. The second gradient pulse pair is incremented first so that after the inverse Laplace transformation, the vertical axis in the 2D DDCOSY map represents the diffusion coefficient obtained by the first gradient pairs (z direction of lab frame), whereas the horizontal axis stands for the diffusion coefficient of the molecules measured by the second gradient pair (either z or x direction of lab frame). The probability distributions assigned to the peaks in 2D DDCOSY maps are calculated from integrals of the volume under the surface of each peak in the 2D map of probability values, obtained from inverse Laplace transformation. As mentioned above for the DRCOSY the distributions were corrected for T2 decay by taking into account the calculable signal attenuation for T2 during the PGSTE pulse sequence. In contrast to the T2 correction carried out for the DRCOSY, here a weighted average  is used, since several distinct T2 values contribute to one single diffusion coefficient. However, this correction influenced the derived probability distribution only minimally (∼2%) because the T2 values are long compared to the relevant delays in the pulse sequence. The experimental error for these probability distributions is estimated to be 2 ∼ 3%.
The chive samples for optical micrographs were prepared following standard procedures for biological samples. Micrographs of the chive plant were obtained using an Olympus (PROVIS) photomicroscope, with a Nikon camera (COOLpix 950, 3.3Mpixels).
RESULTS AND DISCUSSION
Optical microscope results
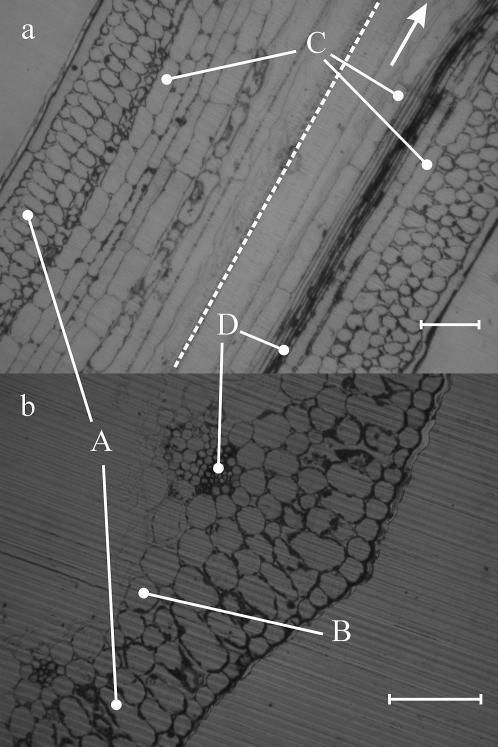
Fig. 3 a shows two separate longitudinal sections (LS) through a tubular young leaf of a chive plant. The two separate sections were jointed together on the micrograph along the dashed line. Fig. 3 b shows a transverse section (TS) of the same tissue (13). The outermost layer is the epidermis, which is one cell in thickness and consists of cells that are elongated in LS and isodiametric in TS. Internal to the epidermis are several layers of palisade mesophyll cells (labeled A). These are either isodiametric or elongated along their radial axis. Internal to the palisade mesophyll is the spongy mesophyll (labeled B), which consists of larger, thin walled isodiametric cells. Embedded in the spongy mesophyll are the vascular bundles, each surrounded by a bundle sheath of 1–2 layers of large cells that are isodiametric in TS and elongated in LS (labeled C). The vascular bundles are small, with phloem (labeled D) on the outside (abaxial) and xylem on the inside (adaxial). Xylem vessels are composed of a series of elongated cells without end walls, thus producing very long narrow unrestricted tubes 2–10 μm in diameter. Phloem sieve tubes are also elongated, but have sieve plates (perforated cellular end walls) between the individual cells. Smaller phloem companion cells occur among the sieve tubes. An adaxial epidermis of large isodiametric lines the hollow interior of the tubular leaf, but is poorly differentiated from the adjacent spongy mesophyll.
FIGURE 3.
Optical micrographs of the chive plant. (a) longitudinal view and transverse view. The scale given is 100 μm. Four different types of cells are marked A, B, C, and D. The arrow points in the direction parallel to the sample axis. The dashed line in a separates two independent sample pieces.
Both diffusion coefficients and transverse relaxation times (T2) are measures of molecular mobility properties and reflect different aspects of the molecular motions. The diffusion coefficients reflect the restrictions induced by the geometrical confinements, i.e., the sizes of the cells. The relaxation times T2 reflect the molecular environments inside or outside the cells, e.g., the salt concentrations of the cell contents and interactions between water molecules and the cell walls.
T2 relaxation times of the aligned and chopped samples
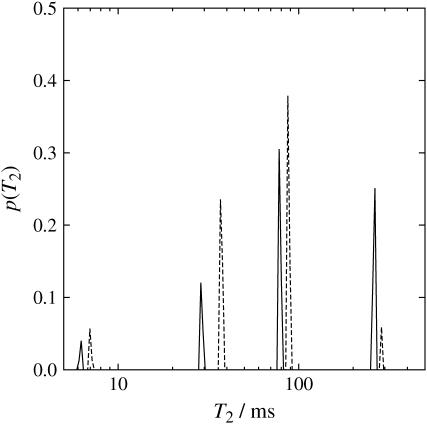
Fig. 4 shows the T2 distributions for water in the aligned sample (solid line) and in the chopped sample (dashed line). The four T2 values agree in both samples. The probability distributions for the three smaller T2 values also roughly agree. The probability distribution for the largest T2 of the chopped sample has smaller intensity than that of the aligned sample, suggesting a loss of this T2 component due to the chopping process during the sample preparation. The four T2 relaxation times of water suggest water molecules with four different types of molecular environments. The loss of the largest T2 due to chopping suggests that this T2 is originated from water inside the xylem vessels. The other three unaffected T2 values likely originate from water inside cells or water outside cells but trapped between the cell membranes.
FIGURE 4.
Distributions of T2 relaxation times obtained through inverse Laplace transformation of the echo decays measured using a multi-echo sampling CPMG sequence, for both aligned sample (solid lines) and chopped sample (dashed lines).
PGSTE results of the aligned sample
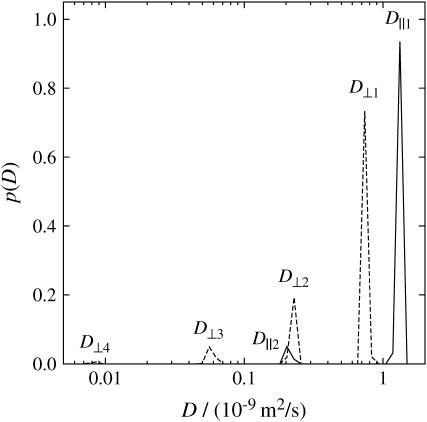
As mentioned before, in these experiments the chive leaf longitudinal axis (sample axis) was aligned parallel to the laboratory z axis (which coincides with the direction of the spectrometer magnetic field). Fig. 5 shows the 1D distribution of water self-diffusion coefficients, obtained by inverse Laplace transformation of 1D PGSTE data. These diffusion results were obtained using Δ = 500 ms. There are two components along the z direction of the laboratory frame parallel to the sample axes, referred to as D‖ (solid lines), and four components along the x direction of the laboratory frame perpendicular to the sample axes referred to as D⊥ (dashed lines). The largest value parallel to the sample axis (D‖1) is close to the free diffusion coefficient of water, whereas the largest value perpendicular to the sample axis (D⊥1) is smaller than D‖1, suggesting anisotropy with respect to the two diffusion directions. The values of D‖2 and D⊥2 are identical. D⊥3 at ∼5 × 10⁻¹¹ m2/s does not have an equivalent in D‖. The probability amplitude of D⊥4 is so small that this peak is not taken into account subsequently.
FIGURE 5.
Distributions of diffusion coefficients obtained through inverse Laplace transformation of the echo decays measured using PGSTE sequence at an observation time of Δ = 500 ms for the aligned sample in both z direction (solid lines) and x direction (dashed lines).
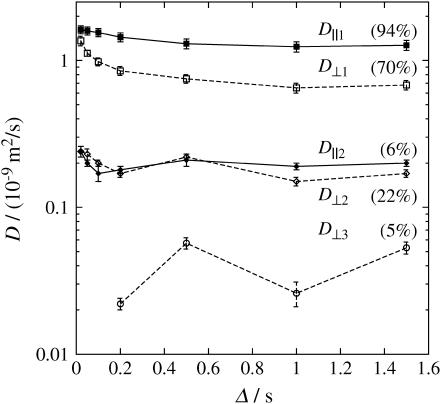
Fig. 6 shows a plot of the various diffusion coefficients against the observation time Δ. Solid symbols with solid lines stand for data measured along the z direction parallel to the sample axis. Open symbols with dashed lines stand for data measured along the x direction perpendicular to the sample axis. Two diffusion components in each direction were resolved at Δ = 20, 50, and 100 ms. Three diffusion components were resolved at Δ = 200 ms–1.5 s in the perpendicular direction and two diffusion components in the parallel direction. The reason for finding fewer peaks at shorter Δ in the perpendicular direction we ascribe to limitations in the gradient strength of the NMR apparatus used. The values given in Fig. 6 are the arithmetic means for the intensities of each individual peak as shown in Fig. 5. The error bars are estimated from the width of the distribution.
FIGURE 6.
D versus Δ results obtained using the PGSTE sequence after inverse Laplace treatment for the aligned sample in both z direction (solid symbols and lines) and x direction (open symbols and dashed lines), parallel and perpendicular to the sample axes, respectively. The probability of D‖1 (▪) stays at 94% and D‖2 (♦) stays at 6%. The probability of D⊥1 (□) drops from 89% at Δ = 20 ms to 75% at Δ = 500 ms, whereas D⊥2 (◊) increases from 11% to 20% in the same range. D⊥3 (○) is scattered between 2% and 7%.
Within error, D‖1 decreases only a little within the range of Δ, with a diffusion coefficient close to free water. Furthermore the probability amplitude for D‖1 stays constant at 94%. We suspect that D‖1 originated from water inside xylem vessels, thus diffusing nearly unhindered parallel to the chive axis. By contrast D⊥1 decreases with increasing Δ. Its probability amplitude drops from 89% to 75% and remains at ∼70–75% beyond Δ = 500 ms. D‖2 and D⊥2 do not depend on the observation time nor on the diffusion direction and are about one order of magnitude smaller than that of free water. The probability distribution for D‖2 stays constant at 6% whereas that for D⊥2 increases from 11% to 22% with increasing Δ. The small relative drop of the probability amplitude for the component D⊥1 could be due to surface relaxation since the number of water molecules colliding with cell walls increases with increasing Δ. D⊥3 values are scattered and correspond to probabilities between 2% and 7%.
From the 1D PGSTE measurement we can conclude: a), that the diffusion is partially anisotropic; b), that the molecules are hindered in their diffusion motion to different extents (three classes of diffusion coefficients) but are not confined since the diffusion coefficients settle to a constant time-independent value; and c), that there is a weak (short time) observation-time dependence for the two fastest components D D‖11 and D⊥1.
Diffusion coefficients in different directions in the lab frame measured using the aligned sample in 1D experiments are not simply equivalent to those of a chopped sample measured in 2D experiments. In our 1D experiments, the aligned sample's axial direction is the z direction in the laboratory frame; in the 2D experiments, the axial direction of each segment of the chopped sample points in a random direction relative to the laboratory reference frame. For this reason, the different diffusion coefficients obtained in the 2D experiments are denoted as Dα, Dβ, and Dγ rather then Di1, Di2, and Di3 with i = ‖ or ⊥. This takes into account the averaging over all possible segment orientations.
DRCOSY of water diffusing in the chopped sample
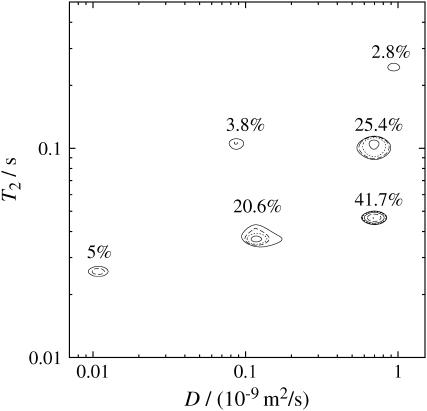
Fig. 7 shows DRCOSY results of water diffusing in the chopped chive sample, obtained at Δ = 300 ms. The six peaks show correlations of three groups of diffusion coefficients with Dα ∼ 1 × 10⁻⁹ m2/s, Dβ ∼ 1 × 10⁻¹⁰ m2/s and Dγ ∼ 1 × 10⁻¹¹ m2/s and three distinct T2 relaxation times. The range of distributions of diffusion coefficients agrees with the 1D PGSTE results presented in Fig. 6 and the range of T2 values agrees with the 1D CPMG results shown in Fig. 4, apart from the absence of the smallest T2 at ∼7 ms (an effect we attribute to the loss of T2 relaxation time components, which are short compared to relevant delays of the PGSTE pulse sequence).
FIGURE 7.
Results obtained with the DRCOSY using the chopped sample measured at Δ = 300 ms. The probability distribution given by the T2-corrected percentages refer to the integral values under the individual peaks. The error is estimated to be 3%. In contrast, the isolines refer to the highest peak and are labeled 3% (—), 6% (- - -), 12% (⋯⋯), 25% (—), 50% (- - -) and 100% (⋯⋯) of the peak height.
The small peak of amplitude 2.8% corresponds to a diffusion coefficient larger than for all other peaks. In particular it is slightly larger than for those peaks with amplitudes of 25.4% and 41.7%, which are closest. Consequently we identify this rapid diffusion peak with D‖1 in Fig. 6. We further note that the 2.8% amplitude peak corresponds to a T2 value of 250 ms and is therefore identified with the longest T2 peak in Fig. 4. It is the component for which water is lost when the chive is chopped, water we associated with the xylem vessels. The loss of this water is exactly what we expect given the plant geometry.
The question that remains is how to interpret the fast diffusion peaks with amplitudes of 25.4% and 41.7% in Fig. 7. First, we note that these peaks (of shorter T2) do not lose water on chopping the chive sample (see Fig. 4). This would be consistent with them arising from water in enclosed cells. Second, the values of the diffusion coefficients correspond to that of D⊥1 in Fig. 6, which we might associate with the two main types of enclosed cells, i.e., palisade and spongy mesophyll cells.
A comparison of the probability amplitude of the diffusion components shown in Fig. 6 with the range of Dβ in Fig. 7 suggests that the peaks with 3.8% and 20.6% may be assigned to D‖2 and D⊥2, respectively. Dγ with 5% may be assigned to D⊥3. The six peaks shown in Fig. 7 stand for six distinct properties of water molecules in different sites in the chopped sample. Note that the DRCOSY map at Δ = 30 ms shows similar features to that of Fig. 7, which was obtained at Δ = 300 ms, and therefore is not shown here.
DDCOSY of water diffusing in the chopped sample
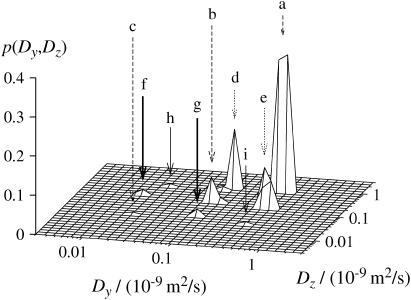
The DDCOSY experiment helps us to elucidate local diffusion anisotropy for the various water components. Fig. 8 shows a three-dimensional representation of the DDCOSY measurement obtained at Δ = 300 ms using two orthogonal gradient pairs. On-diagonal peaks a, b, and c correspond to the previously observed values Dα, Dβ, and Dγ. Off-diagonal peaks d and e are cross peaks of a and b; peaks f and g are cross peaks of peak b and c; peaks h and i are cross peaks of a and c.
FIGURE 8.
A three-dimensional representation of the diffusion coefficient distribution in z and y direction obtained with the DDCOSY pulse sequence at Δ = 300 ms. Corresponding off diagonal peaks are d and e (dotted arrows), f and g (thick arrows), as well as h and i (thin arrows).
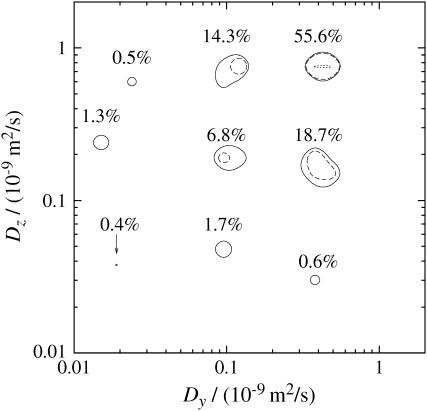
The 2D contour map of the plot shown in Fig. 8 is given in Fig. 9 with integrated probabilities indicated. “Diagonal” peaks a, b, and c are slightly offset from the diagonal line, possibly due to the cylindrical segments in the chopped sample having a slightly preferred orientation in the cylindrical sample tube. The values of diffusion coefficients of peaks a, b, and c agree well with results in PGSTE and DRCOSY experiments if this global anisotropy is taken into account and the sample tube Dz axis is used for the reading of the values. Because of the limited lifetime of the chopped chive sample it is not appropriate to search for the source of this offset of the diagonal peaks using the same chive sample itself. However, investigations on other systems, such as liquid crystals have shown a perfect placement of the diagonal peaks without any offset (12). Therefore we consider the slightly preferred orientation of the individual chive cylinders as the only likely remaining source for the offset.
FIGURE 9.
A two-dimensional projection of the DDCOSY map presented in Fig. 8. The probability distribution given by the T2 corrected percentages refer to the integral value under the individual peaks. The error is estimated to be 3%. In contrast, the isolines refer to the highest peak and are labeled 1% (—), 10% (- - -), and 100% (⋯⋯) of the peak height.
The DDCOSY map exhibits three different kinds of anisotropic diffusion. The first is represented by the two peaks d and e with probabilities between 14.3% and 18.7%. In each case the fast component is ∼8 × 10⁻¹⁰ m2/s and the slow component is ∼2 × 10⁻¹⁰ m2/s corresponding to the values found with the 1D PGSTE. The value 8 × 10⁻¹⁰ m2/s tells that the fast component D‖1 (1.4 × 10⁻⁹ m2/s) does not appear in, or does not dominate this type of diffusion. Therefore we associate it with D⊥1, for which the orientation of the fast axis of the diffusion tensor is perpendicular to the chive sample axis and we assign this diffusion process mainly to the water inside the palisade or spongy mesophyll cells. Note however there may be a small contribution due to diffusion in the sheath cells since we know from the DRCOSY measurement that D‖1 contributes 3% to the probability and may hence contribute to the peaks a, d, and e.
The second type of anisotropic diffusion is represented by peaks h and i with intensities of ∼0.5%. Its fast component is ∼8 × 10⁻¹⁰ m2/s and its slow component is ∼3 × 10⁻¹¹ m2/s. Here we assign these two peaks to the diffusion in the xylem vessels, since the anisotropy is very large and the probability is small, consistent with loss of water from the xylem.
The third type of anisotropic diffusion is represented by peaks f and g with intensities of ∼1.5%. Its fast component is ∼2 × 10⁻¹⁰ m2/s and its slow component is ∼3 × 10⁻¹¹ m2/s. A small amount of intercellular water could be the source for this peak since it has a very small slow component and a fast component of about one order of magnitude smaller than free water.
Finally we note that similar results were obtained for DDCOSY with Δ = 30 ms. Furthermore, the DDCOSY map exhibits only diagonal features when both gradient pulse pairs are applied in the same direction since the diffusion process in the same direction must be autocorrelated and there cross correlation must not occur.
CONCLUSIONS
The 1D relaxation and diffusion measurements reveal separate distributions of T2 and D values. Understanding the connections between these various components is only unambiguously possible by carrying out the DRCOSY correlation experiment. The DRCOSY map obtained here for chopped chive samples shows six different peaks, corresponding to six different states of water molecules.
The challenge is to understand how these components relate to the various forms of water compartmentalization associated with the different chive cells. One means of making such assignments is via diffusion anisotropy. The 1D diffusion measurements made both parallel and perpendicular to the chive axis, reveals the anisotropy properties. We are able to correlate these compartments with the six states of the DRCOSY map using the values of the diffusion coefficient, relaxation time, and peak intensity.
Finally the DDCOSY experiment can be used to show how these various water peaks are related to cell shape and orientation. This represents a final step in the relaxation/diffusion correlation methods, giving the unequivocal assignment of different water components to different cell sites, and at a size scale beyond the resolution of standard NMR microscopy methods.
Acknowledgments
David Flynn is thanked for assisting the preparation of the chive sample for optical micrography. Peter K. Watson is thanked for assisting in taking the optical micrographs. Philip Garnock-Jones is thanked for discussions toward understanding of the optical micrographs.
The authors are grateful to the New Zealand Foundation for Research, Science and Technology, and the Royal Society of New Zealand Marsden Fund, and Centres of Research Excellence Fund, for Grant Support.
References
- 1.Furo, I., and S. V. Dvinskikh. 2002. NMR methods applied to anisotropic diffusion. Magn. Reson. Chem. 40:S3–S14. [DOI] [PubMed] [Google Scholar]
- 2.Callaghan, P. T., and I. Furo. 2004. Diffusion-diffusion correlation and exchange as a signature for local order and dynamics. J. Chem. Phys. 120:4032–4038. [DOI] [PubMed] [Google Scholar]
- 3.Kärger, J., H. Pfeiffer, and W. Heink. 1988. Principles and application of self-diffusion measurements by nuclear magnetic resonance. Adv. Magn. Reson. 12:1–89. [Google Scholar]
- 4.Callaghan, P. T., and M. E. Komlosh. 2002. Locally anisotropic motion in a macroscopically isotropic system: displacement correlations measured using double pulsed gradient spin-echo NMR. Magn. Reson. Chem. 40:S15–S19. [Google Scholar]
- 5.Godefroy, S., and P. T. Callaghan. 2003. 2D relaxation/diffusion correlations in porous media. Magn. Reson. Imaging. 21:381–383. [DOI] [PubMed] [Google Scholar]
- 6.Qiao, Y., P. Galvosas, T. Adalsteinsson, M. Schönhoff, and P. T. Callaghan. 2005. Diffusion exchange NMR spectroscopic study of dextran exchange through polyelectrolyte multilayer capsules. J. Chem. Phys. 122:214912. See also Virtual Journal of Nanoscale Science and Technology 2005. Vol. 11, issue 24, http://www.vjnano.org/nano/. [DOI] [PubMed] [Google Scholar]
- 7.Tanner, J. E. 1970. Use of the stimulated echo in NMR diffusion studies. J. Chem. Phys. 52:2523–2526. [Google Scholar]
- 8.Reference deleted in proof.
- 9.Meiboom, S., and D. Gill. 1958. Modified spin-echo method for measuring nuclear relaxation times. Rev. Sci. Instrum. 29:688–691. [Google Scholar]
- 10.Venkataramanan, L., Y. Q. Song, and M. D. Hurlimann. 2002. Solving Fredholm integrals of the first kind with tensor product structure in 2 and 2.5 dimensions. IEEE Trans. Signal Process. 50:1017–1026. [Google Scholar]
- 11.Song, Y. Q., L. Venkataramanan, M. D. Hurlimann, M. Flaum, P. Frulla, and C. Straley. 2002. T-1-T-2 correlation spectra obtained using a fast two-dimensional Laplace inversion. J. Magn. Reson. 154:261–268. [DOI] [PubMed] [Google Scholar]
- 12.Hubbard, P. L., K. M. McGrath, and P. T. Callaghan. 2005. A study of anisotropic water self-diffusion and defects in the lamellar mesophase. Langmuir. 21:4340–4346. [DOI] [PubMed] [Google Scholar]
- 13.Esau, K. 1960. Anatomy of Seed Plants. John Wiley & Sons, New York.


