Abstract
Membranes composed of bipolar tetraether lipids have been studied by a series of 25-ns molecular dynamics simulations to understand the microscopic structure and dynamics as well as membrane area elasticity. By comparing macrocyclic and acyclic tetraether and diether archaeal lipids, the effect of tail linkage of the two phytanyl-chained lipids on the membrane properties is elucidated. Tetraether lipids show smaller molecular area and lateral mobility. For the latter, calculated diffusion coefficients are indeed one order-of-magnitude smaller than that of the diether lipid. These two tetraether membranes are alike in many physical properties except for membrane area elasticity. The macrocyclic tetraether membrane shows a higher elastic area expansion modulus than its acyclic counterpart by a factor of three. Free energy profiles of a water molecule crossing the membranes show no major difference in barrier height; however, a significant difference is observed near the membrane center due to the lack of the slip-plane in tetraether membranes.
INTRODUCTION
Archaea, which live under extreme conditions such as high temperature, lack of oxygen, high acidic and/or salt-rich environments, have special kinds of membrane lipids (1–3). Archaeal lipids are typically composed of saturated isoprenoid chains attached to glycerols by ether linkages, whereas membranes found in eubacteria, plants, and animals consist of mainly ester-linked glycerolipids (2). Among archaeal lipids, of particular interest are the unusual bipolar tetraether lipids, which can be found in methanogenic and acidothermophilic and some psychrophilic species. These lipids are called caldarchaeol lipids bearing a 72-membered macrocyclic ring formed by biphytanyl chains. The bipolar tetraether lipids are thought to span the membrane, and liposomes made from these lipids form a monolayer rather than the bilayer formed with conventional glycerophospholipids (4,5). The distinctive molecular structure of archaeal lipids allows the microorganisms to maintain membrane integrity in harsh environments.
Owing to the high stability and low permeability of their membranes, archaeal bipolar lipids attract considerable attention for biotechnological application (6–8). In fact, many archaeal lipid analogs have already been synthesized to generate novel supramolecular structures and molecular materials (4,9–11). For these applications, understanding the relation between lipid molecular structure and the assembled membrane properties is of key importance. Along this line, a series of molecular dynamics (MD) simulations of archaeal lipid bilayers were undertaken to elucidate the effect of chain branching and ether-linkages, instead of ester-linkages, of archaeal lipids on the physical properties of the membranes (12–16). As a result of chain branching, chain tangling frequently occurs between the neighboring lipids in the same leaflet of bilayers (14), and lipid dynamics including conformational as well as overall motions are significantly reduced (15). These changes should result in high structural stability. In addition, the slower lipid motion reduces mobility of small permeants such as a water molecule in the membrane interior, which accounts for the reduced permeability across branched lipid membranes (16). Substitution of ether linkages for ester linkages also causes a significant effect on the membrane dipole potential, which is indeed reduced by a factor of two (13,17). Reduced hydration of the ether functional group then gives rise to a reduction of lipid molecular area and an enlargement of the free energy barrier for hydrophilic molecules to go across the membrane (13).
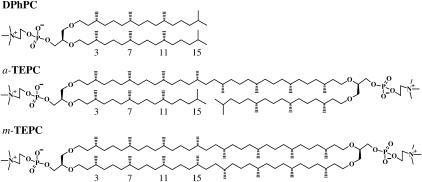
In this article, we describe an MD study of bipolar tetraether membranes, which are believed to work better in many biotechnological applications due to the high membrane stability. Although most tetraether lipids found in natural membranes have macrocycles formed from biphytanyl chains, acyclic tetraether lipids are also important in developing novel synthetic membrane materials. To highlight the most characteristic features of bipolar tetraether lipid membranes, we compared three phosphatidylcholine (PC) lipid membranes with different hydrophobic backbones that involve 0, 1, or 2 aliphatic chains that span the membrane, namely, a diether lipid (DPhPC) and acyclic and macrocyclic tetraether lipids (a-TEPC and m-TEPC) as shown in Fig. 1. Our MD simulations will shed light on essential physical properties of bipolar tetraether lipid membranes by investigating the effect of the tail linkages of hydrophobic chains of two diether lipids on membrane area, elasticity, free energy barrier for a water molecule, and lipid dynamics.
FIGURE 1.
Chemical structures of 1,2-di-O-phytanyl-sn-glycero-3-phosphocholine (diphytanyl phosphatidylcholine, DPhPC), 1,2′-O-biphytanyl-1′,2-di-O-phytanyl-sn-diglycero-3,3′-bisphosphocholine (acyclic tetraether phosphatidylcholine, a-TEPC), and tetra-O-di(biphytanyl)-sn-diglycero-3,3′-bisphosphocholine (macrocyclic tetraether phosphatidylcholine, m-TEPC). The ether linkages in the glycerol backbones of these lipids were consistently set in an sn-1,2 configuration to compare MD simulation results for these lipids with those in previous articles (13–16), whereas natural archaeal lipids are characterized by an exceptional sn-2,3 configuration.
METHODS
Molecular dynamics simulations
Twenty-five-nanosecond MD simulations of three lipid membrane systems (DPhPC, a-TEPC, and m-TEPC, respectively) have each been undertaken in the isothermal-isobaric (NPT) ensemble. The temperature was maintained at 298 K by using the Nosé-Hoover chain method (18) with a relaxation time of 0.5 ps. The Parrinello-Rahman scheme with the modularly invariant momentum form (19,20) was employed to realize the hydrostatic pressure of 0.1 MPa with a relaxation time of 2 ps, while the angular degrees of freedom of the MD cell were eliminated during the production run. The remaining details of the MD techniques used here are the same as in the previous studies (13–16). The hydrated DPhPC bilayer membrane consists of 72 DPhPC molecules and 2088 water molecules, with two tetraether (m-TEPC and a-TEPC) membrane systems containing 36 lipids and 2088 water molecules; both of these systems contain 29 water molecules per PC headgroup. The CHARMM PARAM27 force field (21,22) was used for the lipid molecules, except for the ether linkage. The parameters for the ether linkages were taken from a previous article (13). As for water, the TIP3P model (23) was used. The MD simulation of the DPhPC bilayer is a continuation of a previous MD run (13), where the MD time was elongated to 25 ns after equilibration. Initial conformations of tetraether lipids were built by linking the terminal groups of two DPhPC structures, which were constructed on the basis of the crystalline dimyristoyl phosphatidylcholine structure (24). The modeled TEPC had an all-trans conformation along the main hydrophobic chain. The TEPC molecules were packed into a monolayer membrane and water layers were added on both sides of the monolayer. We assumed that all lipids had spanning conformations to form a monolayer, ignoring a possible minor occurrence of a looping conformation of a tetraether lipid (5). After energy minimizations, NPT-MD simulations were carried out. In the first 500 ps, the temperature was set to 353 K to enhance the melting of hydrocarbon chains of tetraether lipids. Then, after changing the temperature to 298 K, 4.5 ns MD calculations were carried out for the equilibration of the system. The production run was performed for 25 ns for each system, and the trajectory data were stored every 80 fs for data analysis. All MD simulations were carried out by using our own in-house software, MPDyn (25).
Free energy calculations
A free-energy profile of a water molecule across the membranes was calculated by using cavity insertion (CI) (26) and probability ratio methods (27). The CI method is an extension of Widom's particle insertion method (28). In the CI technique, trial insertions are made only to the cavities that are found in advance within the simulation box. This improves the computational efficiency and accuracy of the original insertion method. In the NPT ensemble, the excess chemical potential, μex, at the position of z along the membrane normal is calculated by using the equation
 |
where V is the system volume, N is the number of molecules, ΔU is the interaction energy of the inserted molecule with surroundings, Pcav is the probability of finding a cavity with a radius of at least Rcav. β = 1/kBT, and kB is the Boltzmann constant and T is the temperature. The free energy profile of a molecule along the membrane normal, z, was evaluated by the equation
 |
The reference state, z0, was selected at the center of the water layer. As in the previous report (13,16), four different cavity radii (Rcav = 2.6, 2.7, 2.8, and 2.9 Å) and two series of grid positions were employed to obtain a single free energy profile. In addition, a Gaussian filter was applied to the free energy profiles with the variance parameter of 1 Å, which removed statistical noise without changing the profiles. Insertion methods generally become less accurate when polar or large molecules insert into dense polar solvents. In our case, the CI method degraded when a water molecule was inserted into the membrane/water interfacial region or into water. Therefore, we used the probability ratio method (27) instead to obtain the free energy profile of water in this region,
 |
where ρ(z) is the probability density of water at z. Using this relation, we obtained the free energy profile of a water molecule by analyzing the local densities of water in the course of MD runs. Finally, to obtain a single free energy profile of water, we merged the two profiles calculated by these methods by least-square fitting for the data in the region of z = 12–15 Å. The fitting error was <0.2 kcal/mol, and the possible error in the total height of the free energy barrier due to the fitting should be <kBT (16). In addition, as a result of the fitting, the same shifting value for the chemical potential by the CI method was obtained for all three membranes. Therefore, even though the total energy barrier can have an error of kBT, a comparison among these three membranes in the membrane interior, where the CI method provides an accurate chemical potential, should have much higher accuracy (∼0.2 kcal/mol).
Data analysis
Membrane area elasticity is one of the most important physical quantities to characterize the mechanical properties of membrane. Because we used an NPT ensemble, the elastic area expansion modulus, KA, was calculated by using the following equation derived from linear response theory (29–31),
 |
where A is the averaged cross-sectional area of a lipid and Nm is the number of lipid molecules aligned in a lipid layer. The bracket denotes the ensemble average. This equation denotes that the elastic modulus of the membrane area expansion is inversely proportional to area fluctuations.
The deuterium order parameter, SCD, describes the segmental order of hydrocarbon chains,
 |
where  is the unit bond vector from carbon to deuterium (hydrogen) atoms in the hydrocarbon segment and
  is the unit vector along the bilayer normal. The brackets denote an averaging over all lipids and time.
Lateral diffusion coefficients of lipid molecules were calculated by using the Einstein relation (32),
 |
This relation is valid for long time t. The term in the bracket on the right-hand side of the equation denotes the two-dimensional mean-square displacement (MSD) of the lipid centers-of-mass (COM) in the membrane plane. During the MD runs, the lipid membrane itself can move, even though the total system (including water) momentum is kept to be 0. Therefore, MSD was corrected by the COM motion of the lipid membrane, i.e., we fixed the observation point on the membrane (33). The correction was especially important for TEPC membranes. The same correction was made for all analyses of lipid dynamics.
RESULTS AND DISCUSSION
Membrane dimensions and elasticity of area expansion
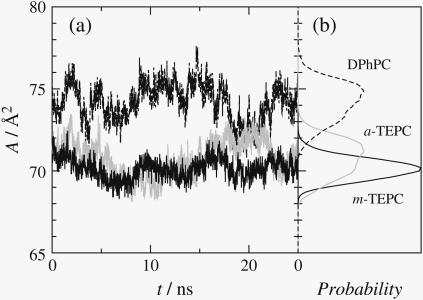
Fig. 2 a plots the time evolution of the lipid molecular area averaged over the simulation cell. These plots demonstrate that there exist long-term fluctuations of the molecular area with a frequency of several nanoseconds. Similar observations were reported for other lipid membrane (34) and membrane protein systems (35). The time-averaged area and the membrane thickness (dPP) are listed in Table 1. Compared with DPhPC, both tetraether lipids have smaller molecular area, and their membranes increase in thickness. The difference between a- and m-TEPCs is minor, although m-TEPC reduces the molecular area slightly. Calculations of A × dpp would give a reasonable evaluation of the net volume of the membrane unit (i.e., the packing density of membrane core), and the values are 2834, 2782, and 2752 Å3 for DPhPC, a-TEPC, and m-TEPC, respectively. Thus, the m-TEPC membrane has higher density in the membrane interior.
FIGURE 2.
(a) Time evolution of the averaged molecular area and (b) its probability distribution. (Dashed lines, DPhPC; shaded lines, a-TEPC; and solid lines, m-TEPC.)
TABLE 1.
Averaged molecular area A [Å2], peak-to-peak distance of electron density profile dPP [Å], and elastic area expansion modulus KA [dyn/cm]
| A | dPP | KA | |
|---|---|---|---|
| DPhPC | 74.2 | 38.2 | 670 |
| a-TEPC | 70.8 | 39.3 | 710 |
| m-TEPC | 70.2 | 39.2 | 2020 |
In Fig. 2 b, the probability distributions of averaged molecular area are plotted for all simulated membranes, respectively. The dispersions are in inverse proportion to the elastic constants for area expansion, which are listed in Table 1. Interestingly, although the m-TEPC membrane shows an approximately three-times-higher elastic modulus than DPhPC, the a-TEPC membrane has comparable elasticity to the DPhPC bilayer. It is notable that flexibility of membrane area expansion is quite sensitive to whether the tetraether has a cyclic chain structure or not. Since the membrane that has a higher area expansion modulus generally shows the higher tensile strength, i.e., higher membrane tension at the vesicle failure (36), it is suggested that the m-TEPC membrane has higher stability to the external mechanical forces.
Structure
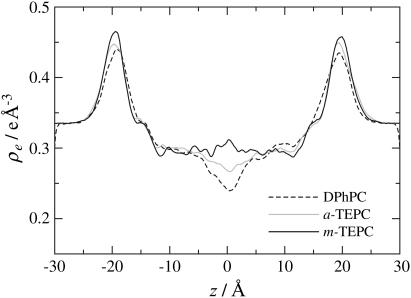
Fig. 3 plots the electron density profiles of the three lipid membranes along the membrane normal. As for the DPhPC bilayer, there are two peaks at |z| ∼ 19 Å, which correspond to the position where phosphorus groups exist, and a trough at the center of the bilayer. A similar profile was typically observed for many bilayer membranes (16,31), and the low-density region at the bilayer center corresponds to the slip plane between two lipid leaflets of the bilayer. This trough diminishes in tetraether membranes and has completely disappeared in the density profile of the m-TEPC membrane. The other noticeable difference among the three membranes is found in the height and position of the two peaks. Tetraether lipids show the higher peaks, which are shifted slightly to the outside, forming a thicker membrane (Table 1). The m-TEPC membrane has especially sharp peaks. This indicates that the phosphate moieties of the m-TEPC lipids align within a small z-level in the membrane. In other words, the m-TEPC membrane has a flat surface. The protrusion of a single lipid from the surface is frequently observed in a bilayer membrane, which indicates a bumpy surface at the molecular level (31,37,38). In the m-TEPC membrane, the single molecule protrusion was significantly suppressed. In the case of tetraether membranes, a protrusion disturbs two interfaces, because each lipid spans the membrane. Therefore, the single molecule protrusion should cost higher energy in the TEPC membranes than in the DPhPC bilayer. In addition, the fact that the cyclic hydrocarbon ring of the m-TEPC lipid enhances the structural correlation between two polar groups accounts for the planar surface of the m-TEPC membrane. Although this observation occurs at the microscopic level, the results suggest that the m-TEPC membrane has much higher bending rigidity than does DPhPC (39). The planar TEPC membranes should also be partly attributable to the lower flexibility of the membrane core, as shown later.
FIGURE 3.
Electron density profiles along the membrane normal, z. The center of the membrane core is taken at z = 0.
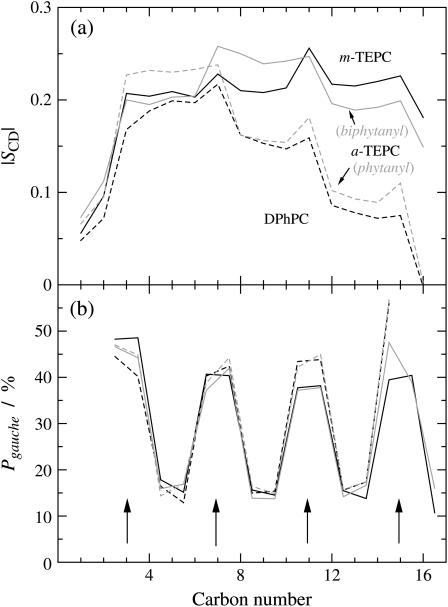
Another feature of tetraether membranes appears in the local structure of the hydrophobic chains. The segmental order of hydrocarbon chains is usually characterized by the deuterium order parameter, SCD, which is plotted as a function of the carbon number in Fig. 4 a. Since the biphytanyl chain is symmetric, the averaged values are plotted for half of the chain in this figure. In addition, a slight difference between the sn-1 and sn-2 phytanyl chains is of minor importance and ignored in this discussion. The order parameter profile of the DPhPC bilayer, which is similar to that of the ester-linked DPhPC (13,14), shows a stepwise variation as a function of the carbon number. The steps occur at the branching segments, and the dihedral angles around the bonds relevant to the branching segments show a high probability of gauche conformers (Fig. 4 b). Gauche conformers along the main chain give rise to the chain bending. Thus, the phytanyl chains reorient their directions selectively at the branching segments. In the tail region, the segmental order decreases due to the high flexibility. In this way, the stepwise reduction of the order parameter profiles along the phytanyl chains is explained. The phytanyl chain of a-TEPC shows slightly higher order than that of DPhPC, which may be due to the effect of the ordered membrane-spanning chain. As for biphytanyl chains, a large reduction of the segmental order was not observed even at the membrane center; only a slight dip was found at C16, i.e., the junction of two phytanyl chains, in the order parameter profiles. Although the increase of the probability of gauche conformers was observed for the tail region of phytanyl chains (C10∼C16), this was not the case for the biphytanyl chains. The biphytanyl chains increase their segmental order throughout the chain.
FIGURE 4.
(a) Deuterium order parameter, SCD, and (b) probability of gauche conformers as a function of carbon number in the hydrophobic chains. The carbon number denotes the segmental number counting from ether-linkage along the hydrophobic main chain. (Dashed lines, DPhPC; solid lines, m-TEPC; and shaded and shaded dashed lines, biphytanyl and phytanyl chains of a-TEPC, respectively. The arrows in b denote the positions of branching carbons.)
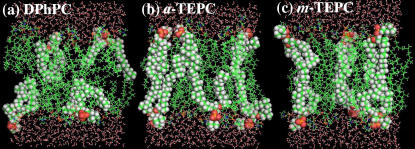
Snapshots of the simulated membrane systems are presented in Fig. 5. All atoms in several selected lipid molecules are represented by spheres to permit seeing typical lipid conformations. Similar to the ester-DPhPC bilayer (14), chain crossing between the neighboring lipid chains occurs frequently in the DPhPC bilayer, and two phytanyl chains in a single lipid do not always align parallel to each other due to the chain bending at the branching segments. This is also true for a-TEPC. In case of m-TEPC, however, the chain crossing is prohibited due to the cyclic chain structure. This gives rise to neat alignment of cyclic biphytanyl chains in the membrane core. Despite such high-density packing of the biphytanyl chains, ∼40% gauche defects in the vicinity of the branching segments prevent the biphytanyl chain from going into the crystalline state.
FIGURE 5.
Snapshots (20 Å slab) of the membrane systems during the MD simulation. (a) DPhPC, (b) a-TEPC, and (c) m-TEPC. Phosphorus atoms are yellow, nitrogens are blue, oxygens are red, carbons are green, and hydrogens are white. Atoms in several selected lipid molecules are represented by spheres to show typical lipid conformations clearly.
Free energy barriers
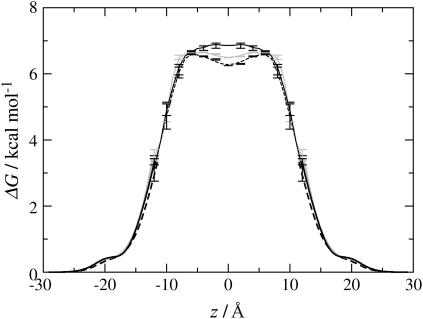
Permeability is often used to assess the membrane stability. The free energy barrier of a molecule to go across membranes provides useful information in considering the permeability. Fig. 6 plots the calculated free energy profiles of a water molecule across the membranes, which are obtained by merging the two profiles calculated by the CI method (26) and the probability ratio method (27). It is clear from the figure that there is a large energy barrier for a water molecule to go across the membrane. The calculated energy barriers are 6.6, 6.7, and 6.9 kcal/mol for the DPhPC, a-TEPC, and m-TEPC membranes, respectively. Now it will be worth seeing how much the difference of the free energy barriers explains the difference of the permeability. A computation of the permeability needs the full profiles of free energy and mobility (diffusion constant) of the solute across the membrane (see Eqs. 17 and 20 of (27)). Assuming that the diffusion rate of water is constant, i.e., 10−5 cm2/s, along the membrane, we estimate the water permeability for all membranes. Thus we obtain 1.12 ± 0.20 × 10⁻³, 0.96 ± 0.21 × 10⁻³, and 0.96 ± 0.17 × 10⁻³ cm/s for DPhPC, a-TEPC, and m-TEPC membranes, respectively. The difference among these values is minor, which is in conflict with the experimental measurement that tetraether membranes have lower water permeability by approximately one order of magnitude (40). This result suggests that the lower mobility of water in the tetraether than in the diether membranes will be the dominant reason for the significantly reduced water permeability of tetraether membranes.
FIGURE 6.
Free-energy profiles of a water molecule across the membranes. (Dashed lines, DPhPC; shaded lines, a-TEPC; and solid lines, m-TEPC.) The center of the membrane core is taken at z = 0.
In Fig. 6, a difference in the three profiles is found in the membrane interior (|z| < 7 Å). The DPhPC bilayer has a small depression at the bilayer center, which is commonly observed in ordinary lipid bilayer membranes (16,27). This depression occurs due to a high probability of free volume, which is large enough for a water molecule to get in, at the slip plane between two leaflets of the lipid bilayer (16,26,41). The m-TEPC membrane, which has no slip plane, shows no depression at the membrane center, whereas the a-TEPC membrane gives a slight free energy well. These differences suggest a different permeation process of water in the membrane core. As it has been already discussed for bilayer membranes in the literature (16,27), once a water molecule gets into the bilayer, the molecule migrates around the bilayer center, i.e., within the shallow free energy well, and show higher mobility in the membrane plane than in the normal direction. The water molecule entrapped in the slip plane can find a pathway to go out of the bilayer during the migration along the membrane plane (16). This picture will be largely changed in case of the m-TEPC membrane due to the lack of the slip plane at the membrane center. In the m-TEPC membrane interior, a water molecule always feels the thermodynamic force toward the outside of the membrane and the lateral motion of the penetrant will be quite limited. The mobility of the penetrant inside the membrane is largely affected by that of the lipid chains (16). As shown in the next section, the dynamics of biphytanyl chains is much slower than that of phytanyl chains. Furthermore, the difference is remarkable at the membrane center. Thus, again, it is suggested that the diffusion rate of a water molecule across the m-TEPC membrane will be significantly reduced.
Dynamical properties
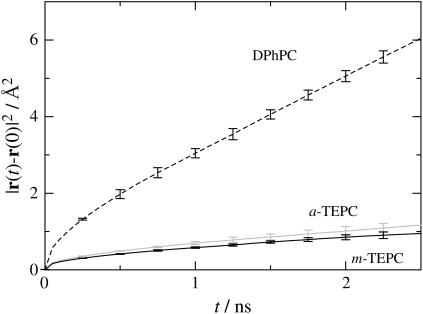
In membranes, the individual lipid molecules show substantial lateral mobility in the liquid crystal phase. However, it is known that the lateral diffusion of archaeal lipids is much slower than that of the ordinary straight-chained bilayer lipids (42,43). Fig. 7 shows 25-ns trajectories of the COM of individual lipid molecules plotted with the time interval of 10 ps. We observed that some of the DPhPC molecules moved beyond the cage formed by the neighboring lipids during this time period, although a rearrangement of the lateral lipid packing occurred only partially. The trace pattern shown in the figure is qualitatively similar to that observed in ordinary lipid membranes such as DPPC (15,44,45), even though the translational motion of DPhPC is significantly slower than that of DPPC (15). Furthermore, lateral diffusion of the TEPC molecules was quite limited; just an initial stage of translational diffusion (i.e., almost librational motion within the cage) was observed for TEPC throughout the time span of 25 ns. This does not mean, however, that the TEPC membranes freeze at this temperature. The fact that TEPC molecules have translational mobility is confirmed from plots of lateral mean-square displacements (MSD) of the lipid COM (Fig. 8). The plots for TEPC molecules show MSD increase with increasing time, though the gradient is much smaller than that of DPhPC. Calculated lateral diffusion coefficients (DL) for DPhPC, a-TEPC, and m-TEPC are 4.82 ± 0.30 × 10⁻⁸, 0.78 ± 0.13 × 10⁻⁸, and 0.53 ± 0.17 × 10⁻⁸ cm2 s−1, respectively. The lateral mobility of m-TEPC is actually lower than that of DPhPC by one order of magnitude. Similar observations have been reported by experimental measurements (42,43); the DL of m-TEPC is comparable to the experimental measurement, 0.5∼0.6 × 10⁻⁸ cm2 s−1, for Thermoplasma acidophilum at 303 K by 31P-NMR (43). The reduction of the lipid lateral mobility cannot be understood only by a mass effect. As for TEPC membranes, it is clear that the effect of the macrocyclic structure on the lateral mobility is also significant.
FIGURE 7.
Twenty-five-nanosecond trajectories of lipid centers-of-mass (COM) on the membrane plane. (a) DPhPC, (b) a-TEPC, and (c) m-TEPC. The lines connecting the COM positions are calculated every 10 ps. For DPhPC, trajectories of the lipids in the upper leaflet are plotted.
FIGURE 8.
Mean-square displacements of lipid COM in the membrane plane. Error bars represent the maximum and minimum values among three individual statistics by splitting trajectory into increments of 8.33 ns.
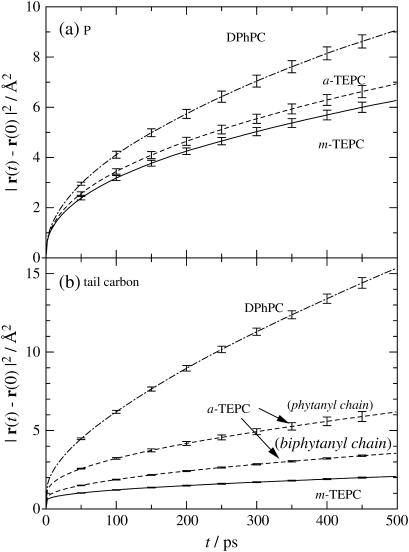
Now we turn our attention to segmental dynamics of lipid molecules. Fig. 9 plots three-dimensional MSD of phosphorus and C15 (see Fig. 1) atoms, respectively. The segmental dynamics are also reduced in the same order as lateral diffusion, i.e., DPhPC ≫ a-TEPC > m-TEPC. The figure elucidates that the effect of the tail linkage is minor for phosphorus motion, but is quite significant for the dynamics of the C15 atom. In the case of a-TEPC, the existence of a biphytanyl membrane-spanning chain affects the dynamics of the short phytanyl chains significantly. A long and slow chain may disturb the dynamics of the short phytanyl chain by reducing the accessible free volume in the membrane core (Fig. 3).
FIGURE 9.
Mean-square displacements of (a) phosphorus and (b) C15 atoms. Error bars represent the maximum and minimum values among five individual statistics by splitting trajectory into increments of 5 ns.
CONCLUSIONS
To elucidate the effect of tail linkage of phytanyl chains on the membrane properties, we have compared the DPhPC bilayer and a- and m-TEPC membranes by using MD simulations. TEPC molecules show smaller molecular area and lateral mobility. For the latter, calculated diffusion coefficients are indeed one order-of-magnitude smaller than that of DPhPC. Segmental motions of the TEPC molecule are also reduced. a-TEPC is analogous to m-TEPC in many physical properties except for membrane elastic area expansion modulus, which is a factor-of-three lower. Free-energy profiles of a water molecule across the membranes show no major difference in barrier height, whereas a significant difference is observed near the membrane center. It was suggested that the permeation mechanism of small molecules should be changed due to the lack of a slip plane in the TEPC membranes.
Supplementary Material
Acknowledgments
The authors thank Dr. Steve O. Nielsen for his helpful comments on the manuscript.
This work was partly supported by NAREGI Nanoscience Project, Ministry of Education, Culture, Sports, Science and Technology, Japan. The simulations were carried out on the computers at the Research Center for Computational Science, Okazaki Research Facilities, National Institutes of Natural Sciences.
References
- 1.De Rosa, M., and A. Gambacorta. 1988. The lipids of archaebacteria. Prog. Lipid Res. 27:153–175. [DOI] [PubMed] [Google Scholar]
- 2.Gambacorta, A., A. Trincone, B. Nicolaus, L. Lama, and M. De Rosa. 1994. Unique features of lipids of archaea. Syst. Appl. Microbiol. 16:518–527. [Google Scholar]
- 3.Sprott, G. D. 1992. Structures of archeabacteria membrane lipids. J. Bioenerg. Biomembr. 24:555–566. [DOI] [PubMed] [Google Scholar]
- 4.Benvegnu, T., M. Brard, and D. Plusquellec. 2004. Archaeabacteria bipolar lipid analogues: structure, synthesis and lyotropic properties. Curr. Opinion Colloid Interf. Sci. 8:469–479. [Google Scholar]
- 5.Cuccia, L. A., F. Morin, A. Beck, N. Hebert, G. Just, and R. B. Lennox. 2000. Spanning or looping? The order and conformation of bipolar phospholipids in lipid membranes using 2H NMR spectroscopy. Chemistry. 6:4379–4384. [DOI] [PubMed] [Google Scholar]
- 6.De Rosa, M., A. Morana, A. Riccio, A. Gambacorta, A. Trincone, and O. Incani. 1994. Lipids of the archaea—a new tool for bioelectronics. Biosens. Bioelectron. 9:669–675. [Google Scholar]
- 7.Gambacorta, A., A. Gliozzi, and M. De Rosa. 1995. Archaeal lipids and their biotechnological applications. World J. Microbiol. Biotechnol. 11:115–131. [DOI] [PubMed] [Google Scholar]
- 8.Patel, G. B., and G. D. Sprott. 1999. Archaeobacterial ether lipid liposomes (archaeosomes) as novel vaccine and drug delivery systems. Crit. Rev. Biotechnol. 19:317–357. [DOI] [PubMed] [Google Scholar]
- 9.Baba, T., Y. Toshima, H. Minamikawa, M. Hato, K. Suzuki, and N. Kamo. 1999. Formation and characterization of planar lipid bilayer membranes from synthetic phytanyl-chained glycolipids. Biochim. Biophys. Acta. 1421:91–102. [DOI] [PubMed] [Google Scholar]
- 10.Gliozzi, A., A. Relini, and P. L. G. Chong. 2002. Structure and permeability properties of biomimetic membranes of bolaform archaeal tetraether lipids. J. Membr. Sci. 206:131–147. [Google Scholar]
- 11.Minamikawa, H., and M. Hato. 1997. Phase behavior of synthetic phytanyl-chained glycolipid/water systems. Langmuir. 13:2564–2571. [Google Scholar]
- 12.Husslein, T., D. M. Newns, P. C. Pattnaik, Q. F. Zhong, P. B. Moore, and M. L. Klein. 1998. Constant pressure and temperature molecular-dynamics simulation of the hydrated diphytanoylphosphatidylcholine lipid bilayer. J. Chem. Phys. 109:2826–2832. [Google Scholar]
- 13.Shinoda, K., W. Shinoda, T. Baba, and M. Mikami. 2004. Comparative molecular dynamics study of ether- and ester-linked phospholipid bilayers. J. Chem. Phys. 121:9648–9654. [DOI] [PubMed] [Google Scholar]
- 14.Shinoda, W., M. Mikami, T. Baba, and M. Hato. 2003. Molecular dynamics study on the effect of chain branching on the physical properties of lipid bilayers: structural stability. J. Phys. Chem. B. 107:14030–14035. [Google Scholar]
- 15.Shinoda, W., M. Mikami, T. Baba, and M. Hato. 2004. Dynamics of a highly branched lipid bilayer: a molecular dynamics study. Chem. Phys. Lett. 390:35–40. [Google Scholar]
- 16.Shinoda, W., M. Mikami, T. Baba, and M. Hato. 2004. Molecular dynamics study on the effects of chain branching on the physical properties of lipid bilayers: 2. permeability. J. Phys. Chem. B. 108:9346–9356. [Google Scholar]
- 17.Gawrisch, K., D. Ruston, J. Zimmerberg, V. A. Parsegian, R. P. Rand, and N. Fuller. 1992. Membrane dipole potentials, hydration forces, and the ordering of water at membrane surfaces. Biophys. J. 61:1213–1223. [DOI] [PMC free article] [PubMed] [Google Scholar]
- 18.Martyna, G. J., M. L. Klein, and M. Tuckerman. 1992. Nose-Hoover chains—the canonical ensemble via continuous dynamics. J. Chem. Phys. 97:2635–2643. [Google Scholar]
- 19.Martyna, G. J., D. J. Tobias, and M. L. Klein. 1994. Constant-pressure molecular-dynamics algorithms. J. Chem. Phys. 101:4177–4189. [Google Scholar]
- 20.Parrinello, M., and A. Rahman. 1980. Crystal-structure and pair potentials—a molecular-dynamics study. Phys. Rev. Lett. 45:1196–1199. [Google Scholar]
- 21.Feller, S. E., and A. D. MacKerell. 2000. An improved empirical potential energy function for molecular simulations of phospholipids. J. Phys. Chem. B. 104:7510–7515. [Google Scholar]
- 22.MacKerell, A. D., D. Bashford, M. Bellott, R. L. Dunbrack, J. D. Evanseck, M. J. Field, S. Fischer, J. Gao, H. Guo, S. Ha, D. Joseph-McCarthy, L. Kuchnir, K. Kuczera, F. T. K. Lau, C. Mattos, S. Michnick, T. Ngo, D. T. Nguyen, B. Prodhom, W. E. Reiher, B. Roux, M. Schlenkrich, J. C. Smith, R. Stote, J. Straub, M. Watanabe, J. Wiorkiewicz-Kuczera, D. Yin, and M. Karplus. 1998. All-atom empirical potential for molecular modeling and dynamics studies of proteins. J. Phys. Chem. B. 102:3586–3616. [DOI] [PubMed] [Google Scholar]
- 23.Jorgensen, W. L., J. Chandrasekhar, J. D. Madura, R. W. Impey, and M. L. Klein. 1983. Comparison of simple potential functions for simulating liquid water. J. Chem. Phys. 79:926–935. [Google Scholar]
- 24.Pearson, R., and I. Pascher. 1979. The molecular structure of lecithin dihydrate. Nature. 281:499–501. [DOI] [PubMed] [Google Scholar]
- 25.Shinoda, W., and M. Mikami. 2003. Rigid-body dynamics in the isothermal-isobaric ensemble: a test on the accuracy and computational efficiency. J. Comput. Chem. 24:920–930. [DOI] [PubMed] [Google Scholar]
- 26.Jedlovszky, P., and M. Mezei. 2000. Calculation of the free energy profile of H2O, O2, CO, CO2, NO, and CHCl3 in a lipid bilayer with a cavity insertion variant of the Widom method. J. Am. Chem. Soc. 122:5125–5131. [Google Scholar]
- 27.Marrink, S. J., and H. J. C. Berendsen. 1994. Simulation of water transport through a lipid-membrane. J. Phys. Chem. 98:4155–4168. [Google Scholar]
- 28.Frenkel, D., and B. Smit. 2002. Understanding of Molecular Simulation, 2nd Ed. Academic Press, San Diego.
- 29.Feller, S. E., and R. W. Pastor. 1999. Constant surface tension simulations of lipid bilayers: the sensitivity of surface areas and compressibilities. J. Chem. Phys. 111:1281–1287. [Google Scholar]
- 30.Kubo, R. 1957. Statistical-mechanical theory of irreversible processes. I. General theory and simple applications to magnetic and conduction problems. J. Phys. Soc. Jpn. 12:570–586. [Google Scholar]
- 31.Shinoda, W., N. Namiki, and S. Okazaki. 1997. Molecular dynamics study of a lipid bilayer: convergence, structure, and long-time dynamics. J. Chem. Phys. 106:5731–5743. [Google Scholar]
- 32.Hansen, J. P., and I. R. McDonald. 1986. Theory of Simple Liquids, 2nd Ed. Academic Press, London.
- 33.Böckmann, R. A., A. Hac, T. Heimburg, and H. Grubmüller. 2003. Effect of sodium chloride on a lipid bilayer. Biophys. J. 85:1647–1655. [DOI] [PMC free article] [PubMed] [Google Scholar]
- 34.Lindahl, E., and O. Edholm. 2000. Mesoscopic undulations and thickness fluctuations in lipid bilayers from molecular dynamics simulations. Biophys. J. 79:426–433. [DOI] [PMC free article] [PubMed] [Google Scholar]
- 35.Allen, T. W., T. Bastug, S. Kuyucak, and S. H. Chung. 2003. Gramicidin A channel as a test ground for molecular dynamics force fields. Biophys. J. 84:2159–2168. [DOI] [PMC free article] [PubMed] [Google Scholar]
- 36.Needham, D. 1995. Cohesion and permeability of lipid bilayer vesicles. In Permeability and Stability of Lipid Bilayers. E.A. Disalvo, and S.A. Simon, editors. CRC Press, Boca Raton, FL. 49–76.
- 37.Hoyrup, P., T. H. Callisen, M. O. Jensen, A. Halperin, and O. G. Mouritsen. 2004. Lipid protrusions, membrane softness, and enzymatic activity. Phys. Chem. Chem. Phys. 6:1608–1615. [Google Scholar]
- 38.Tieleman, D. P., S. J. Marrink, and H. J. C. Berendsen. 1997. A computer perspective of membranes: molecular dynamics studies of lipid bilayer systems. Biochim. Biophys. Acta. 1331:235–270. [DOI] [PubMed] [Google Scholar]
- 39.Lipowsky, R., and S. Grotehans. 1993. Hydration vs. protrusion forces between lipid bilayers. Europhys. Lett. 23:599–604. [Google Scholar]
- 40.Mathai, J. C., G. D. Sprott, and M. L. Zeidel. 2001. Molecular mechanisms of water and solute transport across archaebacterial lipid membranes. J. Biol. Chem. 276:27266–27271. [DOI] [PubMed] [Google Scholar]
- 41.Marrink, S. J., R. M. Sok, and H. J. C. Berendsen. 1996. Free volume properties of a simulated lipid membrane. J. Chem. Phys. 104:9090–9099. [Google Scholar]
- 42.Baba, T., H. Minamikawa, M. Hato, and T. Handa. 2001. Hydration and molecular motions in synthetic phytanyl-chained glycolipid vesicle membranes. Biophys. J. 81:3377–3386. [DOI] [PMC free article] [PubMed] [Google Scholar]
- 43.Jarrell, H. C., K. A. Zukotynski, and G. D. Sprott. 1998. Lateral diffusion of the total polar lipids from Thermoplasma acidophilum in multilamellar liposomes. Biochim. Biophys. Acta. 1369:259–266. [DOI] [PubMed] [Google Scholar]
- 44.Essmann, U., and M. L. Berkowitz. 1999. Dynamical properties of phospholipid bilayers from computer simulation. Biophys. J. 76:2081–2089. [DOI] [PMC free article] [PubMed] [Google Scholar]
- 45.Moore, P. B., C. F. Lopez, and M. L. Klein. 2001. Dynamical properties of a hydrated lipid bilayer from a multinanosecond molecular dynamics simulation. Biophys. J. 81:2484–2494. [DOI] [PMC free article] [PubMed] [Google Scholar]
Associated Data
This section collects any data citations, data availability statements, or supplementary materials included in this article.


