Abstract
Protein microspheres are of particular utility in the field of drug delivery. A novel, completely aqueous, process of microsphere fabrication has been devised based on controlled phase separation of protein from water-soluble polymers such as polyethylene glycols. The fabrication process results in the formation of spherical microparticles with narrow particle size distributions. Cooling of preheated human insulin-poly(ethylene glycol)-water solutions results in the facile formation of insulin particles. To map out the supersaturation conditions conducive to particle nucleation and growth, we determined the temperature- and concentration-dependent boundaries of an equilibrium liquid-solid phase separation. The kinetics of formation of microspheres were followed by dynamic and continuous-angle static light scattering techniques. The presence of PEG at a pH that was close to the protein's isoelectric point resulted in rapid nucleation and growth. The time elapsed from the moment of creation of a supersaturated solution and the detection of a solid phase in the system (the induction period, tind) ranged from tens to several hundreds of seconds. The dependence of tind on supersaturation could be described within the framework of classical nucleation theory, with the time needed for the formation of a critical nucleus (size <10 nm) being much longer than the time of the onset of particle growth. The growth was limited by cluster diffusion kinetics. The interfacial energies of the insulin particles were determined to be 3.2–3.4 and 2.2 mJ/m2 at equilibrium temperatures of 25 and 37°C, respectively. The insulin particles formed as a result of the process were monodisperse and uniformly spherical, in clear distinction to previously reported processes of microcrystalline insulin particle formation.
INTRODUCTION
Insulin, a 5808-Da, 51 amino acid, dual-chain hormone that is secreted and stored in pancreatic β-cells, is therapeutically important for the treatment of diabetes, a chronic disease that requires supplemental insulin delivery in the form of either solution or microcrystalline suspension formulations of insulin (1,2). The crystal morphology influences the pharmacokinetics, governed by the dissolution of the microcrystals and insulin monomer absorption into the bloodstream (3). The pharmacokinetics of microcrystalline insulin suspensions is controlled by the rate of dissociation of insulin from the crystal lattice, dependent on the cohesive energy between insulin molecules, crystal morphology, the dissolution rates of different crystal faces, and the degree of disorder at the crystal-solution interface (4).
Much progress has been made over the years in the understanding of insulin fibrillation, aggregation, and crystal growth mechanisms (5–16). It is commonly recognized (16) that several processes are involved in the insulin fibrillation: nucleation (formation of stable nuclei), growth of the nuclei, and precipitation of the formed particles (flocs). Nucleation of the insulin flocs typically requires temperatures above ambient, whereas further growth of the nuclei into fibrils can occur at ambient or lower temperatures. Although not specifically pertaining to insulin, the fibril and floc formation can be described by a nucleation-dependent elongation mechanism (16,17). Nucleation is viewed as an assembly of several protein monomers to form an organized structure, the nucleus, as a precursor for formation of fibrils and further aggregation. Subsequent addition of monomers to the nucleus elongates it into fibrils (18).
Microcrystalline insulin typically employed in pharmaceutical formulations is prepared by batch crystallization involving dissolution of the chosen insulin species in acidic solution followed by addition of zinc chloride and other salts and subsequent neutralization (8). Insulin microcrystal formation can also be aided by organic solvents such as acetone or phenol (19,2,4,20), which, in turn, can affect the structure of the formed crystals. Because the aqueous solubility of various forms of insulin is dramatically affected by temperature, a polythermal method of formation of microcrystalline insulin particles has evolved, comprising formation of the insulin particles in acidic zinc chloride solutions at ambient temperature, followed by adjustment of the solution to a pH that is close to the isoelectric point of the protein (pH 5.5–5.7) and dissolution of the insulin particles at elevated temperatures (50–60°C) to afford a clear solution (2,4,20). A gradual cooling of such a solution yields well-defined micron-sized insulin crystals whose characteristics are dependent on the species of crystallization aids, the type of insulin used and the process parameters such as the temperature profile, etc. (2,4). Interestingly, the media conditions present during the growth of the insulin crystals also affect the mechanism of their formation, which can occur by either two-dimensional nucleation or screw dislocation mechanisms (2,4), and can be kinetically controlled by either surface diffusion to the growing step edge or bulk volume diffusion to the crystal-solution interface (21).
In this work, we explored a polythermal method of microsphere formation that exploited the striking effects of temperature on insulin solubility in aqueous solutions of poly(ethylene glycol) (PEG). The presence of PEG allowed the elimination of the addition of zinc salts to the protein solution to cause protein precipitation. The facile formation of insulin particles involved formation of supersaturated insulin and PEG aqueous solutions at elevated temperatures (but not exceeding the insulin thermal denaturation temperature) followed by cooling of the solutions that resulted in the insulin particle formation. The colloidal instability of insulin that promoted flocculation is established by the use of PEG and by the choice of a pH that is close to the insulin isoelectric point.
Despite the extensive literature dedicated to the mechanisms of nucleation and crystallization of globular proteins (see, for example, Rosenberger et al. (22)), as well as observations of insulin crystallization in aqueous solutions (23,24), insights into crystal nucleation and growth processes involving human insulin in tertiary insulin-PEG-water systems are lacking, mainly because of the variability of factors involved and the experimental difficulty due to insulin colloidal instability in PEG solutions. This work was aimed at addressing deficiencies in understanding insulin particle formation in the presence of PEG. As described below, we have developed phase diagrams indicating boundaries of the solid-liquid phase separation and supersaturation concentrations, and have elucidated the mechanisms of a novel method for the fabrication of spherical microparticles of insulin that possess unique characteristics and utility for therapeutic drug delivery.
EXPERIMENTAL
Materials
Human insulin USP (zinc content 0.4 wt%; lot No. XDH 1350110, Intergen, Purchase, NY) was dispersed in solutions of 0.7 wt% NaCl and 16.6 wt% PEG (nominal average molecular weight 3350; lot No. RP0741, Spectrum, Gardena, CA) at various final insulin concentrations. The pH was in all cases adjusted to 5.65 by addition of small amounts of glacial acetic acid or 1 M NaOH. After heating to 77°C, clear protein solutions were obtained, which were rapidly filtered through Millipore (Billerica, MA) Millex 0.22-μm syringe filters directly into scattering cells, which were sealed before use and thermostatted at a given temperature.
Methods
Protein solubility study
In the equilibrium insulin solubility study, a tertiary insulin-water-PEG system was chosen such that total PEG concentration was maintained at 16.6 wt%, whereas the aqueous phase consisted of 0.7 wt% NaCl solution, the pH of which was adjusted to 5.65 by addition of minute quantities of glacial acetic acid or 1 M NaOH. The concentration of insulin dissolved in the aqueous phase varied, but the pH was readjusted to 5.65 after the insulin addition. The insulin was allowed to dissolve completely at T1 = 75–77°C for 4–5 min under gentle stirring resulting in an initial concentration Cin. Then the solution temperature was changed to T2 ranging from 15 to 45°C and maintained at T2 overnight (12–16 h). The resulting opaque suspension was then centrifuged at the temperature T2 at 13,000 × g for 3 min and the supernatant was removed and assayed for the equilibrium insulin concentration by bicinchoninic acid (BCA) protein assay. The samples equilibrated at T2 were kept at this temperature during both centrifugation and the protein assay. Insulin standards for the BCA assay were diluted with a 16.6% PEG solution to correct for PEG interference in the assay.
Dynamic light scattering study
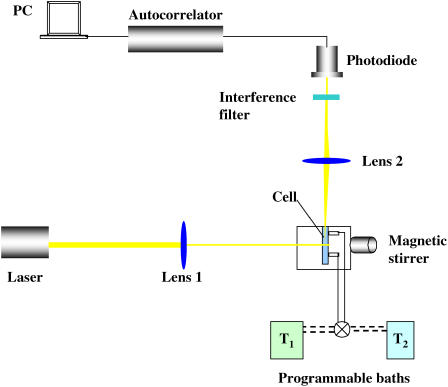
For dynamic light scattering (DLS) kinetic measurements, an experimental setup has been assembled (Fig. 1), comprising a 22-mW He-Ne laser (λ 632.8 nm) (Uniphase 1105P, JDS Uniphase, San Jose, CA) as a light source. The light intensity was regulated with a beam attenuator (Newport M-925B, Newport, Irvine, CA). Two focal length lens systems were used to focus the incident beam on a stirred, thermostatted glass cell (Starna cells, type 37, vol ∼ 200 μL, pathlength, 1 mm) and the scattered beam on a narrow band interference filter (Edmund Industrial Optics, Barrington, NJ; 632.8 nm center, 10 nm bandwidth) to reduce stray light. The light scattered from the solution at 90° was brought to an avalanche photodiode (EG&G Optoelectronics, Gaithersburg, MD), and the photocurrent signal was processed by an ALV-5000/E autocorrelator (ALV GmbH, Langen Germany).
FIGURE 1.
DLS experimental setup.
A rotating magnetic motor housed in the setup drove a small stirring bar (0.6 × 6 mm) in the lower part of the cell, similar to a setup described by Kulkarni and Zukoski (25). A proper, complete filling of the cell with liquid ensured the absence of the air bubbles while the cell was stirred. Control tests without protein in the cell contents ensured the absence of spontaneous scatterers that would be attributable to air bubbles. The temperature in the cell was varied by two constant temperature recirculating baths (Neslab Instruments, Portsmouth, NH), one of which was equilibrated at T1 = 77°C, and another at 25 or 37°C. The cell was filled with the protein plus polymer mixture at 77°C and kept at this temperature until the baths were switched by a valve. The temperature in the cell solution was monitored by a wire thermistor and the data were collected with a PC and processed and transformed using autocorrelation software. In a preliminary series of experiments, we determined the conditions where the rate of stirring (measured in revolutions per minute (rpm)) in the scattering cell affected the induction period and the initial rate of particle growth. The stirring was characterized by the dimensionless Reynolds' number Re = 2rUdo/η, where r is the effective radius of the particle, U [m/s] = πDcell × rpm/60 is the effective velocity of the particles, Dcell = 0.019 m is the internal diameter of the stirred cell, do and η are the liquid density and viscosity, respectively. The speed of the motor rotation was measured using a digital tachometer. At the average r = RH of 100 nm, using viscosity and density values of the16.6% PEG solution of 0.007 kg/m·sand 1026 kg/m3, respectively (26), we estimated that our stirring regime only allows for laminar flows (Re < 10, rpm < 105).
At Re ≥ 0.03, no measurable effect of the stirring speed either on the lag time or the slope of the kinetic curves was observed, and therefore all the experiments described below were conducted at Re = 0.03.
Continuous-angle static light scattering study
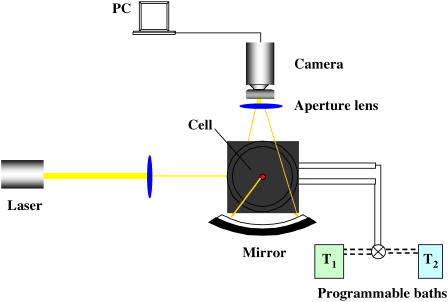
A continuous-angle static light scattering (CASLS) apparatus (Fig. 2) consisted of the HeNe laser described above as a light source, an ellipsoidal mirror, and a 1340 × 100 pixel charge-coupled device camera with a USB 2.0 interface (Spec-10, Roper Scientific, Trenton, NJ). Scattered light leaving the sample cell perpendicular to the cell axis was reflected by the ellipsoidal mirror and then introduced to the charge-coupled device detector. The ellipsoidal mirror reflected the scattered light in an angle range of 10–170°. Scattered light from an angle <10° and from >170° was blocked by a pinhole block and a beam stopper, respectively (27). The scattering cells consisted of polished borosilicate vials (I. D., 10 mm) with stoppers. The cells were thoroughly washed using a 1.5% Tergazyme cleaning solution, rinsed with DI and filtered water, vacuum dried, and capped. The scattering cells were equilibrated at a given temperature (±0.1°C) by immersion in a thermostatted bath of toluene used for scattering calibration. Temperature quenching was accomplished by withdrawing the 77°C toluene in which the cell was immersed, switching the programmable baths (Neslab Instruments) to T2 = 25°C, and rapidly filling the cell immersion bath with toluene preequilibrated at 25°C. The temperature inside the scattering cells was monitored in a control series of experiments, and the time to establish the T2 was found to be <1 min. Therefore, the time count and scattering intensity readings commenced at t = 1.0 min in all subsequent experiments.
FIGURE 2.
CASLS experimental setup.
To calculate the temporal evolution of the radii of gyration of scatterers (Rg) and the fractal dimension of the aggregating clusters (d), we applied a Berry plot relating the Raylegh ratio, R, at the scattering angle, θ, the apparent molecular weight of the scatterers, Mw, the concentration of scatterers, and the scattering function, P(θ), with the optical constant, K (28):
 |
(1) |
where the optical constant, K, is
 |
(2) |
and the scattering vector, q, is defined as 
Because P(θ) = 2(e−x − 1 + x)/x2 and x = q2Rg (29), the Berry equation can be rearranged as:
 |
(3) |
Herein, n, dn/dc, λ, and NA denote refractive index of the solvent, the specific refractive index increment, the wavelength of the laser light, and Avogadro's number, respectively. A BI-DNDC differential refractometer (Brookhaven Instruments, Holtsville, NY) was used in a static mode to measure the specific refractive index increment, dn/dc.
Under the condition of qRg ≫ 1, i.e., in the range of high-q, the fractal dimension, d, was defined from the classic expression:
 |
(4) |
However, in the cases when qRg was close to unity, a more complex expression (30) was applied:
 |
(5) |
where F(qRg) ∝ I(q) is the scale factor of scatterers.
RESULTS AND DISCUSSION
Solubility diagram
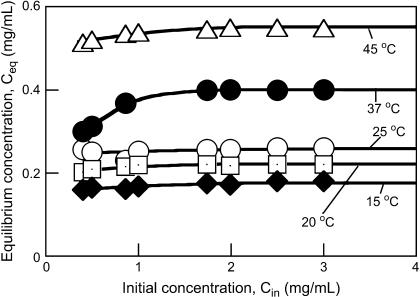
Knowledge of equilibrium protein concentrations as a function of temperature at certain solution conditions is required to decipher the role of an additive such as PEG on the protein nucleation rate and growth kinetics (25). In general, lower supersaturation results in slower protein crystal nucleation and longer induction times (25,31,32). Nucleation rates of proteins are typically enhanced in the presence of polymer (31,32). To establish the equilibrium insulin solubility (C* = Ceq at large Cin) in the presence of PEG at a temperature T2, several Cin values were used, spanning a range of concentrations from 0.4 to 3.5 mg/mL (Fig. 3). The C* was defined as the plateau concentration reached on the Ceq vs. Cin plot at a given temperature. Fig. 3 shows that the insulin solubility increased with temperature, i.e., dC*/dT > 0. Thus, at the same concentration Cin, the supersaturation S = Cin/C* decreases with increasing T. The solid-liquid saturation curve (Fig. 4) was obtained by fitting the experimental data by an exponential equation representing the expansion of the van't Hoff relation around a reference temperature (T2 = 298 K) (25,33):
 |
(6) |
where C* = Csat(T2 = 298 K), k = 1.38 × 10⁻²³ J/K is the Boltzmann constant and ΔH, the enthalpy is derived from fitting the data to Eq. 6.
FIGURE 3.
Dependence of the equilibrium insulin concentration reached at a given temperature T2, on the initial insulin concentration at T1 = 77°C in aqueous 16.6 wt% PEG solutions.
FIGURE 4.
Equilibrium insulin solubility at different temperatures in 16.6 wt% aqueous PEG solutions at pH 5.65. Symbols represent experimental data whereas the solid line is the fit to the van‘t Hoff’s expansion (Eq. 1).
Fitting Eq. 6 to the experimental data yielded an estimate of ΔH ≈ 5 × 10⁻²³ J, on the order of 1–2 kT2. Thus, the derived ΔH/kT2 value for this system is an order of magnitude lower than the value of 20–30 found for the well-studied lysozyme/PEG/water ternary system (25,34), indicating a much higher propensity of the insulin to aggregate in the presence of PEG than does lysozyme. As shown below, very high nucleation rates in such a system were found.
DLS study of nucleation and growth kinetics
Induction period and particle number as functions of supersaturation concentration
The time elapsed from the moment of creation of a supersaturated solution and the detection of a new (solid) phase in the system is called the induction period (tind) as defined in Söhnel and Mullin (35). The induction periods for human Zn insulin nucleation and crystallization kinetics in the absence of PEG have been studied recently by confocal laser scanning microscopy (23,24). At initial insulin concentrations of 1.8–3.5 mg/mL, the tind until the appearance of the first observable crystallites ranged from 1.5 to 8 h. Mühlig et al. (23) concluded that for solute supersaturations of up to 3.5, the growth started from a few active insulin precipitate particles whereas the three-dimensional nucleation was negligible for observation times of up to 24 h.
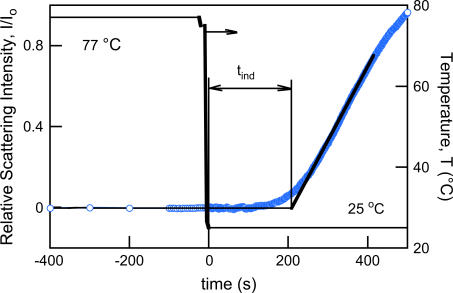
In our case, where supersaturation was created by rapid cooling of a ternary insulin-PEG-water system, the value of tind was dependent on the degree of supersaturation and on the temperature T2. The tind values found were on the order of tens to a few hundreds of seconds (Fig. 5) and were typically much shorter than the lag times described in the literature (15,16,36), which is intuitively understood by the worsening of the solvent due to the presence of large concentrations (16–17 wt%) of the protein-incompatible PEG.
FIGURE 5.
Experimental measurement of the nucleation induction time (tind). The temperature ramp employed by using two temperature recirculation baths is shown by a solid line, whereas the relative scattering intensity at 90° as a function of time is depicted by open circles. Initial insulin concentration, Cin = 0.86 mg/mL; supersaturation, S = Cin/C* = 3.4.
We attempted to rationalize the experimentally observed tind values. It must be noted that the induction period is not a fundamental, inherent property of the system because the detection of the new solid phase depends on the detection method used. However, it has long been recognized that some time must elapse between the creation of the supersaturation condition and the detection of a new phase in a system (35). Because the tind was determined by the onset of a rapid raise of the relative intensity of the scattering light, characteristic of the early appearance of a solid phase, the tind could be represented as the sum of two parameters:
 |
(7) |
where tn is the nucleation time and tg is the growth time, i.e., the time required for the nucleus to grow to a size measurable by our detection method (rH ≥ 1 nm).
The tn and tg in Eq. 7 depend on the kinetic mechanism of the nucleation and particle growth, respectively. The nucleation in our system is created by the rapid cooling of the system, a cooling that can be assumed to be instantaneous (Fig. 5). The steady-state nucleation rate (Js) is reached once a steady-state size distribution of the nuclei is achieved, because the steady-state size distribution of nuclei spans all sizes up to the critical nucleus size (R*).
The critical nucleus size (R*) can be estimated using the same assumptions (25):
 |
(8) |
At the insulin monomer radius r = 1.3 nm (37), the interfacial energy γs = 3.10−3 J/m2 (23), T = 298 K, and S = 3.4, we obtain R* ≈ 1.3 nm from Eq. 8. The critical nucleation radius is thus that of the insulin monomer, which is in line with the notion of the extremely rapid nucleation and rapid dissociation. One must note, however, that when a suspension of particles is suddenly quenched to a temperature below the particle solubility, as in our case, the nuclei must grow to a size larger than R* to be thermodynamically stable (25).
The scattering intensity depends on the concentration and size of scattering units in the insulin suspension. Thus, the data in Fig. 5 contain information about both cluster density and cluster size. As demonstrated by Kulkarni and Zukoski (25), deconvolution of the light scattering signal into the rate of nucleation and the rates of cluster growth requires a detailed model accounting for the time evolution of cluster size distribution for all sizes. Unfortunately, such models are currently unavailable. We followed a number of works on nucleating systems, which assumed that nucleation is slow compared to the rate of growth of clusters once they are larger than R*. The experimentally measured induction period is then proportional to the inverse of the steady-state nucleation rate:
 |
(9) |
where B is a preexponential factor associated with the prefactor in J.
For a fixed value of prefactor B, if the interfacial tension is weakly dependent on temperature and protein concentration, a linear dependence of
 |
(10) |
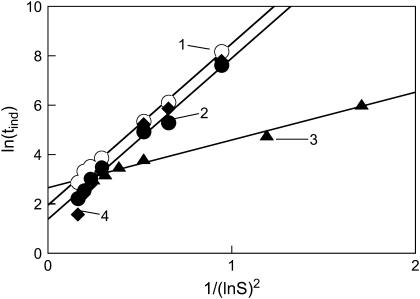
We applied the above expression of the classical nucleation theory to our experimental data. Fig. 6 depicts the tind data points as a function of supersaturation expressed in terms of Eq. 10. As is seen, the data indicate a linear trend as predicted by Eq. 10 quite strongly. The assumption of homogeneous nucleation and formation of spherical particles yields the following expression for the effective interfacial energy (31,32):
 |
(11) |
where B is the slope of the linear fits in Fig. 6.
FIGURE 6.
Induction period (tind) as a function of supersaturation, plotted as ln(tind) versus 1/(ln S)2 (see Eq. 4). Open circles (trendline 1) represent data for the following conditions: NaCl, 0.7%; PEG 3350, 8.3%; pH 5.65; 25°C. Solid circles (trendline 2) show data for NaCl, 0.7%; PEG 3350, 16.6%; pH 5.65; 25°C. Triangles (trendline 3) depict data for NaCl, 0.7%; PEG 3350, 16.6%; pH 5.65; 37°C. Diamonds (trendline 4) show data for NaCl, 1.4%; PEG 3350, 16.6%; pH 5.65; 25°C. Initial temperature, 77°C. Solid lines are linear fits to the data (R2 > 0.986 in all cases).
Using the average molecular weight of 11 kg/mol, density of solid insulin of 1200 kg/m3 (24), and slopes in Fig. 6, we calculated an effective interfacial energy (γs) of the insulin particles from Eq. 11. The determined γs values were equal to 3.2–3.4 mJ/m2 for the insulin systems at equilibrium temperature 25°C and 2.2 mJ/m2 for the systems equilibrated at 37°C. A slightly lower interfacial energy is expected at higher temperature. Importantly, the obtained values correlate well with previously reported values for interfacial energies of proteins in general (25,39,40,31,32) and in particular, excellent correlation was observed with the specific free surface energy of the crystalline state of human insulin, estimated to be ∼3 mJ/m2 (24). Interestingly, a twofold increase in PEG concentration did not change the surface energy of the resulting insulin particles, but significantly lowered the induction time at the same supersaturation levels. Analogous results have been observed by Kulkarni and Zukoski (25,34) for the nucleation of lysozyme in the presence of PEG.
The effective growth rate
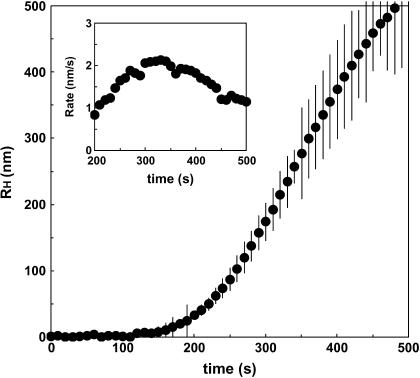
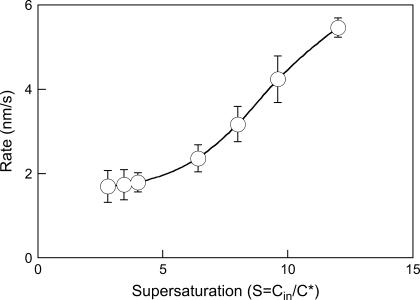
The effective growth rate of the insulin particles was experimentally determined as follows. The relative intensity data were analyzed by nonlinear constrained regularization (NonLin routine) of the autocorrelation function taken every 10 s (appropriate for the timescales observed) using delay times of 2–2000 μs (41). The autocorrelation functions yielded the distributions of the diffusion coefficients of the scatterers and the corresponding hydrodynamic radii. A typical time evolution of the hydrodynamic radii of the insulin particles is depicted in Fig. 7. As is seen, the effective rate of particle growth was 1–2 nm/s in the range 200–400 s. In this time range, an initial steady-state growth was achieved (compare with Fig. 5). The initial growth rate roughly corresponds to the values of the lateral growth rate of human insulin crystals measured at similar supersaturations by in situ microscopic observation (24). As expected, the effective growth rate of the insulin particles steadily increased with supersaturation (22,42) (Fig. 8). Although the mechanisms of the particle growth cannot be unambiguously identified from our experiments, it appears that although the nucleation rates are much higher, the estimated effective particle growth rates are close to the ones observed in crystal growth in solutions of insulin and other proteins (22,42) (Fig. 8). Transport-limited crystal growth rates in solutions of inorganic compounds are typically 2–3 orders of magnitude higher (43). Because we only observed the initial stages of particle growth, such growth rates can be controlled by combined transport-controlled and kinetically controlled mechanisms, each of which can dominate at various stages of particle growth (43).
FIGURE 7.
Time evolution of the hydrodynamic radius of insulin particles. Initial insulin concentration, Cin = 0.86 mg/mL; supersaturation, S = Cin/C* = 3.4. Inset shows the effective particle growth rate computed using the average dRH/dt data.
FIGURE 8.
Effect of supersaturation on the effective particle growth rate averaged over 200–400 s of the kinetics. The concentration of insulin was varied, whereas a PEG concentration of 16.6 wt% and T2 = 25°C was maintained throughout.
SLS study of the nucleation and growth
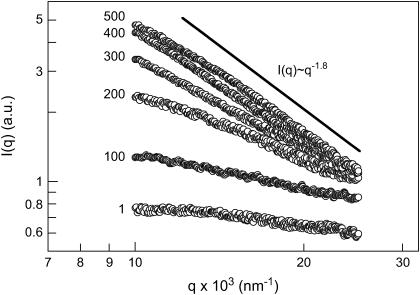
As we have demonstrated above, the liquid-solid phase separation in the supersaturated insulin/PEG ternary systems occurs rapidly under the temperature quench conditions. We were interested to explore the early stages of the insulin aggregation process. Fig. 9 shows the relationship between relative scattering intensity I(q) and the scattering vector, q, when the temperature was quenched from 77 to 25°C.
FIGURE 9.
Typical continuous-angle SLS distributions from a 0.86 mg/mL insulin/16.6% PEG solution after a temperature quench from 77 to 25°C. Numbers stand for time in seconds. Only every 10th data point is shown for clarity. The solid line depicting a slope of −1.8 characteristic of the case of the diffusion-limited cluster-cluster aggregation is shown to guide the eye only.
As is seen, the scattering intensity grew severalfold at the forward angles over time, exhibiting rather monotonic dependencies within the studied range of the scattering angles. These dependencies were devoid of peaks characteristic of spinodal decomposition observed at q < 103 nm−1 in aqueous salt solutions of lysozyme (44). It must be noted, however, that the range of very low scattering angles required for measurements at q < 103 nm−1 was not available with our experimental setup but could be investigated using other methods, such as x-ray or neutron scattering. In the q range studied, the shape of the I(q) vs. q curves resembled that previously observed under the temperature quench conditions with lysozyme (44) as well as with a membrane protein, the bc1 complex, in aqueous PEG solutions (29). When plotted in double logarithmic coordinates, the I(q) vs. q dependencies provided useful scaling information about the structure of the forming aggregates and dominating mechanisms of their formation (45). Initially, the scattering intensity was almost independent of the scattering angle, which denoted that there were only small (1–10 nm) scatterers in the solution. Over time, these small scatterers associated to form large clusters whose structure factor resulted in the appearance of an angular dependence to the scattering intensity. Typically, in our CASLS experiments we were limited by the initial 5–10 min of the particle formation, because of the increment of turbidity, multiple scattering, and sedimentation phenomena at later stages. After ∼10 min, the relative intensity, I(q), had a slowly evolving angular dependence, and the DLS results indicated that the average particle size was gradually increasing. This behavior is typical for the presence of scattering by fractal structures. In the range of large scattering vectors and with the forming particles approaching micron size, where the condition qRg ≫ 1 was satisfied, our data scaled as I(q) ∝ q−1.8 (Fig. 10), indicating the case of a diffusion-limited cluster-cluster aggregation (46,47).
FIGURE 10.
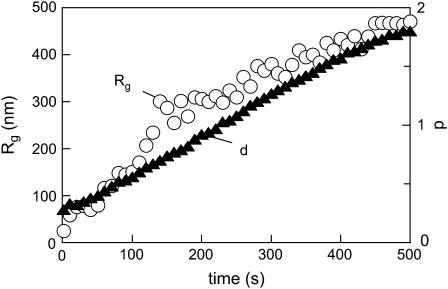
Temporal evolution of the radius of gyration of scatterers (Rg) and the fractal dimension of insulin aggregates after a temperature quench. Conditions as in Fig. 9.
The temporal evolution of the hydrodynamic radii (RH) and the fractal dimension are presented in Fig. 10. Particles of critical size Rg ≈ 170 nm, which were reported by Sluzky et al. (13) to be a nucleating species in the process of human insulin aggregation, formed after ∼110 s, after which the increase of the Rg values accelerated. There was a fair correspondence of the Rg values to the radii found in our earlier DLS experiments. However, no significant lag time in the increase of the Rg values was found in the CASLS setup, unlike in the DLS experiments, which can be explained by the differences in the kinetics of the temperature quench. That is, whereas in the DLS setup the equilibration of the cell at the T2 was almost instantaneous (1–2 s), in the CASLS the time to establish the T2 was up to 1 min because of the significant volume of the scattering cell. The heat transfer parameters obviously affect the induction period. The fractal dimension with scaling d = 1.8 evolving after ∼5 min indicated a diffusion-limited cluster-cluster aggregation (48–51). Two types of cluster-cluster aggregation have been studied intensively: first, reaction limited cluster aggregation, and second, diffusion limited cluster aggregation (52). Fractal dimensions predicted by these models are 2.11 for reaction limited cluster aggregation and 1.75 for diffusion limited cluster aggregation, respectively.
The obtained fractal dimension suggests that the insulin particles have a fractal network structure. This structure is consistent with the mechanism of the particle formation, where growing insulin fibrils encounter other fibrils and link together to form junctions. Insulin monomers, dimers, and, to a lesser degree (15,16), hexamers initiate formation of amyloidogenic nuclei (53) and subsequent formation of fibrils and of chains that can branch at random locations. Such a growth mechanism will produce self-similar, microcrystalline patterns in insulin fibrils that have been reported (54). Notably, aggregation of insulin in acidic, denaturing media in the absence of PEG has been reported to result in rather well-organized three-dimensional fibrillar structures (15,16,55,56). It can be hypothesized that the presence of the large concentrations of PEG altered the mechanism of the insulin aggregation, perhaps by introducing depletion interactions. In addition, we conducted our studies at pH's close to the isoelectric point of insulin, where electrostatic repulsion is suppressed whereas long-lived associations dominate. Formation of fractal structures upon temperature-induced protein aggregation, especially in the presence of polymeric aggregation aids, is well established (57,58).
To assess the size and shape of the particles formed at the final stages of aggregation, the contents of the scattering cell equilibrated at T2 = 25°C in the above CASLS experiment for 0.5 h were agitated by brief vortexing and diluted 100-fold into another scattering cell filled with 16.6% PEG solution preequilibrated at 25°C. The contents of the scattering cell were briefly (2–3 s) sonicated to ensure the absence of air bubbles, and the CASLS measurement was conducted every 2 s for the next 10 s. No significant differences in the intensity distributions were observed, which indicated the absence of particle sedimentation within this period of time. The average I(q) vs. q plot that resulted (Fig. 11) shows a dramatic increase of the scaling exponent d (compare with Fig. 10), which was estimated to be 4.0. This scaling exponent (so-called Porod exponent) is typical for particles with mass and surface dimensionalities (dm and ds, respectively), for which the following scaling dependence holds (under the condition qRg ≫ 1) (44):
 |
(12) |
FIGURE 11.
Continuous-angle SLS distributions from a suspension of insulin particles evolved in the CASLS experiment (Fig. 2), followed by dilution, after 0.5 h. See text for details of the measurement. Data are averaged, and only every 100th data point is shown for clarity. Solid line illustrating a slope of −4.0, characteristic of the globular particles (microspheres), is shown to guide the eye only.
It appears that the insulin particles formed under these conditions evolved into globular structures (microspheres) (df = 3.0) with sharp boundaries (ds = 2.0) (59).
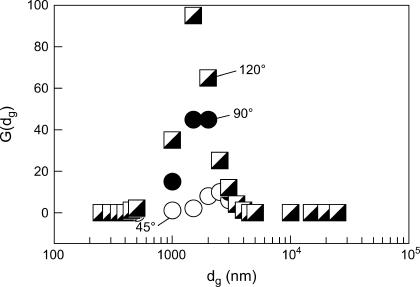
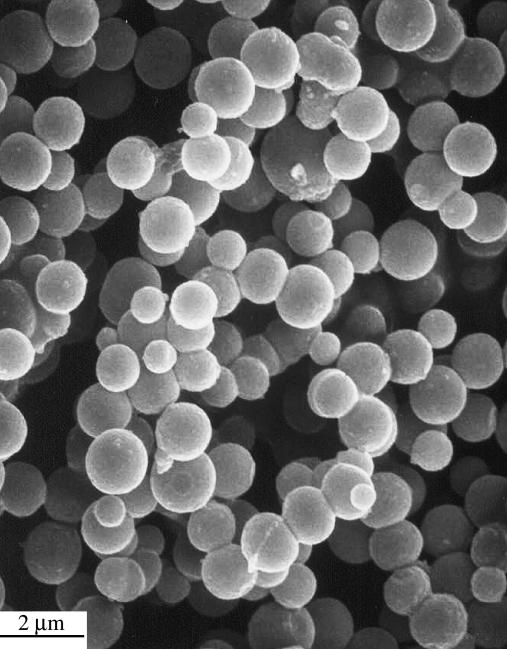
The relative size distribution of the microspheres in the same dispersion was estimated from the DLS-mode measurements (Fig. 2), where the size distribution function was calculated using the method of nonnegatively constrained least squares (Fig. 12). The microspheres obtained as in Fig. 11 were separated by filtration and were repeatedly washed by deionized water to eliminate the interference of PEG in the G(dg) measurement. The well-defined peak due to the insulin particles indicated that the size distribution was relatively narrow. Notably, similar distributions were observed at several scattering angles, which strengthens the validity of the interpretation. These results were further visualized by using scanning electron microscopy of the insulin particles obtained by the above heating-cooling process in the presence of 16.6% PEG followed by washing as above to remove PEG (Fig. 13). The scanning electron microscopy showed uniformly spherical particles of 1–2-μm size, in excellent agreement with the light scattering results (Fig. 12). It appears, therefore, that we have found thermodynamic conditions favoring the formation of unique spherical insulin particles. Considering the Helmholtz free energy for microcrystallites, Abraham (60) showed a decrease of the free energy with the increase of the cluster size for spherical clusters and noted that the spherical shape was one of the minimal free energy configurations.
FIGURE 12.
Distribution of the effective hydrodynamic diameter (dg) of insulin microspheres obtained at three scattering angles.
FIGURE 13.
Scanning electron microscopy microphotograph of insulin particles obtained by cooling of a supersaturated insulin/PEG aqueous solution at pH 5.65, PEG concentration of 16.6 wt%, and a supersaturation of 3.4.
CONCLUDING REMARKS
Formation of particles of human insulin in insulin-PEG-water ternary systems upon rapid cooling has been studied by light scattering techniques, with the emphasis on the kinetics of the nucleation and growth processes. Conventional methods of microcrystalline insulin particle preparation were modified by the presence of PEG and by fabrication at pH's close to the protein's isoelectric point to facilitate both nucleation and growth. A steady-state nucleation rate was achieved within milliseconds, but the particle growth was preceded by an induction period. The dependence of the induction period on supersaturation could be described within the framework of classical nucleation theory. Of significant importance to pharmaceutical applications, the insulin particles formed by this process are relatively monodisperse and uniformly spherical.
Models that describe the kinetics of formation of uniformly sized, spherical colloids of inorganic compounds are fairly well known (61–65). Such models imply formation of nuclei that are rapidly produced in supersaturated solutions and then grow to nanosize primary particles, which then irreversibly coagulate to form much larger colloids. The formation of the primary particles is governed by the surface tension, which is minimal for spherical nuclei. The growth of the secondary particles is facilitated by the reduction of the surface potential at pH's near the isoelectric point, resulting in reduction of electrostatic barriers, thus promoting rapid irreversible particle aggregation. Formation of the secondary particles, which can be of a narrow size distribution, is assumed to be a diffusion-controlled process (65). This description seems to be in overall accord with our observations. Numerical simulations indicate (66) that the protein nucleation can be a two-step process. First, a nucleus forms and grows as a disordered, liquid-like aggregate until it reaches a critical size (several hundred units), and whereupon crystal nucleation becomes possible. The liquid-like state differentiates the protein “primary particle” from its crystalline inorganic counterparts (65), but kinetic mechanisms of the growth into larger, “secondary” crystalline particles perhaps are not much dissimilar. Notably, the previously identified insulin forms that result from insulin crystallization in acidic aqueous/acetone solutions in the presence of zinc salts grow by the generation and spreading of crystal layers, with linear kinetics (67). A novel process for the formation of pharmaceutically valuable insulin microspheres via a previously unknown mechanism of insulin particle formation has been devised. Microspheres with a mean aerodynamic diameter of 1–3 μm with a narrow particle size distribution are particularly valuable for particles to be delivered by the pulmonary route, because it results in ideal aerodynamic performance, delivery of therapeutics to the deep lung, and the potential for achievement of very high systemic bioavailability.
Acknowledgments
We thank Larry Brown and Jack McGeehan for helpful discussions.
The process of microsphere fabrication, termed PROMAXX, is a registered trademark of Baxter International, its subsidiaries, or affiliates. Epic Therapeutics is a wholly owned subsidiary of Baxter Healthcare Corporation.
References
- 1.Haycock, P. 1983. History of insulin therapy. In Intensive Insulin Therapy. D. S. Schade, J. V. Santiago, J. S. Skyler, and R. A. Rizza, editors. Excerpta Medica, Amsterdam, The Netherlands. 1–19.
- 2.Yip, C. M., M. L. Brader, M. R. DeFelippis, and M. D. Ward. 1998. Atomic force microscopy of crystalline insulins: the influence of sequence variation on crystallization and interfacial structure. Biophys. J. 74:2199–2209. [DOI] [PMC free article] [PubMed] [Google Scholar]
- 3.Graham, D. T., and A. R. Pomeroy. 1984. An in-vitro test for the duration of action of insulin suspensions. J. Pharm. Pharmacol. 36:427–430. [DOI] [PubMed] [Google Scholar]
- 4.Yip, C. M., M. R. DeFelippis, B. H. Frank, M. L. Brader, and M. D. Ward. 1998. Structural and morphological characterization of ultralente insulin crystals by atomic force microscopy: evidence of hydrophobically driven assembly. Biophys. J. 75:1172–1179. [DOI] [PMC free article] [PubMed] [Google Scholar]
- 5.Hallas-Møller, K., K. Petersen, and J. Schlichtkrull. 1952. Crystalline and amorphous insulin-zinc compounds with prolonged action. Science. 116:394–398. [DOI] [PubMed] [Google Scholar]
- 6.Waugh, D. F. 1946. A fibrous modification of insulin. I. The heat precipitate of insulin. J. Am. Chem. Soc. 68:247–250. [Google Scholar]
- 7.Waugh, D. F., D. F. Wilhelmson, S. L. Commerford, and M. L. Sackler. 1953. Studies of the nucleation and growth reactions of selected types of insulin fibrils. J. Am. Chem. Soc. 75:2592–2600. [Google Scholar]
- 8.Schlichtkrull, J. 1956. Insulin crystal II. Shape of rhombohedral zinc-insulin crystals in relation to species and crystallization media. Acta Chem. Scand. 10:1459–1464. [Google Scholar]
- 9.Schlichtkrull, J. 1957. Insulin crystals. IV. The nucleation and growth of insulin crystals. Acta Chem. Scand. 11:439–460. [Google Scholar]
- 10.Schlichtkrull, J. 1965. Insulin rapitard and insulin actrapid. Acta Med. Scand. 177:103–113. [DOI] [PubMed] [Google Scholar]
- 11.Brange, J., B. Skelbaek-Pedersen, L. Langkjaer, U. Damgaard, H. Ege, S. Havelund, L. G. Heding, K. H. Jorgensen, J. Lykkeberg, J. Markussen, M. Pingel, and E. Rasmussen. 1987. Galenics of Insulin: The Physicochemical and Pharmaceutical Aspects of Insulin and Insulin Preparations. Springer-Verlag, Berlin, Germany.
- 12.Brange, J., L. Andersen, E. D. Laursen, G. Meyn, and E. Rasmussen. 1997. Toward understanding insulin fibrillation. J. Pharm. Sci. 86:517–525. [DOI] [PubMed] [Google Scholar]
- 13.Sluzky, V., J. A. Tamada, A. M. Klibanov, and R. Langer. 1991. Kinetics of insulin aggregation in aqueous solutions upon agitation in the presence of hydrophobic surfaces. Proc. Natl. Acad. Sci. USA. 88:9377–9381. [DOI] [PMC free article] [PubMed] [Google Scholar]
- 14.Sluzky, V., A. M. Klibanov, and R. Langer. 1992. Mechanism of insulin aggregation and stabilization in agitated aqueous solutions. Biotechnol. Bioeng. 40:895–903. [DOI] [PubMed] [Google Scholar]
- 15.Nielsen, L., S. Frokjaer, J. F. Carpenter, and J. Brange. 2001. Studies of the structure of insulin fibrils by Fourier transform infrared (FTIR) spectroscopy and electron microscopy. J. Pharm. Sci. 90:29–37. [DOI] [PubMed] [Google Scholar]
- 16.Nielsen, L., R. Khurana, A. Coats, S. Frokjaer, J. Brange, S. Vyas, V. N. Uversky, and A. L. Fink. 2001. Effect of environmental factors on the kinetics of insulin fibril formation: elucidation of the molecular mechanism. Biochemistry. 40:6036–6046. [DOI] [PubMed] [Google Scholar]
- 17.Lomakin, A., D. S. Chung, G. B. Benedek, D. A. Kirschner, and D. B. Teplow. 1996. On the nucleation and growth of amyloid beta-protein fibrils: detection of nuclei and quantitation of rate constants. Proc. Natl. Acad. Sci. USA. 93:1125–1129. [DOI] [PMC free article] [PubMed] [Google Scholar]
- 18.Teplow, D. B. 1998. Structural and kinetic features of amyloid beta-protein fibrillogenesis. Amyloid. 5:121–142. [DOI] [PubMed] [Google Scholar]
- 19.Bergeron, L., L. F. Filobelo, O. Galkin, and P. G. Vekilov. 2003. Thermodynamics of the hydrophobicity in crystallization of insulin. Biophys. J. 85:3935–3942. [DOI] [PMC free article] [PubMed] [Google Scholar]
- 20.Ciszak, E., J. M. Beals, B. H. Frank, J. C. Baker, N. D. Carter, and G. D. Smith. 1995. Role of C-terminal B-chain residues in insulin assembly: the structure of hexameric LysB28ProB29-human insulin. Structure. 3:615–622. [DOI] [PubMed] [Google Scholar]
- 21.Yip, C. M., and M. D. Ward. 1996. Atomic force microscopy of insulin single crystals: direct visualization of molecules and crystal growth. Biophys. J. 71:1071–1078. [DOI] [PMC free article] [PubMed] [Google Scholar]
- 22.Rosenberger, F., P. G. Vekilov, M. Muschol, and B. R. Thomas. 1996. Nucleation and crystallization of globular proteins: what do we know and what is missing? J. Cryst. Growth. 168:1–27. [Google Scholar]
- 23.Műhlig, P., Th. Klupsch, U. Schell, and R. Hilgenfeld, 2001. Observation of the early stage of insulin crystallization by confocal laser scanning microscopy. J. Cryst. Growth. 232: 93–101. [Google Scholar]
- 24.Műhlig, P., Th. Klupsch, U. Kaulman, and R. Hilgenfeld. 2003. Noninvasive in situ observation of the crystallization kinetics of biological macromolecules by confocal laser scanning microscopy. J. Struct. Biol. 142:47–55. [DOI] [PubMed] [Google Scholar]
- 25.Kulkarni, A. M., and C. F. Zukoski. 2002. Nanoparticle crystal nucleation: influence of solution conditions. Langmuir. 18:3090–3099. [Google Scholar]
- 26.González-Tello, P., F. Camacho, and G. Blázquez. 1994. Density and viscosity of concentrated aqueous solutions of polyethylene glycol. J. Chem. Eng. Data. 39:611–614. [Google Scholar]
- 27.Tsutsuia, K., K. Koya, and T. Kato. 1998. An investigation of continuous-angle laser light scattering. Rev. Sci. Instrum. 69:3482–3486. [Google Scholar]
- 28.Berry, G. C. 1966. Thermodynamic and conformational properties of polystyrene. I. Light-scattering studies on dilute solutions of linear polystyrenes. J. Phys. Chem. 44:4550–4556. [Google Scholar]
- 29.Onuma, K., N. Kanzaki, and T. Kubota. 2003. Assembly kinetics of bc1 complex membrane protein investigated by using a continuous-angle laser light scattering technique. J. Phys. Chem. B. 107:11224–11229. [Google Scholar]
- 30.Bassi, F. A., G. Arcovito, M. De Spirito, A. Mordente, and G. E. Martorana. 1995. Self-similarity properties of alpha-crystallin supramolecular aggregates. Biophys. J. 69:2720–2727. [DOI] [PMC free article] [PubMed] [Google Scholar]
- 31.Galkin, O., and P. G. Vekilov. 2000. Control of protein crystal nucleation around the metastable liquid-liquid phase boundary. Proc. Natl. Acad. Sci. USA. 97:6277–6281. [DOI] [PMC free article] [PubMed] [Google Scholar]
- 32.Galkin, O., and P. G. Vekilov. 2000. Are nucleation kinetics of protein crystals similar to those of liquid droplets? J. Am. Chem. Soc. 122:156–163. [Google Scholar]
- 33.Muschol, M., and F. Rosenberger. 1997. Liquid-liquid phase separation in supersaturated lysozyme solutions and associated precipitate formation/crystallization. J. Chem. Phys. 107:1953–1962. [Google Scholar]
- 34.Kulkarni, A. M., A. P. Chatterjee, K. S. Schweizer, and C. F. Zukoski. 2000. Effects of polyethylene glycol on protein interactions. J. Chem. Phys. 113:9863–9873. [Google Scholar]
- 35.Söhnel, O., and J. W. Mullin. 1988. Interpretation of crystallization induction periods. J. Colloid Interface Sci. 123:43–50. [Google Scholar]
- 36.Knezic, D., J. Zaccaro, and A. S. Myerson. 2004. Nucleation induction time in levitated droplets. J. Phys. Chem. B. 108:10672–10677. [Google Scholar]
- 37.Oliva, A., J. Farina, and M. J. Llabres. 2000. Development of two high-performance liquid chromatographic methods for the analysis and characterization of insulin and its degradation products in pharmaceutical preparations. J. Chromatogr. B. Biomed. Sci. Appl. 749:25–34. [DOI] [PubMed] [Google Scholar]
- 38.Nielsen, A. E. 1964. Kinetics of Precipitation. Pergamon Press, New York, NY.
- 39.Durbin, S. D., and G. Feher. 1990. Studies of crystal growth mechanisms of proteins by electron microscopy. J. Mol. Biol. 212:763–774. [DOI] [PubMed] [Google Scholar]
- 40.Vekilov, P. G., L. A. Monaco, B. R. Thomas, V. Strojanoff, and F. Rosenberger. 1996. Repartitioning of NaCl and protein impurities in lysozyme crystallization. Acta Crystallogr. D52:785–798. [DOI] [PubMed] [Google Scholar]
- 41.Peters, P. 1993. Noise on photon correlation functions and its effect on data reduction algorithms. In Dynamic Light Scattering: The Methods and Some Applications. W. Brown, editor. Clarendon Press, Oxford, UK. 149–176.
- 42.Darcy, P. A., and J. M. Wiencek. 1998. Estimating lysozyme crystallization growth rates and solubility from isothermal microcalorimetry. Acta Crystallogr. D54:1387–1394. [DOI] [PubMed] [Google Scholar]
- 43.Söhnel, O., and J. Garside. 1992. Precipitation: Basic Principles and Industrial Applications. Butterworth-Heinemann, Oxford, UK.
- 44.Georgalis, Y., P. Umbach, D. M. Soumpasis, and W. Saenger. 1998. Dynamics and microstructure formation during nucleation of lysozyme solutions. J. Am. Chem. Soc. 120:5539–5548. [Google Scholar]
- 45.Schaefer, D. W., B. C. Bunker, and J. P. Wilcoxon. 1989. Fractals and phase separation. Proc. R. Soc. London Ser. A. 423:35–53. [Google Scholar]
- 46.Lin, M. Y., H. M. Lindsay, D. A. Weitz, R. C. Ball, R. Klein, and P. Meakin. 1989. Universality of fractal aggregates as probed by light scattering. Proc. R. Soc. London Ser. A. 423:71–87. [Google Scholar]
- 47.Rothschild, G. W. 1998. Fractals in Chemistry. John Wiley & Sons, New York, NY.
- 48.Meakin, P. 1988. The growth of fractal aggregates and their fractal measures. Phase Transitions Crit. Phenom. 12:335–489. [Google Scholar]
- 49.Martin, J. E., and A. J. Hurd. 1987. Scattering from fractals. J. Appl. Crystallogr. 20:61–78. [Google Scholar]
- 50.Jullien, R., R. Botet, and P. M. Mors. 1987. Computer simulations of cluster-cluster aggregation. Faraday Discuss. Chem. Soc. 83:125–137. [Google Scholar]
- 51.Witten, T. A., and L. M. Sander. 1981. Diffusion-limited aggregation, a kinetic critical phenomenon. Phys. Rev. Lett. 47:1400–1403. [Google Scholar]
- 52.Vicsek, T. 1989. Fractal Growth Phenomena. World Scientific, London, UK.
- 53.Dong, J., Z. Wan, M. Popov, P. R. Carey, and M. A. Weiss. 2003. Insulin assembly damps conformational fluctuations: Raman analysis of amide I linewidths in native states and fibrils. J. Mol. Biol. 330:431–442. [DOI] [PubMed] [Google Scholar]
- 54.Koltun, W. L., D. F. Waugh, and R. S. Bear. 1954. An x-ray diffraction investigation of selected types of insulin fibrils. J. Am. Chem. Soc. 76:413–417. [Google Scholar]
- 55.Nilsson, M. R., and C. M. Dobson. 2003. Chemical modification of insulin in amyloid fibrils. Protein Sci. 12:2637–2641. [DOI] [PMC free article] [PubMed] [Google Scholar]
- 56.Jimenez, J. L., E. J. Nettleton, M. Bouchard, C. V. Robinson, C. M. Dobson, and H. R. Saibil. 2002. The protofilament structure of insulin amyloid fibrils. Proc. Natl. Acad. Sci. USA. 99:9196–9201. [DOI] [PMC free article] [PubMed] [Google Scholar]
- 57.Feder, J., T. Jossang, and E. Rosenquist. 1984. Scaling behavior and cluster fractal dimension determined by light scattering from aggregating proteins. Phys. Rev. Lett. 53:1403–1406. [Google Scholar]
- 58.Croguennoc, P., T. Nicolai, D. Durand, and A. Clark. 2001. Phase separation and association of globular protein aggregates in the presence of polysaccharides. 2. Heated mixtures of native b-lactoglobulin and k-carrageenan. Langmuir. 17:4380–4385. [Google Scholar]
- 59.Mallamace, F., N. Micali, S. Trusso, and S. H. Chem. 1995. Spinodal decomposition of a three-component water-in-oil microemulsion system. Phys. Rev. E. 51:5818–5823. [DOI] [PubMed] [Google Scholar]
- 60.Abraham, F. F. 1974. Homogeneous Nucleation Theory. Academic Press, New York, NY.
- 61.LaMer, V. K., and R. H. Dinegar. 1950. Theory, production, and mechanism of formation of monodispersed hydrosols. J. Am. Chem. Soc. 72:4847–4854. [Google Scholar]
- 62.LaMer, V. K. 1952. Kinetics in phase transitions. Ind. Eng. Chem. 44:1270–1277. [Google Scholar]
- 63.Reiss, H. 1951. The growth of uniform colloidal dispersions. J. Chem. Phys. 19:482–487. [Google Scholar]
- 64.Privman, V., D. V. Goia, J. Park, and E. Matijević. 1999. Mechanism of formation of monodispersed colloids by aggregation of nanosize precursors. J. Colloid Interface Sci. 213:36–45. [DOI] [PubMed] [Google Scholar]
- 65.Park, J., V. Privman, and E. Matijević. 2001. Model of formation of monodispersed colloids. J. Phys. Chem. B. 105:11630–11635. [Google Scholar]
- 66.Lomakin, A., N. Asherie, and G. B. Benedek. 2003. Liquid-solid transition in nuclei of protein crystals. Proc. Natl. Acad. Sci. USA. 100:10254–10257. [DOI] [PMC free article] [PubMed] [Google Scholar]
- 67.Reviakine, I., D. K. Georgiou, and P. G. Vekilov. 2003. Capillarity effects on crystallization kinetics: insulin. J. Am. Chem. Soc. 125:11684–11693. [DOI] [PubMed] [Google Scholar]


