Abstract
The minus-strand transfer step of HIV-1 reverse transcription is chaperoned by the nucleocapsid protein (NC), which has been shown to facilitate the annealing between the transactivation response element (TAR) RNA and complementary TAR DNA stem-loop structures. In this work, potential intermediates in the mechanism of NC-chaperoned TAR DNA/TAR RNA annealing have been examined using single-molecule fluorescence resonance energy transfer. The interaction between TAR DNA and various DNA oligonucleotides designed to mimic the initial annealing step was monitored to capture potential intermediates along the reaction pathway. Two possible mechanisms of annealing were examined, namely nucleation through the 3′/5′ termini, termed the “zipper” complex, or nucleation through the hairpin loops in a “kissing” complex. Intermediates associated with both mechanisms were observed in the presence of NC, and the kinetics of formation of these intermediates were also measured. Thus, the single-molecule experiments support the notion that NC-assisted annealing of TAR DNA:TAR RNA may occur through multiple pathways.
INTRODUCTION
The HIV-1 nucleocapsid protein (NC) is composed of 55 amino acids, with two zinc-binding domains of the CCHC type (1–4). NC exhibits both nonspecific and specific nucleic acid binding properties (5,6). It is thought that the zinc finger domain is responsible for sequence-specific base interactions (7) with a preference for TG-rich regions (8–10), whereas the N-terminal domain of NC interacts nonspecifically by electrostatic interactions (11,12).
NC plays multiple roles in the HIV-1 life cycle (5). In its role as a structural protein, NC stabilizes the virion by enhancing protein-protein interactions (13) and promoting the dimerization of viral RNA (14–18). NC also serves as a chaperone, by promoting several annealing reactions in the reverse transcription process. For example, NC has been shown to facilitate the annealing of the tRNA primer onto the primer binding site (19–21), annealing of complementary sequences in plus-strand transfer (22–25), and annealing of complementary repeat regions in minus-strand transfer (23,26–32).
The minus-strand transfer step in HIV-1 reverse transcription involves annealing of the newly synthesized minus-strand strong stop DNA to the complementary RNA located at the 3′ end of the viral genome, so that reverse transcription can continue. This process, although thermodynamically favorable, does not occur with significant yield without the presence of NC (7,26). Both the RNA and DNA sequences can fold into stable hairpins known as transactivation response element (TAR) RNA and TAR DNA, respectively (33–36). NC's importance in promoting minus-strand transfer has been well documented (5). However, the detailed mechanism of the annealing step in minus-strand transfer is not completely understood.
Several attempts have been made to provide more molecular-level details about NC's effects on oligonucleotide structure. Kinetic experiments suggest that NC's slight preference for binding to single-stranded DNA could provide insight into the strand transfer process (37). Ensemble fluorescence resonance energy transfer (FRET) experiments conducted on TAR DNA have been used to show that NC destabilizes the double-helical structure (31,38,39). Further experiments detail a mechanism in which NC chaperones annealing by increasing conformational flexibility in the precursors, energetically opening pathways, and thereby increasing the probability of encountering the most desired product (31,38–40).
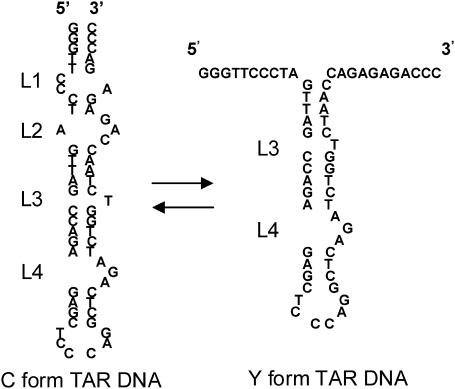
In 2004, single-molecule FRET (SMFRET) was used to characterize the TAR DNA secondary structure in the presence of NC. It was determined that NC destabilizes the secondary structure in the 3′/5′ terminal loop regions of the initially closed TAR DNA, termed the C form (41). This process is illustrated in Scheme 1, in which the four bulge/loop regions are indicated as L1–L4. The resultant system in the presence of NC is an equilibrium between C and the partially open TAR DNA/NC complex, termed the Y structure.
SCHEME 1.
Previously, SMFRET was used to demonstrate that, in the presence of NC, the TAR DNA hairpin is “open” through the terminal two-loop regions (the four loops are indicated above by L1–L4) (41). The partially open form that exists in the presence of NC is termed the Y Form.
Recently, an in-depth SMFRET study of the C/Y equilibration dynamics was undertaken, revealing a strong dependence of the FRET dynamics on both the NC and Mg concentrations (42) leading to several new insights on the C/Y interconversion mechanism. These single-molecule results indicate that NC induces a highly dynamic Y structure, as compared to the relatively conformationally static C form. The C/Y dynamics were also observed to be significantly heterogeneous, indicating that the C/Y interconversion is not a simple two-state equilibration but rather must involve multiple conformational intermediates and/or multiple reaction pathways (42). The heterogeneity and the strong dependence of the dynamics on NC concentration is not unexpected because as many as eight NC molecules can be simultaneously bound to TAR DNA(5). In this article, a single NC concentration of 445 nM is used for the various annealing studies to simplify the analysis and to mimic the relatively high NC concentration range believed to be relevant to the biological situation. In summary, single-molecule FRET data strongly suggest that the Y structure corresponds to a range of secondary structures in the L1–L2 region and a range of numbers of bound NC molecules.
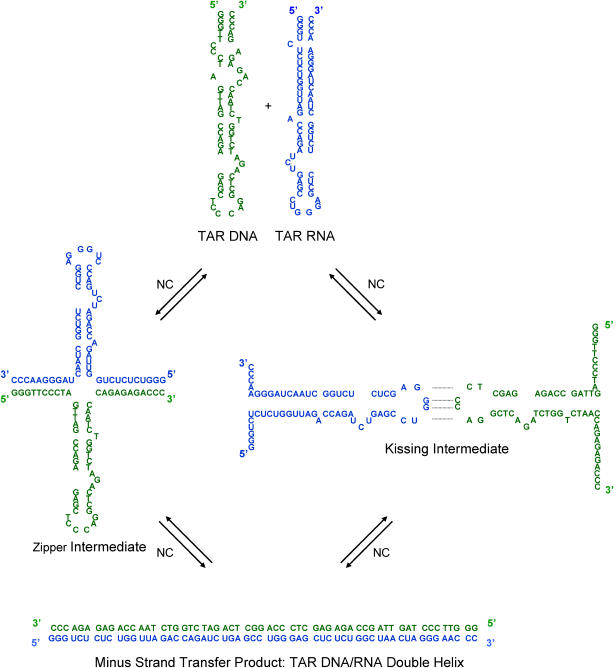
We have suggested that the Y structure might serve as a nucleation center for minus-strand transfer (41). In such a “zipper” mechanism, nucleation occurs through either the 3′ or 5′ terminus in the NC-induced single-stranded form. In this model, the formation of such an intermediate increases the efficiency of forming a correctly annealed end-product, and meanwhile decreases the probability of misfolded side products. The zipper mechanism is illustrated in Scheme 2 (left), where for brevity, nucleation through both termini is shown.
SCHEME 2.
The two intermediates in the NC-chaperoned annealing of TAR DNA and TAR RNA that are examined in this study are illustrated. (Left) A zipper mechanism can occur if annealing initiates through the 3′ or 5′ terminus (or both simultaneously, as shown in the case of a Y:Y complex). (Right) A kissing mechanism occurs if annealing is initiated through interaction between the bottom loop regions.
The second mechanism that has been proposed is the kissing mechanism (43), in which nucleation occurs through the complementary single-stranded loop sequences. NC-induced kissing complexes have been found to be important in stabilizing RNA dimerization in the viral envelope (18,44–47). For minus-strand transfer this model involves the formation of interstrand basepairs via loop-loop kissing, followed by formation of the extended DNA:RNA duplex. This mechanism also provides a specific nucleation site and decreases the likelihood of unfavorable side products. The formation of kissing complexes has been verified by NMR structural examinations of RNA/RNA interactions (48–50). The kissing mechanism is illustrated on the right in Scheme 2.
The current work represents an effort to apply SMFRET to characterize the two pathways that have been proposed for minus-strand transfer in HIV-1 reverse transcription. SMFRET was used to monitor the NC-chaperoned interaction between TAR DNA and various DNA oligonucleotides that are analogs to the complementary RNA. Each DNA sequence was chosen for its specific complementarity to regions of TAR DNA characteristic of each of the types of pathways under consideration. Donor/acceptor labeled TAR DNA was used to monitor the effects of the interactions on the hairpin structure. Alternately, the acceptor dye was placed on the oligomers, which yields information about the annealing between the two species. The annealing kinetics of each reaction pathway were also compared.
MATERIALS AND METHODS
Coverslip and chamber preparation
Coverslips were cleaned in piranha solutions (25% H2O2 and 75% concentrated H2SO4) for 1 h, followed by various water (molecular biology grade), and acetone (high-performance liquid chromatography (HPLC) grade) rinsing cycles. Dry, clean coverslips were then treated with vectabond/acetone 1% w/v solutions (Vector Laboratories, Burlingame, CA) for 5 min. Cover slips were then rinsed with H2O and dried under a N2 stream.
The clean coverslips were masked with patterned silicone films. The unprotected area was incubated with a 25% w/w polyethylene glycol (PEG) solution (MW 2000, Nektar Therapeutics, Huntsville, AL) containing 0.25% w/w biotinylated PEG (MW 5000, Nektar Therapeutics, Huntsville, AL) in a 0.1-M sodium bicarbonate solution (HyClone, Logan, UT) for 3 h. The silicone templates were removed, the excess PEG rinsed with water, and the coverslips dried under a N2 stream. Predrilled polycarbonate films with an adhesive gasket (Grace Bio-Labs, Bend, OR) were assembled on top of cleaned coverslips yielding a chamber with a total volume of ∼5 μL. The chamber was assembled on top of the PEG-treated surface; the adhesive gasket adhering to the silicone template protected regions of the PEG-treated coverslips. Inlet and outlet ports (Nanoport, Upchurch Scientific, Oak Harbor, WA) were glued on top of the chambers.
DNA and protein preparation
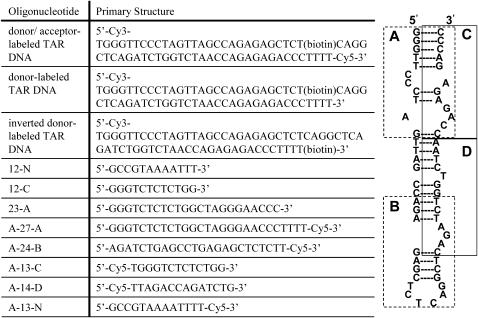
All oligonucleotides were purchased in lyophilized form from TriLink Biotechnologies (San Diego, CA). The primary structure of each sequence used in this study is detailed in Scheme 3, along with the complementarity between the TAR DNA and each oligonucleotide. Dye-labeled species were ordered with additional 5′T and/or 3′ TTTT overhangs at the termini relative to the native form to prevent unwanted photophysics caused by G residue quenching (31,51,52).
SCHEME 3.
Proposed secondary structure of TAR DNA (right) and sequences of complementary and noncomplementary DNA oligonucleotides used in this study (left) are shown. (Right) Region A, B, C, and D represent the regions complementary to the DNA oligonucleotides shown on the left. (Left) Oligonucleotides preceded by “A” are Cy5 labeled. A-13-N and 12-N are oligonucleotides designed to be noncomplementary to TAR DNA, as defined by fewer than four consecutive Watson-Crick basepairs.
Synthetic NC protein, with Met-46 mutated to norleucine to avoid oxidation to Met(O), was prepared chemically via Fmoc solid-phase synthesis carried out with aid of a 433A Peptide Synthesizer (Applied Biosystems, Framingham MA). The C-terminal residue, Asn, was anchored to PAL-PEG-PS resin via its side chain (i.e., by coupling Fmoc-Asp-OtBu, as first residue). Deprotection/coupling cycles followed manufacturer recommendations, with all residues double coupled. The fully assembled peptide resin was cleaved with reagent K (53). The crude product was purified by reversed-phase HPLC to give a material of ∼87% homogeneity (as judged by analytical HPLC) (MALDI-MS; [M + H]calc., 6330.2; [M + H]found, 6330.1). After lyophilization, the purified synthetic NC was reconstituted by assuming that the recovered white solid contained 100% peptide content. The solid was dissolved (0.6 mL/mg peptide) in reconstitution buffer (40 mM HEPES, 5 mM DTT, 0.1 mM tris(2-carboxyethyl)phosphine hydrochloride) that contained 3.0 equivalents of ZnCl2, and lyophilized for long-term storage. It should be noted that the purified NC before reconstitution often contains a disulfide bond, based on mass spectrometric analysis. The reconstitution buffer contains DTT that reduces the disulfides and allows correct folding of the Zn fingers to occur. The chaperone activity of the synthetic NC was shown to be higher than NC prepared previously from Escherichia coli expression.
DNA immobilization
The reaction chambers were incubated with streptavidin (Molecular Probes, Eugene, OR; 0.2 mg/mL in HEPES buffer) in 25 mM HEPES buffer, pH 7.3, 40 mM NaCl (buffer A) for 10 min, after which the chambers were rinsed with buffer A. In all cases, except for as noted in the text, the experiments were performed on TAR DNA immobilized through a biotin linkage at T28. The exceptions refer to the use of “inverted” TAR, in which the biotin immobilization was performed at T64. The primary structure of each, including the respective location of the biotin, is listed in Scheme 3. Subsequently, the biotinylated TAR DNA solutions (25–50 pM) in buffer A were incubated in the reaction chamber for 20 min. The chambers were then filled with buffer A and Teflon tubing was adapted to the chamber ports. Two syringe pumps delivered buffer A/reactant solutions at a rate of 2 μl/min. A 10-min equilibration period at a flow rate of 10 μl/min was elapsed before measurements were taken under a new set of conditions. All solutions contained buffer A, 2 mM MgCl2 (Ambion, Austin, TX), and an oxygen scavenger system (1% v/v 2-mercaptoethanol (Sigma-Aldrich, St. Louis, MO), 3% w/v β-d(+)glucose (Sigma-Aldrich), 0.1 mg/mL glucose oxidase (Roche Applied Science, Hague Road, IN), and 0.02 mg/mL catalase (Roche Applied Science) (54,55).
Experimental setup
The experimental setup has been described previously (41,56,57). Briefly, a closed-loop sample scanning stage (NPS-XY-100A, Queensgate, Torquay, Devon, UK) was used for imaging and sample positioning. Continuous wave excitation (514 nm, 5–10 μW/μm2) from an argon ion laser (model Reliant 150m, Laser Physics, West Jordan, UT) was introduced via an optical fiber and was directed by a dichroic beamsplitter (530 DCLP, Chroma, Rockingham, VT) to the sample via a high numerical aperture oil immersion microscope objective (Zeiss Fluar, 100×, N.A. 1.3). Fluorescence was retrofocused using the excitation objective and split from scattered excitation light with a dichroic beamsplitter and a holographic Raman notch filter (Kaiser Optical Systems, Ann Arbor, MI). Donor and acceptor fluorescence were separated with a second beamsplitter (Chroma 630 DCXR) and then directed to two avalanche photodiode detectors (Perkin Elmer Optoelectronics SPCM-AQR-15, Vaudreuil, Quebec, Canada). The intensity time trajectories were acquired with 1-ms time resolution.
Data analysis
Single hairpin fluorescence intensity time trajectories were recorded using separate donor and acceptor channels. The signals were corrected for background emission/noise and donor/acceptor cross talk due to overlapping emission as previously described (41). Blinking events (reversible acceptor photobleaching) were removed before data analysis as previously described (41). The corrected intensity trajectories for the donor and acceptor channels, IA(t) and ID(t), respectively, were binned in the appropriate widths, referred to as τB. In this way the single-molecule FRET efficiency, EFRET(t) can be defined as:
 |
(1) |
where φi is the quantum yield of the respective dye, and ηi is the efficiency of each detector. What is measured, however, is the apparent FRET efficiency, EA, defined as:
 |
(2) |
To convert EA into EFRET, it is necessary to determine the correction factor describing the dye/detector efficiencies. The correction factor was obtained by comparing emission under 100 and 0% energy transfer conditions, and was found to be ∼1 in the current experiment. Thus, the value obtained in each case for EA represents almost exactly the true value of EFRET. EA was calculated for each binned point over the entire trajectory. Filtering of low EA systems (e.g., 0.4) was not performed because of shot noise limits.
EA autocorrelation amplitudes were estimated, as described in a previous study (41) using the single-molecule cross-correlation curves and the following expression,
 |
(3) |
 |
(4) |
where τ is the lag time. The EA autocorrelation amplitude is a measure of the variance of the nucleic acid 3′/5′ end-to-end distance FRET fluctuations. It is given by C(δτ) where δτ is the time spacing in the EFRET(t) measurements. It is the earliest value of C(τ) that is not affected by shot noise. For the qualitative purpose of this work we simply report the order of magnitude of the observed autocorrelation amplitudes, and do not report the correlation time (typically a few milliseconds) or the functional form of the observed autocorrelation decay, which is beyond the scope of this study. For many of the observations the autocorrelation amplitudes were undetectably small (i.e., <5 × 10⁻⁴) indicating a relatively static structure analogous to a DNA duplex structure in the absence of NC. In other cases, relatively large autocorrelation amplitudes were observed indicating large amplitude TAR DNA secondary structure fluctuations.
Single-molecule kinetic experiments of annealing of donor-labeled TAR DNA to the zipper mechanism mimic, A-27-A, and the kissing mechanism mimic, A-24-B (Fig. 4), were accomplished by recording multiple single-molecule confocal images of a 30- × 30-μm region at various times after introduction of the DNA mimics to a sample cell containing immobilized donor-labeled TAR DNA. Each image frame contained 100–200 single-molecule spots. The total scan time for each image frame was 128 s. The donor and acceptor images were collected simultaneously. Photobleached molecules were eliminated from the statistical analysis. The data were analyzed automatically by a computer program that determined the location and intensity of each molecule in the donor and acceptor images for each frame.
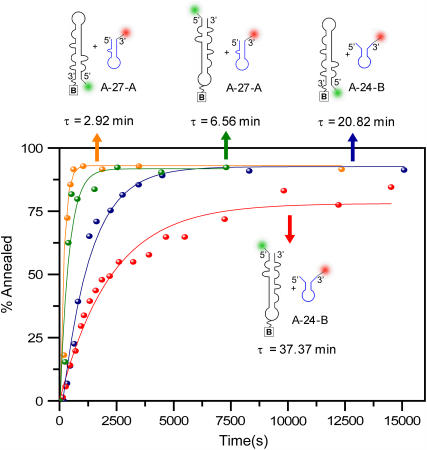
FIGURE 4.
Kinetic curves for the annealing rates of the zipper mimic, A-27-A, versus the kissing mimic, A-24-B, with donor-labeled TAR DNA. These experiments were performed in the presence of 445 nM NC and 2 mM Mg2+. The oligonucleotide concentrations were 10 nM in both cases. Analogous reactions with inverted donor-labeled TAR DNA are also included in the figure.
A FRET value was calculated for each molecule using the observed intensities, and corrected for cross talk and background intensity. For each molecule in each frame, the FRET value was used to classify each molecule as either unannealed donor-labeled TAR DNA or the annealed product. FRET histograms for each frame showed well-resolved peaks for annealed and unannealed TAR DNA, that are analogous to Fig. 3. The reported reaction time, τ, was determined by fitting the percentage of annealed molecules versus time curves to a first-order kinetic model, with a rate constant equal to 1/τ.
FIGURE 3.
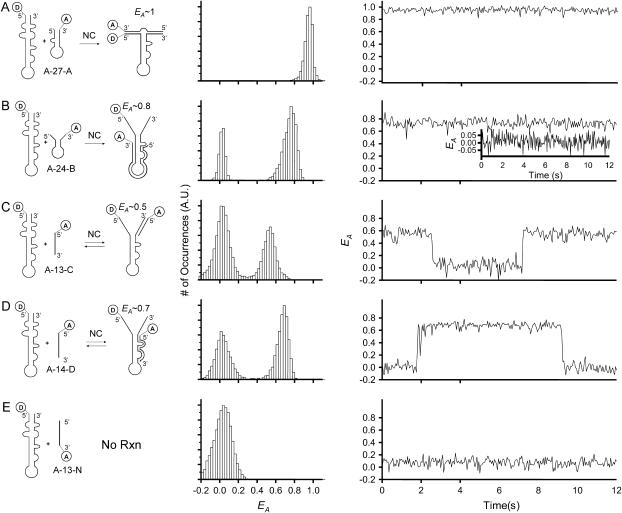
(A–E) Ensemble EA histograms (middle) and representative single-molecule EA time trajectories (right) are shown for the reactions shown at left. All measurements were performed using donor-labeled TAR DNA and acceptor-labeled oligonucleotides in the presence of 445 nM NC and 2 mM Mg2+. The data are presented using τB = 50 ms. The oligonucleotides used are: (A) 10 nM A-27-A, (B) 10 nM A-24-B. The inset shows that no observable binding occurs in a minor population of the single molecules measured. (C) For 100 nM A-13-C, the distributions of EA and the EA trajectory exhibit reversibility. (D) Similar reversible binding was observed with A-14-D, and (E) 100 nM A13-N. No binding was observed for 100 nM A-13-N.
RESULTS AND DISCUSSION
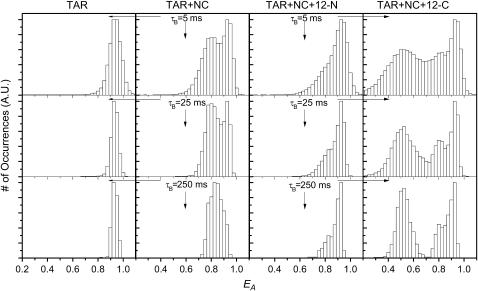
Columns 1 and 2 of Fig. 1 summarize the results of a SMFRET analysis of donor/acceptor labeled TAR DNA alone and in the presence of NC, respectively. The individual single-molecule EA histograms (obtained from the single-molecule EA trajectories) can be combined in an “ensemble” histogram. In this case, the term “ensemble” does not imply that the EA values have been ensemble averaged. The resultant ensemble EA histograms, gathered from 20 to 100 single molecules and comprised of thousands of occurrences, are normalized to a common scale. Ensemble EA histograms for donor/acceptor labeled TAR DNA in the absence of NC are shown in column 1 of Fig. 1. The data are presented at three different binning times, τB: 5, 25, and 250 ms. The near-unity EA value for donor/acceptor labeled TAR DNA in the absence of NC indicates that it is in its C TAR form, shown in Scheme 1. The 5-ms τB data are broadened primarily by shot noise, but these effects are virtually eliminated once the data have been binned into 250-ms widths. The small broadening in the distribution is due to experimental/data analysis errors. The ∼1 EA, narrow distribution width, and zero EA autocorrelation amplitude (not shown) support the model of C TAR as a static system with intact secondary structure.
FIGURE 1.
Ensemble EA values of doubly labeled TAR DNA at three different τB under different reaction conditions are shown. (Column 1) EA histogram before the addition of NC. (Column 2) EA histogram after addition of 445 nM NC. (Column 3) EA in the presence of 445 nM NC and 100 nM noncomplementary 12-N oligomer. (Column 4) EA in the presence of 445 nM NC and 100 nM complementary 12-C oligomer. All experiments were performed at 2 mM Mg2+.
In contrast, when 445 nM NC is added (Fig. 1, column 2) the histogram of EA values becomes bimodal, indicating a dynamic distribution of both C and Y forms. Our previous results have shown that the NC-induced structural transformation between C and Y form (41) occurs on a ∼5-ms timescale. Compared with the results in the absence of NC (Fig. 1, columns 1 and 2, bottom), the significant broadening of the EA histogram at 250-ms τB in the presence of NC further indicates there is a slow fluctuation occurring at >250 ms. These results, and the detailed analyses presented elsewhere (41,42), reveal that there is considerable NC-dependent heterogeneous fluctuation in the TAR DNA secondary structure. This dynamic heterogeneity was found to be highly dependent on NC concentration, and suggests that the effects of NC are cooperative (i.e., multiple NC molecules are required for even the simplest dynamics described in Cosa et al. (42)). In the annealing experiments presented below, the NC concentration was held constant at 445 nM, two orders of magnitude above the limiting concentration, assuming an approximate binding ratio of 1:7 NC/nucleotides (58).
The critical dependence of NC activity on the TAR DNA secondary structure can also be observed by introducing a single-stranded noncomplementary oligonucleotide to the system. The presence of the noncomplementary oligonucleotide, 12-N, at high concentration (100 nM), only affects the relative distribution of C and Y forms as indicated by the histograms shown at different τB in column 3 of Fig. 1. The ensemble EA values show that the TAR DNA structure has shifted toward the C form. These results suggest that the effect of 12-N is to reduce the activity of NC. NC has a high binding efficiency for both TAR DNA and for the single-stranded 12-N. The lower effective concentration of NC results in increased occurrence of the C form of TAR DNA. These results are consistent with detailed NC concentration-dependent studies presented elsewhere (41,42).
The situation is different for the case of the complementary oligomer, 12-C. An additional feature (EA ∼ 0.5) is present in the EA distribution shown in column 4 of Fig. 1, which corresponds to the binding between 12-C and TAR DNA. The process, however, is reversible on a ∼10-s timescale (see further results on A-13-C, discussed below). Retention of separate species at high τB indicates that the lifetimes of the bound and unbound systems of 12-C with TAR DNA are longer than 250 ms. Additionally, a similar shift from Y TAR to C TAR can be observed as described for 12-N above. The cause is similar: competition for NC by the single-stranded 12-C decreases the activity of NC toward destabilizing L1–L2. These results indicate that nucleation with a complementary oligonucleotide can occur at the 3′ end of the Y form of TAR DNA, providing support for the zipper pathway.
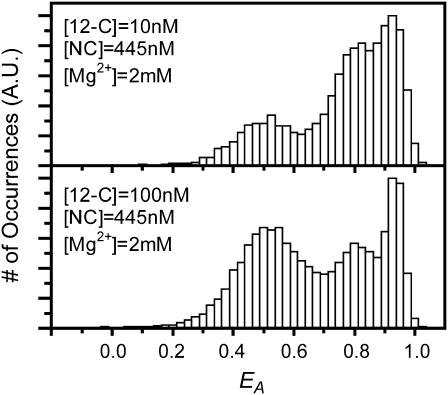
The dynamic equilibrium for the binding of shorter oligomers to TAR DNA is demonstrated in Fig. 2. Here, the EA histograms for the reversible binding of 12-C to donor/acceptor labeled TAR DNA are compared for two different oligomer concentrations. In each case the histogram indicates the presence of three distinct species corresponding to C TAR, Y TAR, and the bound 12-C/TAR DNA complex. The area of each peak in the histogram reflects the relative concentration of each form at equilibrium. When the 12-C concentration is increased to 100 nM, amplitude ratios shift to increased populations of bound and C forms relative to the Y form. This is due both to a higher 12-C concentration-induced increase in yield, in the case of the bound form, and to decreased activity of NC, in the case of the Y and C forms.
FIGURE 2.
A summary of the reaction between doubly labeled TAR DNA and oligonucleotide 12-C at two concentrations is shown. The ensemble distributions of EA were obtained at 2 mM Mg2+, 445 nM NC, and 10 nM 12-C (top) or 100 nM 12-C (bottom). At higher [12-C], the structure of TAR is shifted from Y states to bound states. The data are presented using τB = 10 ms.
To further examine this process, the interaction between donor-labeled TAR DNA and acceptor-labeled A-27-A (Scheme 3) was investigated. This construct was designed to mimic zipper nucleation at both termini. In contrast to the results obtained with 12-C, the reaction between TAR DNA and A-27-A occurs irreversibly within the time frame of the experiment, and results in a narrow distribution of EA at ∼1 (Fig. 3 A). The high EA is consistent with the structure illustrated (Fig. 3 A, left) in which the two dyes are in close proximity due to complete annealing. An undetectably small EA autocorrelation amplitude was observed indicating a static, fully annealed product. These results provide support for a stable structure that is an excellent candidate for an intermediate occurring by the zipper mechanism.
When the analogous experiment was performed using a DNA oligonucleotide designed to interact via the kissing mechanism, A-24-B, the formation of a stably annealed product was also observed (Fig. 3 B). These data indicate that the kissing mechanism is also viable. However, the formation of the duplex via the kissing interaction required a longer time relative to the zipper construct (see below for further discussion), and in fact did not react to completion within the experimental observation time (∼4 h; see discussion of Fig. 4 for further detail). This is indicated by the retention of unreacted donor-only emission observed in the EA histogram in Fig. 3 B (center column). Representative single-molecule EA trajectories, EA(t), for reacted and unreacted molecules are shown in the right column and its inset. The timescale for the formation of the kissing loop intermediate was similarly slow when inverted TAR DNA was used. The 〈EA〉 of ∼0.8 for the annealed product is consistent with an increased distance between the two dyes, as illustrated (Fig. 3 B, left). Like the zipper reaction mentioned above, the reaction was irreversible within the experimental time frame. However, both the relatively broad EA distribution and a relatively large EA autocorrelation amplitude (∼10−3) suggest that the resultant annealed structure is highly dynamic, compared to the product formed when TAR DNA was annealed with the zipper mimic discussed earlier. This is most likely due to residual fluctuations in the unannealed 3′ and 5′ termini of TAR DNA, as observed earlier.
In contrast to the irreversible reactions observed in zipper and kissing reactions, reversible binding was observed when SMFRET was performed using shorter acceptor-labeled oligomers complementary to either the L1–L2 region (A-13-C) or the L3–L4 region (A-14-D). The ensemble EA histograms for each reaction are shown in Fig. 3, C and D, respectively. Single-molecule trajectories in the right column for the nucleation of these shorter oligomers indicate binding reversibility, similar to the results described earlier for 12-C (Fig. 1). Thus, in the ensemble EA histogram for each reaction, the relative distribution of bound and unbound states reflects the equilibrium process. The Keq for the reactions shown in Fig. 3, C and D, were calculated to be 0.62 and 1.19, respectively. The ensemble EA histograms for these experiments, shown in the center column of Fig. 3, C and D, yield evidence that in the presence of NC, the annealing can occur at any nucleation site along the TAR DNA hairpin. This is despite previous observations that the secondary structure of TAR DNA is not measurably weakened in the presence of NC in any region other than L1–L2 (41). These experiments also verify that the annealing processes are not perturbed by dye location. Nonspecific binding can be ruled out because no reaction was observed when acceptor-labeled noncomplementary A-13-N was used, as shown in Fig. 3 E.
The results presented in Fig. 3 demonstrate that annealing can be initiated at multiple locations on the TAR DNA hairpin. Also, the relative yield of the kissing product versus the zipper product observed at room temperature suggests that the kinetic pathways for each type of intermediate may be different. To evaluate this hypothesis in more depth, the kinetics of formation of each type of product was measured, as shown in Fig. 4. As can be clearly observed, the zipper product was formed more rapidly than the kissing product, with reaction lifetimes of 7 and 37 min, respectively. The analogous two reactions were also performed using inverted donor-labeled TAR DNA, yielding first-order lifetimes of <3 and 21 min for the zipper and kissing products, respectively. (The ∼3-min value is close to the instrument response time, which is limited by the confocal scan time per image, i.e., 2 min.).
These kinetic results are consistent with our previous observation that in the presence of NC, the secondary structure in the L1–L2 regions of TAR DNA is disrupted (41,42), allowing for more rapid annealing by the zipper mechanism. Interestingly, the kissing product formation lifetime was faster when the immobilization site was moved away from the hairpin region. This helps to confirm that the kissing product forms through interhairpin interactions, because biotin immobilization in the hairpin loop would be expected to inhibit loop-loop interactions.
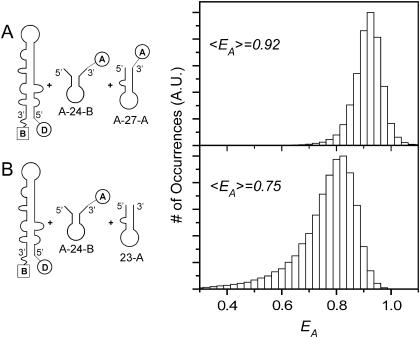
These results demonstrate that the zipper product is the more efficient pathway for the annealing of TAR DNA with DNA oligonucleotides. It is not the only pathway, however, and several types of evidence suggest that the kissing intermediate should also be considered as a candidate for TAR/TAR annealing (18,43). Also, MFOLD predicts that the kissing intermediate is more thermodynamically stable than the zipper intermediate (59–62). The competition between kinetic and thermodynamic reaction control was tested using a competitive annealing experiment, in which both zipper and kissing intermediates were allowed to react simultaneously with TAR DNA. When both A-27-A and A-24-B were reacted with donor-labeled TAR DNA, the EA histogram, shown in Fig. 5 A, suggests that the zipper product dominates. The results of a control experiment (Fig. 5 B), in which only the kissing oligomer was dye labeled, suggests that both types of products were formed, however. Thus, although the zipper product forms more rapidly, as the kinetically favored pathway, the kissing product forms as well, consistent with its predicted thermodynamic stability.
FIGURE 5.
(A) An ensemble EA histogram is shown for the simultaneous reaction of A-27-A and A-24-B with donor-labeled TAR DNA at [Mg2+] = 2 mM and [NC] = 445 nM. The 〈EA〉 of 0.92 is consistent with A-27-A binding. (B) An ensemble EA histogram for the reaction of 23-A and A-24-B with donor-labeled TAR DNA under similar reaction conditions results in an 〈EA〉 of 0.75, consistent with A-24-B binding. The data are presented using τB = 10 ms.
CONCLUSIONS
The mechanism of NC-chaperoned TAR DNA/TAR RNA annealing has been examined using TAR DNA and DNA oligonucleotides mimicking the potential annealing intermediates. In all cases, the previously reported Y structure of TAR DNA is preserved in the presence of NC and various oligonucleotides. It was found that annealing occurs through both zipper and kissing intermediates, although kinetic experiments indicate that the zipper product formation occurs more rapidly. In competitive reaction experiments, both types of intermediates are in fact observed. The results support a model of minus-strand transfer in which NC promotes the formation of multiple intermediates through which the fully formed product may occur.
Acknowledgments
We thank Dr. Ioulia Rouzina and Ms. My-Nuong Vo for critical reading of the manuscript and helpful discussions, as well as the reviewers for their suggestions.
This work was supported by National Institutes of Health (NIH) grant GM65818 (P.B.), NIH grant GM65056 (K.M.-F.), NIH postdoctoral National Research Service Award GM073534 (C.F.L), and the Welch Foundation (P.B.).
Gonzalo Cosa's present address is Dept. of Chemistry, McGill University, 801 Sherbrooke St. W. Montreal, Quebec H3A 2K6, Canada.
References
- 1.Green, L. M., and J. M. Berg. 1990. Retroviral nucleocapsid protein-metal ion interactions: folding and sequence variants. Proc. Natl. Acad. Sci. USA. 87:6403–6407. [DOI] [PMC free article] [PubMed] [Google Scholar]
- 2.Henderson, L. E., T. D. Copeland, R. C. Sowder, G. W. Smythers, and S. Oroszlan. 1981. Primary structure of the low molecular weight nucleic acid-binding proteins of murine leukemia viruses. J. Biol. Chem. 256:8400–8406. [PubMed] [Google Scholar]
- 3.Berg, J. M. 1986. Potential metal-binding domains in nucleic acid binding proteins. Science. 232:485–487. [DOI] [PubMed] [Google Scholar]
- 4.Covey, S. N. 1986. Amino acid sequence homology in gag region of reverse transcribing elements and the coat protein gene of cauliflower mosaic virus. Nucleic Acids Res. 14:623–633. [DOI] [PMC free article] [PubMed] [Google Scholar]
- 5.Levin, J. G., J. Guo, I. Rouzina, and K. Musier-Forsyth. 2005. Nucleic acid chaperone activity of HIV-1 nucleocapsid protein: critical role in reverse transcription and molecular mechanism. Prog. Nucleic Acid Res. Mol. Biol. 80:217–286. [DOI] [PubMed] [Google Scholar]
- 6.De Guzman, R. N., Z. R. Wu, C. C. Stalling, L. Pappalardo, P. N. Borer, and M. F. Summers. 1998. Structure of the HIV-1 nucleocapsid protein bound to the SL3 Ψ-RNA recognition element. Science. 279:384–388. [DOI] [PubMed] [Google Scholar]
- 7.Rein, A., L. E. Henderson, and J. G. Levin. 1998. Nucleic-acid-chaperone activity of retroviral nucleocapsid proteins: significance for viral replication. Trends Biochem. Sci. 23:297–301. [DOI] [PubMed] [Google Scholar]
- 8.Berglund, J. A., B. Charpentier, and M. Rosbash. 1997. A high affinity binding site for the HIV-1 nucleocapsid protein. Nucleic Acids Res. 25:1042–1049. [DOI] [PMC free article] [PubMed] [Google Scholar]
- 9.D'Souza, V., and M. F. Summers. 2004. Structural basis for packaging the dimeric genome of Moloney murine leukemia virus. Nature. 431:586–590. [DOI] [PubMed] [Google Scholar]
- 10.Fisher, R. J., A. Rein, M. Fivash, M. A. Urbaneja, J. R. Casas-Finet, M. Medaglia, and L. E. Henderson. 1998. Sequence-specific binding of human immunodeficiency virus type 1 nucleocapsid protein to short oligonucleotides. J. Virol. 72:1902–1909. [DOI] [PMC free article] [PubMed] [Google Scholar]
- 11.Darlix, J.-L., M. Lapadat-Tapolsky, H. de Rocquigny, and B. P. Roques. 1995. First glimpses at structure-function relationships of the nucleocapsid protein of retroviruses. J. Mol. Biol. 254:523–537. [DOI] [PubMed] [Google Scholar]
- 12.Stoylov, S. P., C. Vuilleumier, E. Stoylova, H. De Rocquigny, B. P. Roques, D. Gerard, and Y. Mély. 1997. Ordered aggregation of ribonucleic acids by the human immunodeficiency virus type 1 nucleocapsid protein. Biopolymers. 41:301–312. [DOI] [PubMed] [Google Scholar]
- 13.Zhang, Y., H. Qian, Z. Love, and E. Barklis. 1998. Analysis of the assembly function of the human immunodeficiency virus type 1 Gag protein nucleocapsid domain. J. Virol. 72:1782. [DOI] [PMC free article] [PubMed] [Google Scholar]
- 14.Darlix, J.-L., C. Gabus, M. T. Nugeyre, F. Clavel, and F. Barré-Sinoussi. 1990. Cis elements and trans-acting factors involved in the RNA dimerization of the human immunodeficiency virus HIV-1. J. Mol. Biol. 216:689–699. [DOI] [PubMed] [Google Scholar]
- 15.Feng, Y. X., T. D. Copeland, L. E. Henderson, R. J. Gorelick, W. J. Bosche, J. G. Levin, and A. Rein. 1996. HIV-1 nucleocapsid protein induces “maturation” of dimeric retroviral RNA in vitro. Proc. Natl. Acad. Sci. USA. 93:7577–7581. [DOI] [PMC free article] [PubMed] [Google Scholar]
- 16.Sakaguchi, K., N. Zambrano, E. T. Baldwin, B. A. Shapiro, J. W. Erickson, J. G. Omichinski, G. M. Clore, A. M. Gronenborn, and E. Appella. 1993. Identification of a binding site for the human immunodeficiency virus type 1 nucleocapsid protein. Proc. Natl. Acad. Sci. USA. 90:5219–5223. [DOI] [PMC free article] [PubMed] [Google Scholar]
- 17.Fu, W., R. J. Gorelick, and A. Rein. 1994. Characterization of human immunodeficiency virus type 1 dimeric RNA from wild-type and protease-defective virions. J. Virol. 68:5013–5018. [DOI] [PMC free article] [PubMed] [Google Scholar]
- 18.Muriaux, D., H. De Rocquigny, B. P. Roques, and J. Paoletti. 1996. NCp7 activates HIV-1 Lai RNA dimerization by converting a transient loop-loop complex into a stable dimer. J. Biol. Chem. 271:33686–33692. [DOI] [PubMed] [Google Scholar]
- 19.Chan, B., K. Weidemaier, W. T. Yip, P. F. Barbara, and K. Musier-Forsyth. 1999. Intra-tRNA distance measurements for nucleocapsid protein-dependent tRNA unwinding during priming of HIV reverse transcription. Proc. Natl. Acad. Sci. USA. 96:459–464. [DOI] [PMC free article] [PubMed] [Google Scholar]
- 20.Feng, Y. X., S. Campbell, D. Harvin, B. Ehresmann, C. Ehresmann, and A. Rein. 1999. The human immunodeficiency virus type 1 Gag polyprotein has nucleic acid chaperone activity: possible role in dimerization of genomic RNA and placement of tRNA on the primer binding site. J. Virol. 73:4251–4256. [DOI] [PMC free article] [PubMed] [Google Scholar]
- 21.De Rocquigny, H., C. Gabus, A. Vincent, M. C. Fournié-Zaluski, B. Roques, and J. L. Darlix. 1992. Viral RNA annealing activities of human immunodeficiency virus type 1 nucleocapsid protein require only peptide domains outside the zinc fingers. Proc. Natl. Acad. Sci. USA. 89:6472–6476. [DOI] [PMC free article] [PubMed] [Google Scholar]
- 22.Wu, T., J. Guo, J. Bess, L. E. Henderson, and J. G. Levin. 1999. Molecular requirements for human immunodeficiency virus type 1 plus-strand transfer: analysis in reconstituted and endogenous reverse transcription systems. J. Virol. 73:4794–4805. [DOI] [PMC free article] [PubMed] [Google Scholar]
- 23.Guo, J., T. Wu, J. Anderson, B. F. Kane, D. G. Johnson, R. J. Gorelick, L. E. Henderson, and J. G. Levin. 2000. Zinc finger structures in the human immunodeficiency virus type 1 nucleocapsid protein facilitate efficient minus- and plus-strand transfer. J. Virol. 74:8980–8988. [DOI] [PMC free article] [PubMed] [Google Scholar]
- 24.Johnson, P. E., R. B. Turner, Z. R. Wu, L. Hairston, J. Guo, J. G. Levin, and M. F. Summers. 2000. A mechanism for plus-strand transfer enhancement by the HIV-1 nucleocapsid protein during reverse transcription. Biochemistry. 39:9084–9091. [DOI] [PubMed] [Google Scholar]
- 25.Muthuswami, R., J. Chen, B. P. Burnett, R. L. Thimmig, N. Janjic, and C. S. McHenry. 2002. The HIV plus-strand transfer reaction: determination of replication-competent intermediates and identification of a novel lentiviral element, the primer over-extension sequence. J. Mol. Biol. 315:311–323. [DOI] [PubMed] [Google Scholar]
- 26.You, J. C., and C. S. McHenry. 1994. Human immunodeficiency virus nucleocapsid protein accelerates strand transfer of the terminally redundant sequences involved in reverse transcription. J. Biol. Chem. 269:31491–31495. [PubMed] [Google Scholar]
- 27.Davis, W. R., S. Gabbara, D. Hupe, and J. A. Peliska. 1998. Actinomycin D inhibition of DNA strand transfer reactions catalyzed by HIV-1 reverse transcriptase and nucleocapsid protein. Biochemistry. 37:14213–14221. [DOI] [PubMed] [Google Scholar]
- 28.Golinelli, M.-P., and S. H. Hughes. 2003. Secondary structure in the nucleic acid affects the rate of HIV-1 nucleocapsid-mediated strand annealing. Biochemistry. 42:8153–8162. [DOI] [PubMed] [Google Scholar]
- 29.Guo, J., T. Wu, J. Bess, L. E. Henderson, and J. G. Levin. 1998. Actinomycin D inhibits human immunodeficiency virus type 1 minus-strand transfer in in vitro and endogenous reverse transcriptase assays. J. Virol. 72:6716–6724. [DOI] [PMC free article] [PubMed] [Google Scholar]
- 30.Guo, J., T. Wu, B. F. Kane, D. G. Johnson, L. E. Henderson, R. J. Gorelick, and J. G. Levin. 2002. Subtle alterations of the native zinc finger structures have dramatic effects on the nucleic acid chaperone activity of human immunodeficiency virus type 1 nucleocapsid protein. J. Virol. 76:4370–4378. [DOI] [PMC free article] [PubMed] [Google Scholar]
- 31.Hong, M. K., E. J. Harbron, D. B. O'Connor, J. Guo, P. F. Barbara, J. G. Levin, and K. Musier-Forsyth. 2003. Nucleic acid conformational changes essential for HIV-1 nucleocapsid protein-mediated inhibition of self-priming in minus-strand transfer. J. Mol. Biol. 325:1–10. [DOI] [PubMed] [Google Scholar]
- 32.Lapadat-Tapolsky, M., C. Pernelle, C. Borie, and J.-L. Darlix. 1995. Analysis of the nucleic acid annealing activities of nucleocapsid protein from HIV-1. Nucleic Acids Res. 23:2434–2441. [DOI] [PMC free article] [PubMed] [Google Scholar]
- 33.Berkhout, B., and K.-T. Jeang. 1991. Detailed mutational analysis of TAR RNA: critical spacing between the bulge and loop recognition domains. Nucleic Acids Res. 19:6169–6176. [DOI] [PMC free article] [PubMed] [Google Scholar]
- 34.Baudin, F., R. Marquet, C. Isel, J.-L. Darlix, B. Ehresmann, and C. Ehresmann. 1993. Functional sites in the 5′ region of human immunodeficiency virus type 1 RNA form defined structural domains. J. Mol. Biol. 229:382–397. [DOI] [PubMed] [Google Scholar]
- 35.Guo, J., L. E. Henderson, J. Bess, B. Kane, and J. G. Levin. 1997. Human immunodeficiency virus type 1 nucleocapsid protein promotes efficient strand transfer and specific viral DNA synthesis by inhibiting TAR-dependent self-priming from minus-strand strong-stop DNA. J. Virol. 71:5178–5188. [DOI] [PMC free article] [PubMed] [Google Scholar]
- 36.Driscoll, M. D., and S. H. Hughes. 2000. Human immunodeficiency virus type 1 nucleocapsid protein can prevent self-priming of minus-strand strong stop DNA by promoting the annealing of short oligonucleotides to hairpin sequences. J. Virol. 74:8785–8792. [DOI] [PMC free article] [PubMed] [Google Scholar]
- 37.Urbaneja, M. A., M. Wu, J. R. Casas-Finet, and R. L. Karpel. 2002. HIV-1 nucleocapsid protein as a nucleic acid chaperone: spectroscopic study of its helix-destabilizing properties, structural binding specificity, and annealing activity. J. Mol. Biol. 318:749–764. [DOI] [PubMed] [Google Scholar]
- 38.Azoulay, J., J. P. Clamme, J. L. Darlix, B. P. Roques, and Y. Mély. 2003. Destabilization of the HIV-1 complementary sequence of TAR by the nucleocapsid protein through activation of conformational fluctuations. J. Mol. Biol. 326:691–700. [DOI] [PubMed] [Google Scholar]
- 39.Beltz, H., J. Azoulay, S. Bernacchi, J. P. Clamme, D. Ficheux, B. Roques, J. L. Darlix, and Y. Mély. 2003. Impact of the terminal bulges of HIV-1 cTAR DNA on its stability and the destabilizing activity of the nucleocapsid protein NCp7. J. Mol. Biol. 328:95–108. [DOI] [PubMed] [Google Scholar]
- 40.Bernacchi, S., S. Stoylov, E. Piémont, D. Ficheux, B. P. Roques, J. L. Darlix, and Y. Mély. 2002. HIV-1 nucleocapsid protein activates transient melting of least stable parts of the secondary structure of TAR and its complementary sequence. J. Mol. Biol. 317:385–399. [DOI] [PubMed] [Google Scholar]
- 41.Cosa, G., E. J. Harbron, Y. Zeng, H. W. Liu, D. B. O'Connor, C. Eta-Hosokawa, K. Musier-Forsyth, and P. F. Barbara. 2004. Secondary structure and secondary structure dynamics of DNA hairpins complexed with HIV-1 NC protein. Biophys. J. 87:2759–2767. [DOI] [PMC free article] [PubMed] [Google Scholar]
- 42.Cosa, G., Y. Zeng, H. W. Liu, C. F. Landes, K. Musier-Forsyth, and P. F. Barbara. 2005. Evidence for non-two-state kinetics in the nucleocapsid protein chaperoned opening of DNA hairpins. J. Phys. Chem. B. In press. [DOI] [PubMed]
- 43.Berkhout, B., N. L. Vastenhouw, B. I. F. Klasens, and H. Huthoff. 2001. Structural features in the HIV-1 repeat region facilitate strand transfer during reverse transcription. RNA. 7:1097–1114. [DOI] [PMC free article] [PubMed] [Google Scholar]
- 44.Takahashi, K. I., S. Baba, P. Chattopadhyay, Y. Koyanagi, N. Yamamoto, H. Takaku, and G. Kawai. 2000. Structural requirement for the two-step dimerization of human immunodeficiency virus type 1 genome. RNA. 6:96–102. [DOI] [PMC free article] [PubMed] [Google Scholar]
- 45.Andersen, E. S., S. A. Contera, B. Knudsen, C. K. Damgaard, F. Besenbacher, and J. Kjems. 2004. Role of the trans-activation response element in dimerization of HIV-1 RNA. J. Biol. Chem. 279:22243–22249. [DOI] [PubMed] [Google Scholar]
- 46.Skripkin, E., J. Paillart, R. Marquet, B. Ehresmann, and C. Ehresmann. 1994. Identification of the primary site of the human immunodeficiency virus type 1 RNA dimerization in vitro. Proc. Natl. Acad. Sci. USA. 91:4945–4949. [DOI] [PMC free article] [PubMed] [Google Scholar]
- 47.Rist, M. J., and J. P. Marino. 2002. Mechanism of nucleocapsid protein catalyzed structural isomerization of the dimerization initiation site of HIV-1. Biochemistry. 41:14762–14770. [DOI] [PubMed] [Google Scholar]
- 48.Chang, K. Y., and I. Tinoco. 1997. The structure of an RNA “kissing” hairpin complex of the HIV TAR hairpin loop and its complement. J. Mol. Biol. 269:52–66. [DOI] [PubMed] [Google Scholar]
- 49.Comolli, L. R., J. G. Pelton, and I. Tinoco. 1998. Mapping of a protein-RNA kissing hairpin interface: Rom and Tar-Tar. Nucleic Acids Res. 26:4688–4695. [DOI] [PMC free article] [PubMed] [Google Scholar]
- 50.Chang, K., and I. Tinoco, Jr. 1994. Characterization of a “kissing” hairpin complex derived from the human immunodeficiency virus genome. Proc. Natl. Acad. Sci. USA. 91:8705–8709. [DOI] [PMC free article] [PubMed] [Google Scholar]
- 51.Torimura, M., S. Kurata, K. Yamada, T. Yokomaku, Y. Kamagata, T. Kanagawa, and R. Kurane. 2001. Fluorescence-quenching phenomenon by photoinduced electron transfer between a fluorescent dye and a nucleotide base. Anal. Sci. 17:155–160. [DOI] [PubMed] [Google Scholar]
- 52.Kurata, S., T. Kanagawa, K. Yamada, M. Torimura, T. Yokomaku, Y. Kamagata, and R. Kurane. 2001. Fluorescent quenching-based quantitative detection of specific DNA/RNA using a BODIPY((R)) FL-labeled probe or primer. Nucleic Acids Res. 29:E34. [DOI] [PMC free article] [PubMed] [Google Scholar]
- 53.King, D. S., C. G. Fields, and G. B. Fields. 1990. A cleavage method which minimizes side reactions following Fmoc solid phase peptide synthesis. Int. J. Pept. Protein Res. 26:255–266. [DOI] [PubMed] [Google Scholar]
- 54.Ha, T. 2001. Single-molecule fluorescence methods for the study of nucleic acids. Curr. Opin. Struct. Biol. 11:287–292. [DOI] [PubMed] [Google Scholar]
- 55.Harada, Y., K. Sakurada, T. Aoki, D. D. Thomas, and T. Yanagida. 1990. Mechanochemical coupling in actomyosin energy transduction studied by in vitro movement assay. J. Mol. Biol. 216:49–68. [DOI] [PubMed] [Google Scholar]
- 56.English, D. S., A. Furube, and P. F. Barbara. 2000. Single molecule spectroscopy in oxygen depleted polymer films. Chem. Phys. Lett. 324:15–19. [Google Scholar]
- 57.Yip, W. T., D. Hu, J. Yu, D. A. Vanden Bout, and P. F. Barbara. 1998. Classifying the photophysical dynamics of single- and multiple-chromophoric molecules by single molecule spectroscopy. J. Phys. Chem. A. 102:7564–7575. [Google Scholar]
- 58.Khan, R., and D. P. Giedroc. 1994. Nucleic acid binding properties of recombinant Zn2+ HIV-1 nucleocapsid protein are modulated by COOH-terminal processing. J. Biol. Chem. 269:22538–22546. [PubMed] [Google Scholar]
- 59.Zuker, M. 2003. Mfold web server for nucleic acid folding and hybridization prediction. Nucleic Acids Res. 31:3406–3415. [DOI] [PMC free article] [PubMed] [Google Scholar]
- 60.Zuker, M., D. H. Mathews, and D. H. Turner. 1999. Algorithms and Thermodynamics for RNA Secondary Structure Prediction: A Practical Guide. J. Barciszewski and B. F. C. Clark, editors. Kluwer Academic Publishers, Dordrecht, The Netherlands.
- 61.SantaLucia, J., Jr. 1998. A unified view of polymer, dumbbell, and oligonucleotide DNA nearest-neighbor thermodynamics. Proc. Natl. Acad. Sci. USA. 95:1460–1465. [DOI] [PMC free article] [PubMed] [Google Scholar]
- 62.Peyret, N. 2000. Prediction of nucleic acid hybridization: parameters and algorithms. PhD thesis. Department of Chemistry, Wayne State University, Detroit, MI.


