Abstract
The adhesive and mechanical properties of a cell-substratum adhesive secreted by live diatom cells were examined in situ using atomic force microscopy. The resulting force curves have a regular saw-tooth pattern, the characteristic fingerprint of modular proteins, and when bridged between tip and surface can repeatedly be stretched and relaxed resulting in precisely overlaying saw-tooth curves (up to ∼600 successive cycles). The average rupture force of the peaks is 0.794 ± 0.007 (mean ± SE) nN at a loading rate of 0.8 μm/s and the average persistence length is 0.026 ± <0.001 (mean ± SE) nm (fit using the worm-like chain model). We propose that we are pulling on single adhesive nanofibers, each a cohesive unit composed of a set number of modular proteins aligned in register. Furthermore, we can observe and differentiate when up to three adhesive nanofibers are pulled based upon multimodal distributions of force and persistence length. The high force required for bond rupture, high extensibility (∼1.2 μm), and the accurate and rapid refolding upon relaxation, together provide strong and flexible properties ideally suited for the cell-substratum adhesion of this fouling diatom and allow us to understand the mechanism responsible for the strength of adhesion.
INTRODUCTION
The benthic diatom Toxarium undulatum Bailey (Bacillariophyceae) (1) is a dominant member of the diatom community attached to Intersleek (a nontoxic, foul release coating) test panels in Australia. T. undulatum has not been recorded as a major biofouling species before, and is unusual because it is a benthic, centric diatom. Cells secrete adhesive mucilage from their valve poles (most probably from a row of enlarged pores in the apical invagination of the first girdle band (1)) that accumulates to form a pad. The traditional biochemical analysis of diatom mucilages combines complex and laborious methodologies to measure bulk properties, averaging over all extracellular molecules. These chemical measurements are then used to infer the likely origins and adhesive response of the diatom. We have taken a new, more direct approach, using atomic force microscopy (AFM) to characterize the nanomechanical properties of single adhesive molecules in their native state, describing their overall physical properties and function without detailed knowledge of their chemical structure.
The AFM has been used extensively to characterize the mechanical properties of a range of biomolecules, including titin, tenascin, collagen, and spider silk (see reviews Engel et al. and others (2–7)). Often the chemical composition and structure of the molecules of interest have been known a priori. This has enabled sophisticated experiments to be conducted using engineered polyproteins to compare the differences in the force versus distance curves from engineered and native molecules (8–10). These types of studies have provided an understanding of the molecular properties of biomolecules that govern the shape of AFM force curves. This has in turn allowed the physical properties of molecules of unknown structure to be investigated with AFM.
We have carried out a similar study using AFM to determine the structure and physical properties of individual adhesive nanofibers from the biofouling diatom T. undulatum in situ, without prior knowledge of its primary structure or chemical composition. This article describes the physical structure of the adhesive and its behavior under mechanical stress.
METHODS
Diatom culture
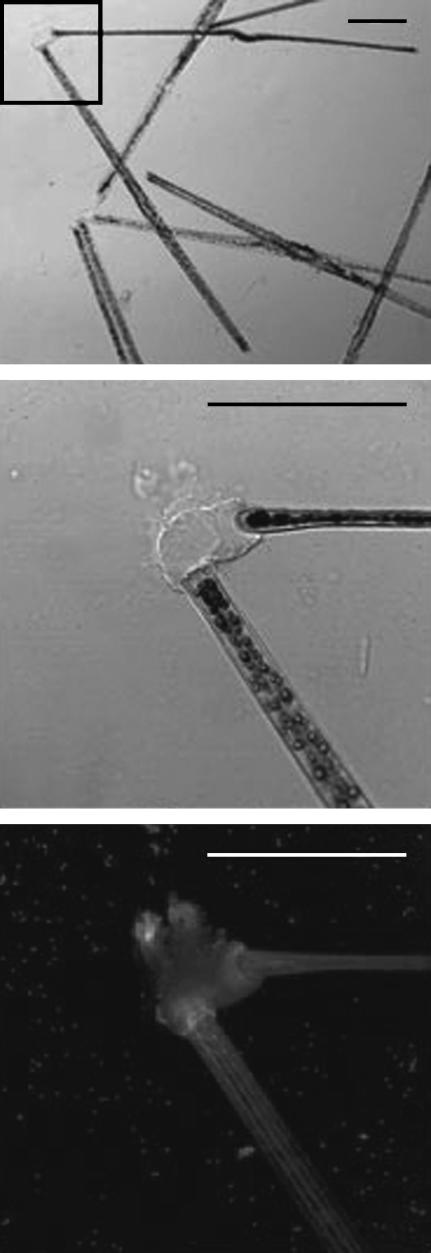
T. undulatum cells were isolated into clonal culture from panels coated with Intersleek 425 (International Coatings, Akzo Nobel, Gateshead, UK) in Port Phillip Bay, Melbourne that were provided by the Defense Science and Technology Organization, Melbourne, Victoria, Australia. T. undulatum cells (Fig. 1) were grown under static conditions in 250 ml conical flasks containing 100 ml K medium containing silicates (K+Si) (11) inside a growth cabinet at 16°C with a 16:8 h light/dark cycle. Axenic cultures were obtained by growing T. undulatum in K+Si with 0.1 mg/ml streptomycin sulfate and 100 units/ml sodium penicillin G and transferred into petri dishes containing standard K+Si.
FIGURE 1.
Confocal laser scanning microscope images (transmission = top two images; fluorescence projection = bottom image) of two live T. undulatum cells arising from a single mucilage pad stained with FITC-labeled Con A lectin. Bottom two images are higher magnification views of the area within the box in the top image. Scale bars = 50 μm.
Atomic force microscopy
T. undulatum cells were prepared for AFM by inoculating them into tissue culture petri dishes containing the same medium as above and returned to the culture conditions for 48 h. The petri dishes were then positioned on the stage of a Dimension 3100 AFM equipped with a Nanoscope IIIa controller (Veeco Metrology, Santa Barbara, CA), a fluid cell, and “V”-shaped unsharpened Si3N4 cantilevers (Park Scientific Instruments, Sunnyvale, CA) with measured spring constants (average 0.053 N/m, range 0.031–0.082 N/m) (12). The cantilever was first positioned over a diatom mucilage pad using the optical microscopy system and step motor. Then position refinement was accomplished using the piezo tube. Deflection versus piezo motion curves were recorded as the tip was lowered in a stepwise fashion toward the mucilage pad. A similar method has been used before and been termed “fly fishing” (13). After a curve was recorded on the pad the tip was retracted, while continuing to scan, to ensure the mucilage was detached and then moved to a new x-y position where the procedure was repeated. The tip velocities used ranged from 1.2–2 μm/s. Deflection versus piezo motion curves were then converted to force versus distance curves. The above procedure was repeated with an Asylum MFP-3D AFM (Asylum Research, Santa Barbara, CA) and raw curves were converted to force versus separation with the Asylum software to demonstrate reproducibility of the measured forces independently of the instrument. Sometimes, before mounting on the AFM stage, a directed flow of culture media was used to detach cells from their pads. The time of detachment and the location of these cell-less pads were recorded, so that we could return to the same pads after a given period of time. The pads were then probed as above immediately after detachment or were returned to the growth cabinet and probed up to 89 h later.
A second set of experiments was carried out in the same way as above except the ramp was fixed at 800 nm to get bridging of the mucilage between the tip and the diatom pad. When a saw-tooth curve was recorded the force curve was repeated continuously in the same position to record repeat stretching and relaxing of the mucilage. These scans were repeated at different tip velocities (0.8–7.4 μm/s) and with and without a 2-s pause before each retract scan. Repeat curves were then superimposed on each other to look at regularity of the saw-tooth pattern.
Proteolytic enzyme activity and cytological staining of pads
After normal bridging sequences were observed on a diatom pad the cleavage enzyme protease (Sigma-Aldrich, St. Louis, MO), prepared in K+Si, was added to the K+Si at a final concentration of 0.5–1 mg/ml. The pads were then probed again. These experiments were repeated with bovine serum albumin (BSA) (Sigma-Aldrich) dissolved in K+Si media (1 mg/ml) as a control. BSA was incubated with protease in K+Si and examined by polyacrylamide gel electrophoresis (PAGE) to ensure the protease was functional in the medium.
T. undulatum cells and pads were exposed to FITC-labeled lectins from fava bean (VFA, Sigma-Aldrich; 250 μg/ml K+Si), soybean (SBA, Sigma-Aldrich; 450 μg/ml K+Si), and jack bean (Con A, Vector, Burlingame, CA; 20 μg/ml K+Si) for 15 min before being flushed with fresh K+Si and viewed with a confocal laser scanning microscope. T. undulatum pads were also similarly treated with cytological stains Alcian Blue and Stains-All (Sigma-Aldrich).
Worm-like chain model of polymer elasticity
The worm-like chain (WLC) model of polymer elasticity was fitted to the force versus distance curves. The WLC model describes entropic polymer elasticity under mechanical force and is given by the following equation:
 |
where F = force, kB = Boltzmann's constant, T = absolute temperature, DPO = polymer extension length, q = persistence length, and L = contour length. The contour length (L) and persistence length (q) are adjustable parameters in the model.
RESULTS
Unbridged saw-tooth curves
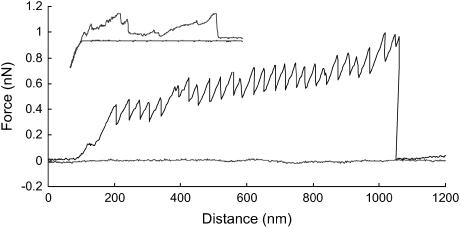
Adhesive pads were present at the poles of T. undulatum cells within 30 min of being inoculated into a petri dish, and could be probed with the AFM tip, resulting in two types of force versus distance curves. Firstly, the tip was driven into the pad and a significant deflection was observed on the advancing curve along with the retracting curve that exhibited large adhesive forces and an irregular series of peaks. Alternatively, when fly fishing, the curves displayed a characteristic saw-tooth pattern and smaller adhesive forces (Fig. 2). Under these conditions, the cantilever did not make “true” contact with the bulk mucilage before capture of the adhesive strand. We estimate the contact force was <5 pN (corresponding to deflection of <0.1 nm of a cantilever with a spring constant of 0.05 N/m). When cells were cultured for 48 h in petri dishes, the saw-tooth curves measured from their pads were the same as those obtained on freshly inoculated pads after 15–20 min. All experiments were therefore started after 48 h of culture because the pads were larger and easier to probe at that time. Saw-tooth curves were the same in both axenic and nonaxenic cultures.
FIGURE 2.
Fly fishing and nonfly fishing (inset) force versus distance curves (advancing = flat, retracting = saw tooth) taken on a mucilage pad with a live T. undulatum cell still attached. Curves recorded at 0.8 and 3 μm/s (inset).
The characteristic saw-tooth patterns obtained from force versus distance curves on the T. undulatum mucilage are shown in Fig. 2. The curves from these pads were the same for up to 12 h after cell removal, indicating that they did not cure in that time frame. After 48–89 h, force curves with the characteristic saw-tooth pattern were still obtained, but with reduced frequency and sometimes the curves had very indistinct peaks, or no peaks at all. This observation suggests that the adhesive slowly undergoes degradation and/or curing over time.
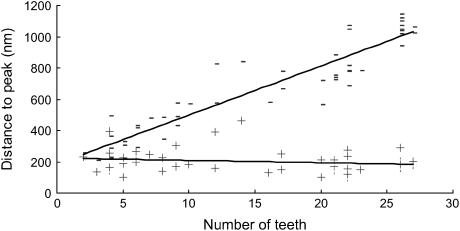
The saw-tooth curves were obtained by “fly fishing” and had remarkably regular features indicating that we were stretching a single molecular entity that has regular, repeating structures. The average distance between teeth was 34.3 ± 1.5 (mean ± SE) nm, the average peak force of the teeth was 0.801 ± 0.071 (mean ± SE) nN, and the average distance to the first tooth in the curve was 201 + 10.6 (mean ± SE) nm (Table 1). In contrast to the distance to the first tooth, the distance to the last tooth varied and was dependent on the number of peaks in the curve, which ranged from 3 to 27 (Fig. 3).
TABLE 1.
Average parameters for nonbridged (1.2–2 μm/s) and bridged (0.8 μm/s) saw tooth curves (mean ±1 SE)
| Nonbridged
|
Bridged
|
|||||
|---|---|---|---|---|---|---|
| Mean ± SE | n curves | n teeth | Mean ± SE | n curves | n teeth | |
| Tooth force (nN) | 0.801 ± 0.071 | 49 | 747 | 0.794 ± 0.007 | 37 | 660 |
| Trough to next tooth rise in force (nN) | 0.222 ± 0.022 | 49 | 747 | 0.232 ± 0.003 | 37 | 623 |
| Final tooth force (nN) | 1.128 ± 0.104 | 49 | 49 | – | – | – |
| Distance to first tooth (nm) | 201.4 ± 10.6 | 49 | 747 | 274.2 ± 16.9 | 37 | 37 |
| Distance between teeth (nm) | 34.2 ± 1.4 | 49 | 747 | 31.7 ± 0.34 | 37 | 623 |
| q (nm) (derived from WLC model) | 0.036 ± 0.004 | 8 | 114 | 0.026 ± <0.001 | 37 | 660 |
| Actual extension/WLC extension | 0.88 ± 0.03 | 8 | 114 | 0.784 ± 0.005 | 37 | 660 |
FIGURE 3.
Plot of the distance to the first (+) and last (−) peaks versus the number of peaks of 49 force versus distance retracting saw-tooth curves taken on mucilage pads with live T. undulatum cells still attached. The lines are linear fits to the data with R2 values of 0.8643 (last tooth) and 0.0307 (first tooth). Curves recorded 0.8 μm/s.
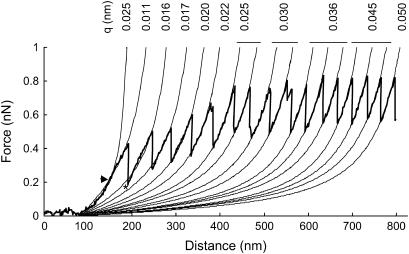
The WLC model fitted well to the initial rising section of each curve but there was often a discontinuity between this initial rising section and the first peak (Fig. 4). In contrast, the WLC model fitted more accurately to the last peaks. The average persistence length (q) was 0.036 + 0.004 (mean ± SE) nm (Table 1), and values were typically higher for the last tooth than the first tooth (Fig. 4). The measured distance to each peak corresponded to 88% of the contour length as determined by the WLC model (Table 1).
FIGURE 4.
Saw-tooth force versus distance retraction curve for a single bridged adhesive nanofiber with the WLC model fitted to each peak within the curve. The model is fitted from the point at which the retraction curves rise above zero deflection. The persistence length (q) for each of the WLC model curves is given. There are two WLC model fits to the first peak because the slope of the first peak changes at the point shown by the arrowhead, the initial rising part (up to the arrowhead) fits well with a persistence length (q) of 0.025 nm whereas the peak itself (above the arrowhead) fits well to 0.011 nm. The asterisk shows where the WLC model fits weakly to the second peak in the curve; in later peaks the fit is accurate. Curves recorded at 0.8 μm/s on a mucilage pad of the marine diatom, T. undulatum.
The maximum energy to stretch a single, unbridged adhesive nanofiber (27 peaks) was 544 × 10−18 J, calculated by numerical integration of the force versus distance curve.
Bridged saw-tooth curves
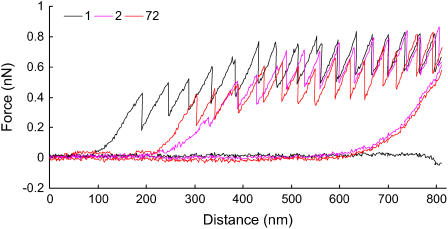
Saw-tooth curves were obtained with the ramp (scan distance) reduced to 800 nm so that the adhesive nanofiber remained bridged between the pad and the tip on successive scans. This allowed the stretched and unfolded adhesive nanofiber to be relaxed before repeating the cycle with the same nanofiber. Successive curves were very similar to each other and superimposable, suggesting that we were observing the successive unfolding and refolding of a single nanofiber bridged between the pad and tip (Fig. 5). Up to 666 scans were recorded on one adhesive nanofiber, with each curve superimposed on parts of the initial curve. The regularity of the curves is shown in Table 1, which presents a range of values, including the consistency in the forces and interpeak distances of the peaks.
FIGURE 5.
Force versus distance retracting (saw-tooth) and advancing (flat) curves for a single bridged adhesive nanofiber. The curves are from the first, second, and seventy-second scans at a single position on a mucilage pad with a live T. undulatum cell still attached. Curves recorded at 0.8 μm/s.
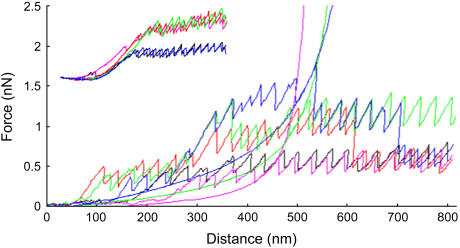
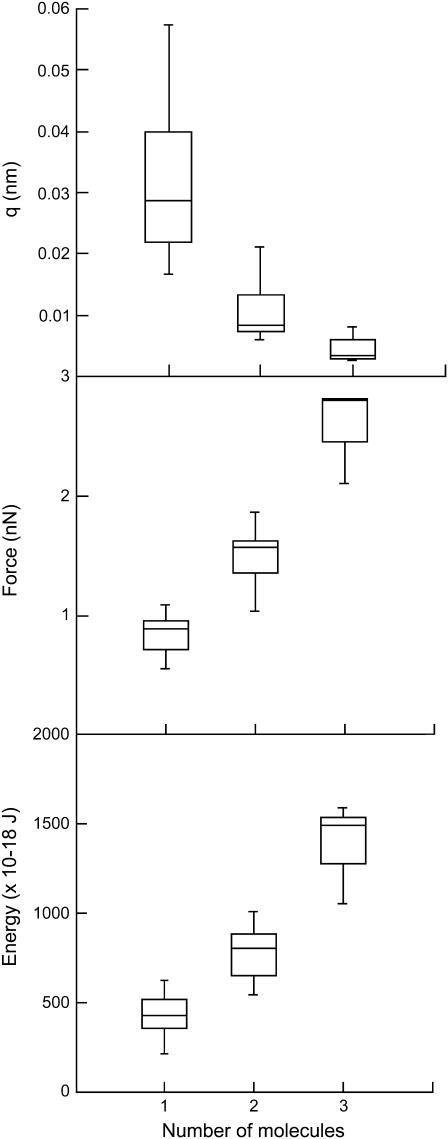
Occasionally, successive scans displayed well-defined saw-tooth curves that were offset to higher cantilever deflection forces. This suggested that multiple nanofibers were bridged between the tip and pad on successive scans (Fig. 6). The maximum force of the saw-tooth peaks was greater when there were more nanofibers bridged. In addition, the persistence length of the polymer, as estimated with the WLC model, reduces in a stepwise fashion with an increasing number of nanofibers attached. In addition, occasional successive curves with a well-defined saw-tooth pattern were recorded successively that overlaid alternatively at one of two (or occasionally three) different forces (Fig. 6, inset). Analysis of these curves revealed that the average force, average persistence length of the last peak, and energy under the curve fell into one of three discrete ranges (Fig. 7). The first curves, which had the lowest force values, also had the lowest energy values and highest persistence length; the second grouping of curves had intermediate force, energy, and persistence length; whereas the highest force curves had the highest energy and lowest persistence length. These data suggested that we were observing the sequential addition of similar adhesive nanofibers to the bridged nanofiber and that the highest force curves had triple the number of nanofibers that the lowest force curves had, whereas the intermediate force curves had double the number present in the lowest curves. This quantization of the saw-tooth retraction forces and persistence lengths is strong support for our contention that the data presented here pertain to single diatom mucilage nanofibers. When more than three nanofibers bound the cantilever, the pull-off curves lost their discrete structure and the saw-tooth pattern disappeared.
FIGURE 6.
Force versus distance retraction curves for three bridged adhesive nanofibers (extension curves not shown for clarity) taken successively at one location on a T. undulatum mucilage pad. Initially (first and second scans; black and magenta, respectively) there is only one nanofiber attached and the curves superimpose, on the third scan (red) a second nanofiber becomes attached to the tip with approximately double the force of the first curve (black) before breaking off at ∼600 nm, on the fourth (green) scan the second nanofiber reattaches along with a third nanofiber (blue) with approximately triple the force of the first curve that breaks off at ∼375 nm, on the fifth scan (blue) the third nanofiber reattaches and breaks off at ∼525 nm, and the second nanofiber then breaks off at ∼700 nm leaving the first nanofiber still attached. Note how the forces and shape of the curves superimpose. The smooth curves represent WLC model fits to the second (magenta), fourth (green), and fifth (blue) curves with persistence lengths (q) of 0.031, 0.016, and 0.008 nm, respectively. (Inset) Force versus distance retracting curves taken successively at one location for two bridged adhesive nanofibers, the curves alternated sequentially between the two discreet force categories. Curves recorded at 0.8 μm/s.
FIGURE 7.
Box plots of average stiffness of the last peak (q; nm) (top), average force (nN) (middle), and energy (E) (bottom) obtained from superimposable, sequential bridged curves (as shown in Fig. 6, inset) with one (n = 37), two (n = 12), or three (n = 3) adhesive nanofibers bridged between the pad and tip. Curves recorded at 800-nm ramp and 0.8-μm/s velocity. Center line = median; box edges = first and third quartiles; whiskers = all values.
Refolding accuracy and rupture forces at varying scan rates
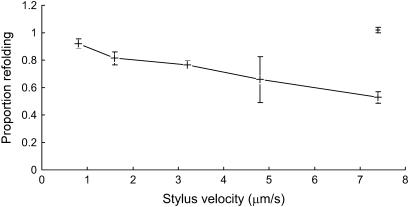
To calculate the degree of refolding when the nanofiber was repeatedly stretched and relaxed, it was assumed that each peak in the force curve represented the unfolding of a domain and that if the same number of peaks were present in subsequent superimposable curves, then all of the domains had repeatedly unfolded and refolded. There was strong evidence to support this view based on how well the curves superimposed (Fig. 5). In addition, there were often microirregularities in particular peaks that were observed in the same peak of all subsequent scans. The refolding of the adhesive nanofiber upon relaxation was calculated by comparing the number of peaks in the first recorded curve with the number of peaks in subsequent curves. This was expressed as a proportion and is presented in Fig. 8, which shows that as the tip velocity is increased the proportion of domains that refold is reduced. Furthermore, when the tip was paused in the extended position for 2 s between scans, all of the domains refolded. These time-resolved data clearly indicate the existence of strong intramolecular bonds for rezipping the stretched or ruptured polymer or proteinaceous components of the adhesive. To completely rezip the ∼30 ruptured domains indicates a zip time of <0.1 s. Such facile bond formation is possible for hydrogen-bonded networks, which have extremely low activation energies.
FIGURE 8.
Plot of the proportion of domains refolding in the second curve of a bridged sequence compared to the number in the first curve, at a range of tip velocities (+) (all at 800-nm ramp, scan rate varied from 0.5 to 4.7 Hz, scanned continuously). In subsequent curves the proportion of peaks remains constant for each velocity. The proportion of domains refolding when the tip is scanned continuously at 7.4 μm/s with a 2-s pause before each retract cycle (−). Error bars = mean ±1 SE.
Proteolytic enzyme activity and cytological staining of pads
Multicycle saw-tooth curves were not observed in K+Si containing 0.5–1 mg/ml of protease. Instead, single-cycle saw-tooth curves were observed. The first three curves of such a sequence (advancing, retracting, advancing) at each x-y location were the same as previously shown in this article and were recorded with approximately the same frequency. However, the second retracting curve was different because no deflection of the cantilever was recorded, indicating that the bridging nanofiber had been cut or damaged in some way after it began to relax (experiment repeated on six T. undulatum pads; data not shown). Normal multicycle curves were again recorded immediately after the protease was flushed out of the dish. Normal multicycle saw-tooth curves were also recorded when BSA was dissolved in the K+Si instead of protease. PAGE showed that BSA was cleaved by the protease when dissolved in K+Si (2- and 3-h digestion; ∼0.05 mg/ml protease), demonstrating that the protease was active in K+Si.
Scanning laser confocal images revealed that both fava bean lectin (VFA, affinity for mannose, glucose, and N-acetyl-d-galactosamine) and jack bean lectin (Con A, affinity for glucose and mannose) bound strongly to the mucilage pad of T. undulatum (Fig. 1), whereas soybean lectin (SBA, affinity for N-acetyl-d-galactosamine) bound very weakly and only in localized areas. Stains-All stained the pads vivid blue, whereas Alcian Blue stained the pad a more translucent blue, indicating the presence of sulfate and/or carboxylic acid groups (data not shown).
DISCUSSION
Single adhesive nanofiber force spectroscopy
Although we do not know the chemical composition of the T. undulatum mucilage pad, and therefore the molecule that we are stretching, we are confident the force curves presented here derive from a modular protein. Other workers have reported regularly spaced saw tooth patterns of force very similar to those reported here (see reviews in Engel et al. and others (2–5,14–16)), and have been described as the “unmistakable fingerprint of a modular protein” (4). Saw-tooth curves arise when a molecule, suspended between the substrate and the tip, resists extension and causes deflection of the cantilever; the tension is released when a force-induced rearrangement increases the length of the molecule or when the molecule detaches from the tip or the substrate. In addition, we have shown that adding a protein cleavage enzyme, protease, to the growth media in which the curves were recorded disrupts the bridging of the adhesive nanofiber at some point after it begins to relax. These results strongly imply that the adhesive nanofiber characterized here is proteinaceous, though it appears to be glycosylated. Staining with a range of standard cytological stains has shown that the T. undulatum mucilage pad contains carbohydrate components.
All reported saw-tooth curves arising from modular proteins have been recorded by adsorbing extracted, purified, or manufactured proteins to a smooth substratum, often mica or gold (see reviews above). This article presents the first clear evidence of force curves arising from the unfolding and refolding of a modular protein taken in situ from a living, native system. Becker et al. (17) reported saw-tooth extension curves arising when a modular protein from an orb spider web was stretched. However, these curves do not have regular interpeak distance or shape, and were not superimposable as recorded here for diatom adhesive mucilage. Similar irregular saw-tooth patterns of force versus distance were recorded from a polymer adhesive in abalone shells (18). The irregularity of these curves may be due to the greater complexity of spider silk and abalone shell polymer adhesive, or greater variability in structure than purified proteins such as titin and synthetic spider silk, for which very regular force spectra were recorded (10,19). There are numerous reports of force curves taken from living cells or other native systems, including diatoms (20–25), seaweed spores (26), bacteria (27), yeast (28,29), and fungi (30), some of which represent single molecules but none that show the precise unfolding and refolding described in this article.
In addition to modular proteins, there are other conceptual models that could explain the rupture peaks observed on the stretching cycle, e.g., desorption of regularly spaced adhesive domains along a polymer chain from a solid substratum (15), or unbinding of the mucilage from the tip. However, unlike the modular protein model, it is difficult to explain the observed rapid refolding upon relaxation with these alternative models.
Nanostructure of the adhesive nanofiber
While we observe the fingerprint of modular proteins and quantization in both the force and persistence length it is difficult to suggest that this is a single-molecule event primarily due to the significantly small persistence lengths and high rupture forces compared to previous work (values are typically 0.2–0.4 nm and 100–300 pN, respectively, for single molecules). Alternatively, we propose that the curves reported here are from single adhesive nanofibers, made up of a set number of modular protein molecules acting as a cohesive unit. We are confident that we can distinguish when multiple adhesive nanofibers are attached. Firstly, there is extreme reproducibility over many successive curves. The repeated stretching of the adhesive nanofiber produces retraction curves that superimpose, often for several hundred cycles, indicating it derives from the same adhesive nanofiber and from the same mechanical processes within. The reproducibility also clearly demonstrates that bond rupture is reversible, and is an integral aspect of the nanofiber function. Secondly, the unfolding process often leaves small irregularities within the curve that can be seen in sequential curves and these serve as a signature. Such irregularities are likely to be the result of misfolding caused by irregularities in the adhesive nanofiber. Both of these arguments assume that accurate refolding can only occur when there is a single adhesive nanofiber attached, but this is not always the case. Regular refolding was occasionally observed in our study with forces that were greater than those typical for a single adhesive nanofiber. In such cases, we were able to determine that more than one adhesive nanofiber was attached to the cantilever at the same time (see quantized forces and persistence lengths in Fig. 7). Bemis et al. (31) and Kellermayer et al. (32) observed a similar relationship where the observed force increased in proportion to the number of chains stretched in parallel while the persistence lengths, derived with the WLC model, decreased giving rise to a multimodal distribution of persistence lengths. Therefore, it is likely that the adhesive nanofiber that we are stretching is made up of multiple chains. Other studies of biomolecules have recorded low persistence lengths. Diatom adhesive strands stretched by AFM gave an average persistence length of 0.006 nm, which the authors reasoned was the result of extending a thick, multistranded filament (23). Thompson et al. (33) reported a persistence length for collagen of 0.03 nm derived from poor WLC model fits to force versus distance curves. They describe such a low persistence length as “unphysical” and reasoned that it must derive from several molecules in parallel. Their curves have a saw-tooth character, but they are not precise or regular, suggesting the absence of precisely folded domains. It is likely that the force versus distance curves reported here also arise from the stretching of multiple polymer chains aligned in parallel. However, multiple molecules would not generate the precise saw-tooth patterns presented here unless they were unfolding in precise synchrony with each other. Therefore, it is most likely that the adhesive nanofiber of T. undulatum is a cohesive unit composed of multiple modular proteins aligned in parallel and functioning in synchrony.
The results presented here show that the adhesive nanofiber is comprised of at least two portions: 1), an ∼200-nm-long section that is not folded or restricted in any way and unravels without deflecting the cantilever, and 2), a stiff backbone section consisting of up to 27 folded domains. When stretched, the domains in the adhesive nanofiber unfold, each increasing the overall length by ∼34 nm, allowing the adhesive nanofiber to be extended to a distance much greater than when in its relaxed state. We interpret the variable number of peaks in each force versus distance curve to indicate that the adhesive nanofiber adheres to the tip at random points along its length and therefore has numerous adhesive functional groups. Because the first peak of each of the curves is clustered tightly around 200 nm, regardless of overall adhesive nanofiber length, it is likely that the 200-nm section is located near the anchor point (which could be the cell, pad matrix, or substratum). This base anchor section probably ensures that the adhesive trawls well away from its parent surface, so that the adhesive adheres to other foreign surfaces, rather than itself or other strands. An alterative explanation for this 200-nm-long section is that this is the distance the folded adhesive nanofiber can be stretched before the more tightly bound domains begin to unfold. However, if this were the case, we would expect a reduction in the length of the loose section proportional to the reduction of the overall unfolded adhesive nanofiber length, which was not apparent (Fig. 3). Our argument assumes the adhesive nanofibers unfold to their maximum length without desorbing from the tip.
Physical properties of the adhesive nanofibers
The WLC model highlights a subtle discontinuity in the slope of the initial rising part of the saw-tooth curve and the first tooth (Fig. 4). A similar observation has been made by Marszalek et al. (9) who reported a “hump” in the force versus extension curve leading to the unfolding of titin. It was demonstrated that the hump is caused by the rupture of a pair of hydrogen bonds in each domain increasing the overall length of the protein before the complete rupture of the first domain. We propose a similar explanation where the initial rising part of the curve represents a force-induced rearrangement of the folded portion of the adhesive nanofiber as tension is applied. This is followed by the peak of the first saw-tooth curve, which corresponds to the full unfolding of the domain. This initial rearrangement of the nanofiber is only observed on the first peak because the extra chain released upon rupture of each fold (2–4 nm; data not shown) is not long enough to allow the cantilever to return to near-zero deflection, the nanofiber therefore remains under tension.
Oberhauser et al. (34) were the first to propose that the unfolding of a modular protein (tenascin) played an important role in preserving the lifetime of a bond over long extensions. Since then, there have been numerous AFM studies that report molecules/substances that exhibit sacrificial bond rupture and reforming behavior when successively stretched and relaxed as described here. Those studies reported that most bonds reform after time periods from a few seconds up to one minute (17,33–36), including one of a diatom mucilage that showed some healing after 30 s (22). In T. undulatum, the mucilage bond reforming occurs rapidly. Ninety-two percent of bonds reform when scanned continuously at 0.8 μm/s; this reduces to 53% at 7.4 μm/s. All bonds reform when scanning is paused for 2 s between successive scans. This indicates strength is restored much more rapidly in the T. undulatum adhesive nanofiber than in other reported substances.
The energy required to extend the T. undulatum adhesive nanofiber is greater than the energy dissipated in successive stretching cycles of other molecules. The energy required to stretch the unbridged adhesive nanofiber ranged between 109 and 544 × 10−18 J and 220–631 × 10−18 J for bridged adhesive nanofibers arbitrarily restricted to 800 nm; in successive bridged curves this value remained constant. The energy dissipated in the stretching of abalone nacre is in the order of 4–10 × 10−18 J per cycle (18); and for the stretching of collagen it is 2–20 × 10−18 J per cycle (33). The energy required to stretch the T. undulatum adhesive nanofiber did not decrease with subsequent stretch cycles, indicating that the number of bridged modular proteins did not change between cycles and that a fixed number of these proteins comprised a cohesive nanofiber.
The diatom adhesive nanofiber
Because “fly fishing” on the T. undulatum mucilage pad results in adhesion to the adhesive nanofiber, the adhesive nanofiber must be very sticky. We also know that it is freely diffusing well above the actual diatom surface. During fly fishing, the Si3N4 tip is brought into contact with the mucilage without applying a detectable force, <5 pN, and without pausing. Another study of diatom mucilage also recorded adhesion without the tip being paused or pushed into the mucilage (25). In contrast, other force spectroscopy studies of modular proteins usually report adsorption to the tip only when it is pushed into the polymer/protein of interest and held there for a period of time (several seconds up to a minute is needed to achieve sufficient binding) (15). Studies have quantified the adhesive forces of diatom mucilage. Higgins et al. (24) report irregular saw-tooth curves from the stretching of single attachment strands arising from the raphe of live raphid diatoms, with mean adhesive forces of 0.197 ± 0.097 (mean ± SD) nN, with a maximum value of 0.535 nN (using a Si3N4 tip). Those values are lower than reported here, suggesting the T. undulatum pad contains a stronger adhesive. Gebeshuber et al. (22) also report force curves with an irregular saw-tooth pattern that were recorded in native conditions on the mucilage footprint left behind after the physical removal of a benthic, freshwater diatom. The forces recorded were up to 3 nN with extension lengths of up to 5 μm. When repeat curves were taken with the same bridging mucilage, they recorded subsequent irregular saw tooth peaks that were significantly reduced with each successive curve until, after five curves, no interaction was observed. Saw-tooth curves were only recorded in subsequent curves if there was a pause of at least 30 s between scans, suggesting a time-dependent self-healing property in the mucilage. The irregular shape of these curves and the large separation distances and forces involved suggest that multiple molecules were attached to the tip in these experiments. By contrast, the adhesive nanofibers of T. undulatum show extremely efficient self-healing properties. After adhesion to the tip, the nanofibers were stretched up to 1.2 μm and precisely refolded into their native conformation upon relaxation, a process that occurred reproducibly for several hundred cycles.
These microscale observations made on the T. undulatum adhesive nanofibers agree very well with direct observations of T. undulatum cells. When cells make first contact with a surface they adhere instantly (usually lying on their side). After a period (a few minutes to a few hours) the cells stand erect in a mucilage pad and sway from side to side when exposed to very gentle water currents. In stronger currents, they bend over and lay flat until the flow ceases. This flexibility makes the cells very difficult to detach from the substratum. The adhesive required to achieve this would therefore need to be both strong and flexible, precisely the characteristics of the adhesive nanofiber. The nanostructure of this adhesive fits precisely with the requirements of a “strong” and “tough” molecule as defined by Smith et al. (18). The properties of short and stiff molecules (represented by the individual domains, i.e., “strong”) are combined with the properties of long flexible molecules (represented by many of these domains in series; i.e., “tough”). According to this model, when the molecule is stretched, resistance will rise rapidly to forces approaching that required to break strong polymer backbone bonds (∼1 nN), but a domain unfolds avoiding the breaking of the backbone and at the same time increasing the energy required to extend the molecule. These intermediate strength bonds (0.1–0.7 nN) are stronger than individual hydrogen or van der Waals bonds but weaker than covalent bonds. Our results fit with the above model very well (except we are stretching units of cohesive molecules).
Acknowledgments
The authors thank two anonymous referees for providing advice that improved the manuscript considerably. We also thank John Lewis from Defense Science and Technology Organization of the Australian Department of Defense for valuable discussions and technical support. T.D. thanks Paul Molino for helping with the confocal laser scanning microscope.
The authors thank the Australian Research Council and our industry partner Akzo Nobel, Gateshead, UK for funding (Industry Linkage grant No. LP0454982). We also thank the Defense Science and Technology Organization of the Australian Department of Defense for financial assistance. R.D. thanks the National Science Foundation (grant No. INT0202675).
References
- 1.Kooistra, W. H. C. F., M. De Stefano, D. G. Mann, N. Salma, and L. K. Medlin. 2003. Phylogenetic position of Toxarium, a pennate-like lineage within centric diatoms (Bacillariophyceae). J. Phycol. 39:185–197. [Google Scholar]
- 2.Engel, A., H. E. Gaub, and D. J. Muller. 1999. Atomic force microscopy: a forceful way with single molecules. Curr. Biol. 9:133–136. [DOI] [PubMed] [Google Scholar]
- 3.Engel, A., and D. J. Muller. 2000. Observing single biomolecules at work with the atomic force microscope. Nat. Struct. Biol. 7:715–718. [DOI] [PubMed] [Google Scholar]
- 4.Fisher, T. E., P. E. Marszalek, and J. M. Fernandez. 2000. Stretching single molecules into novel conformations using the atomic force microscope. Nat. Struct. Biol. 7:719–723. [DOI] [PubMed] [Google Scholar]
- 5.Fisher, T. E., A. F. Oberhauser, M. Carrion-Vazquez, P. E. Marszalek, and J. M. Fernandez. 1999. The study of protein mechanics with the atomic force microscope. Trends Biochem. Sci. 24:379–384. [DOI] [PubMed] [Google Scholar]
- 6.Best, R. B., D. J. Brockwell, J. L. Toca-Herrera, A. W. Blake, D. A. Smith, S. E. Radford, and J. Clarke. 2003. Force mode atomic force microscopy as a tool for protein unfolding studies. Anal. Chim. Acta. 47:87–105. [Google Scholar]
- 7.Dufrene, Y. F. 2004. Using nanotechnologies to explore microbial surfaces. Nat. Rev. Microbiol. 2:451–460. [DOI] [PubMed] [Google Scholar]
- 8.Carrion-Vazquez, M., A. F. Oberhauser, S. B. Fowler, P. E. Marszalek, S. E. Broedel, J. Clarke, and J. M. Fernandez. 1999. Mechanical and chemical unfolding of a single protein: a comparison. Proc. Natl. Acad. Sci. USA. 96:3694–3699. [DOI] [PMC free article] [PubMed] [Google Scholar]
- 9.Marszalek, P. E., H. Lu, H. Li, M. Carrion-Vazquez, A. F. Oberhauser, K. Schulten, and J. M. Fernandez. 1999. Mechanical unfolding intermediates in titin molecules. Nature. 402:100–103. [DOI] [PubMed] [Google Scholar]
- 10.Oroudjev, E., J. Soares, S. Arcidiacono, J. B. Thompson, S. A. Fossey, and H. G. Hansma. 2002. Segmented nanofibers of spider dragline silk: atomic force microscopy and single-molecule force spectroscopy. Proc. Natl. Acad. Sci. USA. 99:6460–6465. [DOI] [PMC free article] [PubMed] [Google Scholar]
- 11.Andersen, R. A., D. M. Jacobson, and J. P. Sexton. 1991. Provasoli-Guillard Center for Culture of Marine Phytoplankton: Catalogue of Strains. Provasoli-Guillard Center for Culture of Marine Phytoplankton, West Boothbay Harbor, ME.
- 12.Hutter, J. L., and J. Bechhoefer. 1993. Calibration of atomic force microscope tips. Rev. Sci. Instrum. 64:3342–3342. [Google Scholar]
- 13.Rief, M., F. Oesterhelt, B. Heymann, and H. Gaub. 1997. Single molecule force spectroscopy on polysaccharides by atomic force microscopy. Science. 275:1295–1297. [DOI] [PubMed] [Google Scholar]
- 14.Fisher, T. E., M. Carrion-Vazquez, A. F. Oberhauser, H. Li, P. E. Marszalek, and J. M. Fernandez. 2000. Single molecule force spectroscopy of modular proteins in the nervous system. Neuron. 27:435–446. [DOI] [PubMed] [Google Scholar]
- 15.Hugel, T., and M. Seitz. 2001. The study of molecular interactions by AFM force spectroscopy. Macromol. Rapid Commun. 22:989–1016. [Google Scholar]
- 16.Zhuang, X., and M. Rief. 2003. Single-molecule folding. Curr. Opin. Struct. Biol. 13:88–97. [DOI] [PubMed] [Google Scholar]
- 17.Becker, N., E. Oroudjev, S. Mutz, J. P. Cleveland, P. Hansma, C. Y. Hayashi, D. E. Makarov, and H. G. Hansma. 2003. Molecular nanosprings in spider capture-silk threads. Nat. Mater. 2:278–283. [DOI] [PubMed] [Google Scholar]
- 18.Smith, B. L., T. E. Schaffer, M. Viani, J. B. Thompson, N. A. Fredrick, J. Kindt, A. Belcher, G. D. Stucky, D. E. Morse, and P. K. Hansma. 1999. Molecular mechanistic origin of the toughness of natural adhesives, fibres and composites. Nature. 399:761–763. [Google Scholar]
- 19.Rief, M., M. Gautel, F. Oesterhelt, J. M. Fernandez, and H. E. Gaub. 1997. Reversible unfolding of individual titin immunoglobulin domains by AFM. Science. 276:1109–1112. [DOI] [PubMed] [Google Scholar]
- 20.Crawford, S. A., M. J. Higgins, P. Mulvaney, and R. Wetherbee. 2001. Nanostructure of the diatom frustule as revealed by atomic force and scanning electron microscopy. J. Phycol. 37:543–554. [Google Scholar]
- 21.Gebeshuber, I. C., J. H. Kindt, J. B. Thompson, Y. Del Amo, H. Stachelberger, M. A. Brezezinski, G. D. Stucky, D. E. Morse, and P. K. Hansma. 2003. Atomic force microscopy of living diatoms in ambient conditions. J. Microsc. 212:292–299. [DOI] [PubMed] [Google Scholar]
- 22.Gebeshuber, I. C., J. B. Thompson, Y. Del Amo, H. Stachelberger, and J. H. Kindt. 2002. In vivo nanoscale atomic force microscopy investigation of diatom adhesive properties. Mater. Sci. Technol. 18:763–766. [Google Scholar]
- 23.Higgins, M. J., S. A. Crawford, P. Mulvaney, and R. Wetherbee. 2002. Characterisation of the adhesive mucilages secreted by live diatom cells using atomic force microscopy. Protist. 153:25–38. [DOI] [PubMed] [Google Scholar]
- 24.Higgins, M. J., P. Molino, P. Mulvaney, and R. Wetherbee. 2003. The structure and nanomechanical properties of the adhesive mucilage that mediates diatom: substratum adhesion and motility. J. Phycol. 39:1181–1193. [Google Scholar]
- 25.Higgins, M. J., J. E. Sader, P. Mulvaney, and R. Wetherbee. 2003. Probing the surface of living diatoms with atomic force microscopy: the nanostructure and nanomechanical properties of the mucilage layer. J. Phycol. 39:722–734. [Google Scholar]
- 26.Callow, J. A., S. A. Crawford, M. J. Higgins, P. Mulvaney, and R. Wetherbee. 2000. The application of atomic force microscopy to topographical studies and force measurements on the secreted adhesive of the green alga Enteromorpha. Planta. 211:641–647. [DOI] [PubMed] [Google Scholar]
- 27.Camesano, T. A., and N. I. Abu-Lail. 2002. Heterogenity in bacterial polysaccharides, probed on a single molecule basis. Biomacromolecules. 3:661–667. [DOI] [PubMed] [Google Scholar]
- 28.Benoit, M., D. Gabriel, G. Gerisch, and H. E. Gaub. 2000. Discrete interactions in cell adhesion measured by single-molecule force spectroscopy. Nat. Cell Biol. 2:313–317. [DOI] [PubMed] [Google Scholar]
- 29.Touhami, A., B. Hoffmann, A. Vaslla, F. A. Denis, and Y. F. Dufrene. 2003. Aggregation of yeast cells: direct measurements of discrete lectin-carbohydrate interactions. Microbiology. 149:2873–2878. [DOI] [PubMed] [Google Scholar]
- 30.van der Aa, B. C., M. Asther, and Y. F. Dufrene. 2001. Surface properties of Aspergillus oryzae spores investigated by atomic force microscopy. Colloids Surf. B Biointerfaces. 24:277–278. [Google Scholar]
- 31.Bemis, J. E., B. B. Akhremitchev, and G. C. Walker. 1999. Single polymer chain elongation by atomic force microscopy. Langmuir. 15:2799–2805. [Google Scholar]
- 32.Kellermayer, M. S. Z., S. B. Smith, H. L. Granzier, and C. Bustamante. 1997. Folding-unfolding transitions in single titin molecules characterized with laser tweezers. Science. 276:1112–1116. [DOI] [PubMed] [Google Scholar]
- 33.Thompson, J. B., J. H. Kindt, B. Drake, H. G. Hansma, D. E. Morse, and P. K. Hansma. 2001. Bone indentation recovery time correlates with bond reforming time. Nature. 414:773–776. [DOI] [PubMed] [Google Scholar]
- 34.Oberhauser, A. F., P. E. Marszalek, H. P. Erickson, and J. M. Fernandez. 1998. The molecular elasticity of the extracellular matrix protein tenascin. Nature. 393:181–185. [DOI] [PubMed] [Google Scholar]
- 35.Lenne, P.-F., A. J. Raae, S. M. Altmann, M. Saraste, and J. K. H. Horber. 2000. States and transitions during forced unfolding of a single spectrin repeat. FEBS Lett. 476:124–128. [DOI] [PubMed] [Google Scholar]
- 36.Furuike, S., T. Ito, and M. Yamazaki. 2001. Mechanical unfolding of single filamin A (ABP-280) molecules detected by atomic force microscopy. FEBS Lett. 498:72–75. [DOI] [PubMed] [Google Scholar]


