Abstract
A fast and precise method for detergent concentration determination is presented. (Patent applications for the method described here have been submitted (EP05011904 and US60/702,261). Depending on the interest of the scientific community, the system will be commercialized. (For further information contact Hervé-W. Rémigy at the e-mail address below.) A small droplet of the detergent solution is deposited on a piece of Parafilm M and side views are recorded by two orthogonally arranged TV cameras. The droplet contours are then approximated by ellipses to determine the contact angles. Comparison of the observed contact angle values to calibrated standard curves of known detergent concentrations gives the concentration of the detergent assessed. A range of commonly used detergents was studied to demonstrate the reproducibility and precision of this simple method. As a first application, the detergent binding capacity of the Escherichia coli galactose/proton symporter (GalP) was assessed. Aggregation of GalP was observed when <260 ± 5 dodecyl-β,D-maltoside molecules were bound to one GalP molecule. These measurements document the efficacy of the drop-shape based detergent concentration determination described.
INTRODUCTION
Knowing the exact detergent concentration is an important prerequisite for working with solubilized membrane proteins. Protein purification steps such as affinity chromatography and procedures to increase the protein concentration can affect the detergent concentration (1), and high detergent concentrations can induce loss of the quaternary and tertiary protein structure. Moreover, the kinetics of detergent removal during reconstitution and two-dimensional (2D) crystallization of membrane proteins is strongly dependent on the initial detergent concentration (2–4), and three-dimensional (3D) crystallization may depend on the amount of detergent present (5,6). Therefore, the detergent concentration needs to be accurately measured. Although quite a few methods exist for the determination of detergent concentrations, they are impractical for many routine applications. They include the use of radiolabeled detergents (7), Fourier transform infrared spectroscopy (8), quantitative thin-layer chromatography (9), analytical ultracentrifugation (10,11), equilibrium column desorption (1), a modified phenol-sulfuric acid assay (12) to measure sugar moieties of some detergents (13), the falling drop method, and the sitting drop method (14). All these methods are in general slow and often require large sample volumes to obtain accurate results, making them unsuitable for routine measurements. The related time-loss may be critical for membrane proteins, which are often destabilized by exposure to detergents.
Detergents reduce the surface tension of any aqueous solution by partitioning to the air-water interface. This disturbs the ordered arrangement of water molecules at the surface and diminishes the force of attraction between them. The surface tension is steadily reduced until the critical micellar concentration (cmc) is reached. Above this point the concentration of free (monomeric) detergent molecules in solution does not further increase, because addition of more detergent results in the formation of micelles. Here we take advantage of the intrinsic surface activity of detergents to set up a device for their concentration determination.
As a first application we have studied the behavior of the Escherichia coli galactose/proton symporter (GalP) solubilized in dodecyl-β,D-maltoside. The method allowed the detergent binding capacity of GalP and its related aggregation behavior to be determined quickly and with excellent accuracy.
MATERIALS AND METHODS
Construction of the contact angle measuring device
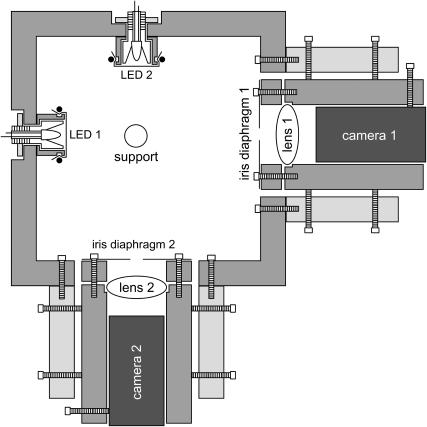
A box (Fig. 1) made of standard PVC holds two cameras with their optics (including iris diaphragms made of aluminum) and a plexiglass cylinder for depositing the drop. C-MOS black and white camera modules with a resolution of 628 pixels horizontally times 582 pixels vertically have been purchased from Conrad (Hirschau, Germany). Biconvex lenses with a focal length of 25.4 mm and f-No. 1 purchased from Thorlabs (Grünberg, Germany) magnify the drop image. The two cameras acquire side views of the drop from orthogonal directions to detect drop asymmetry. Two frame grabber cards (Brooktree BT 848 chipset based acquisition cards) control the image acquisition. The diffuse illumination of the droplet is achieved by Teflon tape covered LEDs (standard 5 mm round white 60 mW LED) mounted opposite to the cameras. To ensure reproducible surface properties for each measurement, a fresh piece of Parafilm M was mounted on the plexiglass support using double-sided tape (Scotch 665, 12.7 mm).
FIGURE 1.
Schematic drawing showing the setup of the contact angle measuring device.
The image analysis software was programmed in C under the GNU general public license (for further information, see http://www.gnu.org/copyleft/gpl.html). The ellipsoid approximation is achieved by GNUPLOT and the results are displayed using XVIEW.
Characterization of the substrate
The substrate in this study was Parafilm M and is a product of Pechiney Plastic Packaging (Chicago, IL). Atomic force microscopy (AFM) measurements were performed in air using a Nanoscope III microscope equipped with an infrared laser head and oxide-sharpened silicon nitride cantilevers of 200 μm length and a nominal spring constant of 0.06 N/m from Veeco Metrology (Santa Barbara, CA). Topographs were acquired in contact mode at minimal loading forces (≤100 pN). Line frequencies ranged between 4.1 and 5.5 Hz. Surface roughness calculations were performed using the analyze/roughness subroutine in the Nanoscope software package (v5.12r2). The Parafilm was fastened by double-sided tape (Scotch 665, 12.7 mm) on a ferromagnetic steel disc with a glued-on Teflon disc.
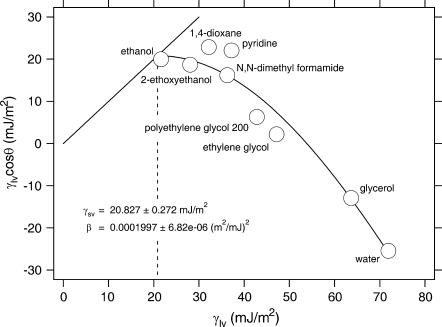
The solid surface tension (γsv) of Parafilm was determined by the equation of state approach (15–17) from the experimentally determined contact angles of different liquids with known surface tension values (γlv). The liquids used were water, glycerol, ethylene glycol, polyethylene glycol 200, pyridine, N,N-dimethyl formamide, 1,4-dioxane, 2-ethoxyethanol, and ethanol. The corresponding surface tensions at 26°C are 71.89 mJ/m2, 63.64 mJ/m2, 47.17 mJ/m2, 42.80 mJ/m2, 37.18 mJ/m2, 36.26 mJ/m2, 32.17 mJ/m2, 28.05 mJ/m2, and 21.60 mJ/m2, respectively (18). Experimental contact angle values were used in conjunction with the following equation of state (16):
 |
(1) |
where γlv and γsv are the interfacial tensions of the liquid-vapor and solid-vapor interfaces, respectively, ϑ is the Young contact angle as defined by Young's equation,
 |
(2) |
and β is a fit parameter.
Calibration of the detergents
The detergents used in this study were octyl-β,D-glucoside (OG), octyl-β,D-thioglucoside (OTG), decyl-β,D-maltoside (DM), dodecyl-β,D-maltoside (DDM), CYMAL-5, dodecyl-N,N-dimethylamine-N-oxide (LDAO), nonaethylene glycol monododecyl ether (C12E9), N-dodecylphosphocholine (FOSCh12), which all were purchased from Anatrace (Maumee, OH), Triton X-100 (TX-100) and octyltrimethylammonium bromide (OTAB) from Sigma-Aldrich (St. Louis, MO), 3[(3-cholamidopropyl) dimethyl-ammonio] propanesulfonic acid (CHAPS) from Dojindo Molecular Technology (Gaithersburg, MD) and sodium dodecyl sulfate (SDS) from Bio-Rad Laboratories (Hercules, CA). All detergents were of high purity grade (≥98%) and were used without further purification. Aqueous solutions of these detergents in the range of 0–7.5 × cmc were prepared by dilution from the corresponding stock solutions (15× cmc) with reagent-grade water produced by a Milli-Q filtration system (>18 MΩ). The pipetted volumes were weighed on a balance (Mettler AE50) purchased from Mettler-Toledo (Greifensee, Switzerland). One calibration curve represents the mean of three measured curves for each detergent. The cmc's were determined from the intersection of a third polynomial fit to the descending part of the curve and a linear fit to the plateau.
Comparison with radioactively labeled DDM
The concentration of radiolabeled [14C]DDM (a generous gift from J. L. Rigaud) was determined by liquid scintillation counting using a Packard Tricarb 2000 CA (Canberra-Packard, Zürich, Switzerland). These concentrations were plotted against measured contact angles (see Fig. 5).
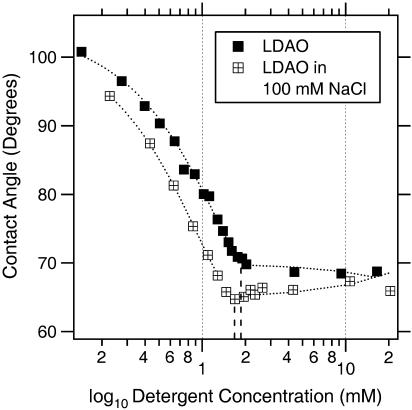
FIGURE 5.
Influence of the ionic strength on the properties of LDAO at pH 7.9. By adding 100 mM NaCl to the calibration standards, the cmc drops from 1.9 mM to 1.7 mM and the contact angle is decreased from 70° to 65°, giving evidence for a higher surface excess in the latter case.
Purification of the galactose/proton symporter of E. coli
1.5 ml membranes from E. coli strain JM1100 (pPER3) overexpressing GalP (kindly provided by P.J.F. Henderson) were resuspended in 13.5 ml solubilization buffer (20 mM Tris pH 8.0, 300 mM NaCl, 20% (v/v) glycerol, 20 mM imidazole). Solubilization was achieved at 4°C within 2 h after addition of 1% (w/v) DDM as powder. The solubilization mixture was centrifuged at 4°C and 150,000 × g to remove all unsolubilized material. 3.2 ml Ni-NTA agarose slurry were preequilibrated using wash buffer without detergent (20 mM Tris pH 8.0, 20 mM imidazole) and then incubated overnight at 4°C with the solubilized membranes. The column binding mixture was partitioned between eight columns, which were washed with 20 ml (100 times column volume) wash buffer containing different concentrations of DDM (0.001:0.003:0.005:0.006:0.008:0.011:0.022:0.043% (w/v)). The quasi totality of the wash buffers was removed by suction. As a control, the same experiment was performed without protein, ruling out the possibility of detergent retention/accumulation by the column material (data not shown). Elution was achieved by immediate incubation with 250 μl of elution buffer (200 mM imidazole pH 8.0 containing different concentrations of DDM (see washes)) for 1 h and subsequent centrifugation at 4°C. The weight of the column resin and the volumes of elution buffer added and recovered were determined and taken into account in the calculations for the protein yield. Protein concentrations were determined using the Bio-Rad protein assay from Bio-Rad Laboratories, correcting for the presence of DDM after calibration of the assay with BSA/DDM mixtures of different concentrations. The amount of DDM bound to GalP was determined by calculating the difference between the DDM concentration in the loaded elution buffers and the DDM concentration in the eluted samples. This was possible assuming that total detergent concentrations are measured. Additionally it was assumed that the same monomeric and micellar detergent concentrations were present in the eluted samples as in the corresponding elution buffers and therefore the differences in detergent concentrations were due to detergent brought along by the protein. For the measurements the eluted samples had to be diluted typically between 50 and 100 times to release the detergent from the protein, which precipitated out of solution.
RESULTS
Contact angle measurements
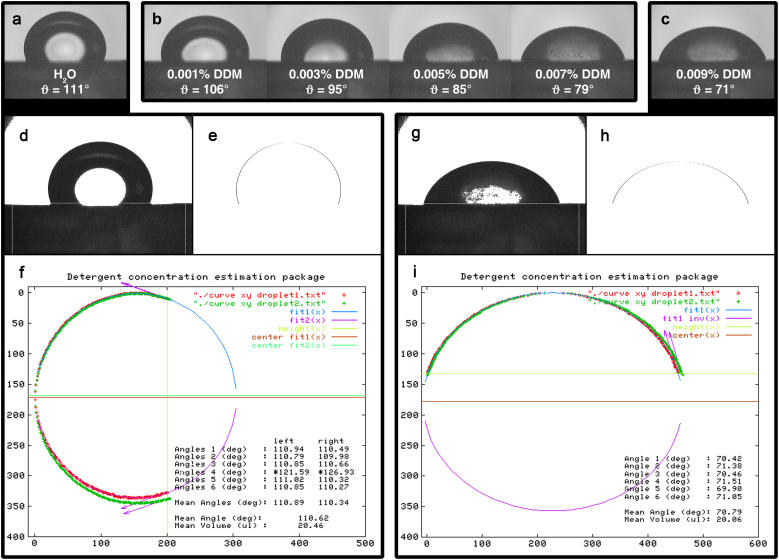
A 20-μl droplet is gently deposited onto a piece of Parafilm M fastened on the support. After 30 s each camera records three images, which are independently processed. Characteristic drop shapes are displayed in Fig. 2, a–c, whereas the processing steps are documented for two typical drops in Fig. 2, d–i. The software analyzes the drop images in three steps: First, a threshold is applied to determine the drop contour (Fig. 2, d and g). Second, the droplet is cut out according to a predefined frame including the baseline. The coordinates of the contour (Fig. 2, e and h) are extracted to an xy coordinates file and used to calculate the drop volume. Third, an ellipse is fitted to the contour. Initial fit parameters such as the width and height of the droplet are read out from the xy coordinates file. If, based on the preliminary approximation values, the contact angle is expected to be >90°, the contour will be treated as two independent halves to solve the ellipsoid equation (see Fig. 2, f and i). As a consequence, angles >90° will have separate values for the left and the right contact angle (Fig. 2 f). The elliptical fitting of the contour is then performed and terminated when the relative difference between the last two fitting cycles is <10−11. The contact angles are obtained by calculating the ellipse tangent at the intersection with the baseline. At the end the mean angle and the volume are calculated and the results together with the contours of the droplet are plotted in a graph, enabling the user to decide whether the fit should be included into the data set of measurements. When contact angles determined from the orthogonal images differ more than ± 5% the values are not taken into account for the mean angle calculation, thereby ensuring that the droplet is sufficiently symmetric or that the image does not exhibit any electronic noise or baseline uncertainty.
FIGURE 2.
Image analysis procedure. (a–c) Raw images of the droplet series for DDM. (d and g) Pictures a and c respectively, with applied threshold. (e and h) Extracted droplet contours. (f and i) Output file from GNUPLOT displaying contact angles and mean volume. Note: In f, the contour has been rotated by 90° with respect to e.
Characterization of Parafilm M
To assess the surface roughness of Parafilm M atomic force microscopic (AFM) measurements were carried out. Table 1 summarizes the different values for the averaged roughness (Ra) and the root mean-squared roughness (Rms or Rq) obtained at different scan sizes. The main difference between the two values is that the Rms is sensitive to extreme peaks or valleys, whereas Ra averages them out. Ra has been designated by the International Standards Organizations (ISO) as standard for characterizing the roughness of a machined surface. Images were recorded on three individual pieces of Parafilm and different regions for scanning were chosen arbitrarily. The resulting differences in the roughness are within a range of ∼10–15 nm as documented by the standard deviations. The experimentally determined value of 60 ± 17 nm for the Rms (see Table 1) at a frame size of 20 μm compares well with a previously published value of 42–51 nm (19).
TABLE 1.
Surface roughness analysis of Parafilm M
| Scan size (μm × μm) | 20 × 20 | 10 × 10 | 5 × 5 | 1 × 1 |
|---|---|---|---|---|
| Number of images* | 9 | 11 | 8 | 8 |
| Root mean-square Rms or Rq ± SD (nm) | 60 ± 17 | 33 ± 15 | 14 ± 9 | 3 ± 5 |
| Roughness average Ra ± SD (nm) (ISO) | 40 ± 8 | 24 ± 10 | 10 ± 6 | 2 ± 3 |
Images have been taken from three individual pieces of Parafilm and different regions.
The solid surface tension of Parafilm M was determined to be 20.8 mJ/m2 (Fig. 3) reflecting its hydrophobic character. Parafilm consists mainly of polyolefins and paraffin waxes; the exact composition, however, has not been released by the manufacturer. Literature values for the surface energy of paraffin waxes range from 23 to 25 mJ/m2, that of polyolefins are much more diverse, depending on their functionalization. They can range from 18 mJ/m2 for polytetrafluoroethylene to 31 mJ/m2 for polyethylene (see, e.g., Myers; Janczuk et al. (20,21)).
FIGURE 3.
γlv cosϑ as a function of the surface tension γlv of various liquids for Parafilm M. The 45° line, γlv cosϑ = γlv, i.e., the limiting condition ϑ = 0, is also shown on the graph. The surface energy of Parafilm is given by the intersection between the two lines.
Calibration of the detergents
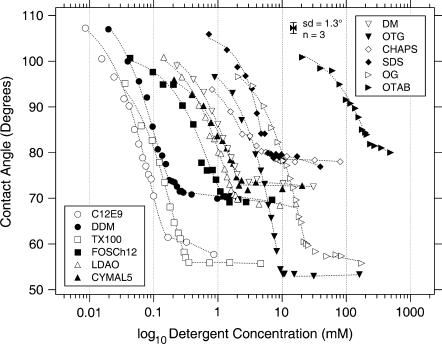
As can be seen from Fig. 4 all calibration curves exhibit the same shape characteristics. The contact angle gradually decreases with increasing detergent concentration until a plateau is reached with a sharp break. The cmc is the concentration where the break occurs and after which there is no further significant reduction in the contact angle.
FIGURE 4.
Semilogarithmic plot of the detergent concentration versus experimental contact angles for all calibrated detergents.
There are clear differences in the amount of surface tension reduction between the different detergents (vertical shift on the graph). The degree of surface tension reduction seems to mainly depend on the properties of the headgroup. In particular, the surface excess, i.e., the number of detergent molecules covering the surface, predominates the surface tension lowering effect. Nonionic detergents (see “ϑ @ cmc” in Table 2) are more efficient in reducing the surface tension than charged ones (OTAB/SDS). Charged detergents seem to have a limited capacity to adsorb to the air-water interface due to repulsion between equally charged species. Since the N-O bond in the headgroup of LDAO has a polar character, it exhibits an intermediate behavior. Depending on the pH LDAO is present as nonionic (pH ≥ 7) or cationic (pH ≤ 3) species, accompanied by a significant increase in the cmc for the latter (22). Additionally, it has been shown that the cmc of cationic LDAO strongly depends on the ionic strength of the aqueous solution (23). For ionic surfactants this is a known influence mainly due to electrostatic interactions of the counterions with the charged headgroups. Interestingly the addition of NaCl also affects the cmc and the adsorption behavior of the nonionic species (Fig. 5). Even though this has been reported for nonionic detergents, such as polyoxyethylene derivatives (24) and others (25), the observed effect on LDAO is considerably larger and cannot only be explained by the salting out effect, i.e., the dehydration (22,23). It is most likely that additionally, partial charges in the amine oxide group get shielded resulting in an increase of the surface excess of the surfactant and therefore in an appreciable decrease in surface tension upon addition of NaCl. NaCl on its own is known to increase the surface tension of an aqueous solution. This effect is negligible at concentrations used in biological buffers (100 mM) (data not shown). The bulkier the headgroup (e.g., CHAPS), the less they reduce the surface tension. The length of the hydrophobic tail (DM/CYMAL-5/DDM) does not seem to have a great impact on the adsorption behavior. However, increasing the chain length results in a lower cmc (horizontal shift on the graph).
TABLE 2.
Summary of detergent and calibration plot properties
| Calibration plot properties
|
Physical properties
|
|||||||
|---|---|---|---|---|---|---|---|---|
| No. of points
|
±SD (°)
|
ϑ @ cmc (°)
|
Type*
|
MW (g/mol)
|
Aggregation no.†§
|
Critical micellar concentrations (mM)
|
||
| Detergent | This work | Literature values | ||||||
| C12E9 | 15 | 1.9 | 61.8 | N | 583.1 | 0.16 | 0.05†, 0.08‡§, 0.1‖ | |
| DDM | 18 | 1.0 | 74.1 | N | 510.6 | 78–149 | 0.17 | 0.15‖, 0.17†‡, 0.18**, 0.1–0.6§ |
| TX-100 | 15 | 1.1 | 56.0 | N | 647 | 100–155 | 0.37 | 0.23†, 0.24‖, 0.9‡, 0.2–0.9§ |
| FOSCh12 | 18 | 2.3 | 70.5 | Z | 351.5 | 50–60 | 1.3 | 1.5†‡ |
| LDAO | 19 | 1.1 | 69.7 | N/C | 229.4 | 76 | 1.9 | 1†, 1.4‖, 2‡, 2.2**, 1–2§ |
| CYMAL-5 | 16 | 2.0 | 72.9 | N | 494.5 | 66 | 2.2 | 2.4†‡ |
| DM | 14 | 0.8 | 73.5 | N | 482.6 | 69 | 2.5 | 1.6§‖, 1.8†‡¶, 2.2** |
| OTG | 17 | 0.9 | 52.9 | N | 308.4 | 9.5 | 9†‡§¶‖ | |
| CHAPS | 18 | 1.0 | 78.5 | Z | 614.9 | 10 | 3.4 | 8†‡, 2–10‖, 3–10**, 4.2–6.3¶, 6–10§ |
| SDS | 17 | 0.9 | 79.7 | A | 288.4 | 62–101 | 5.3 | 2.6†, 1.2–7.1**, 7–10§ |
| OG | 20 | 1.4 | 57.6 | N | 292.4 | 78 | 25 | 18†, 24.5‡, 30.3‖, 18–20¶, 19–25**, 20–25§ |
| OTAB | 15 | 1.4 | 81.9 | C | 252.2 | 230 | 220††, 241‡‡ | |
Comparison with radioactively labeled DDM
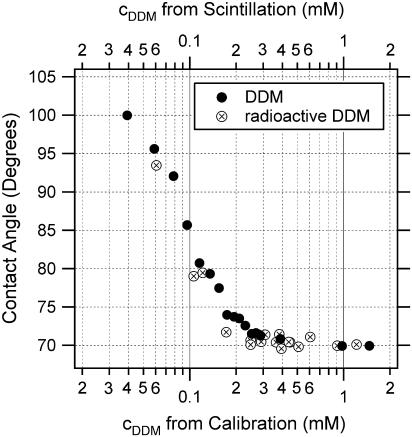
As an independent quality test for the presented concentration determination, radioactively labeled DDM has been assessed. Precise [14C]DDM concentrations of the samples were measured using a liquid scintillation counter. The calibration curves of DDM and radioactive DDM overlay very well (Fig. 6), demonstrating the accuracy of the sitting drop method.
FIGURE 6.
Quality assessment of the detergent concentration measurement. Concentrations from the DDM calibration have been calculated from the preparation of the standards; concentrations from the radioactive DDM have been taken from scintillation counting.
Controlling the amount of detergent bound to a membrane protein during Ni-NTA affinity chromatography
After membrane solubilization with an excess of detergent, the hydrophobic parts of membrane proteins are completely covered by detergent molecules, shielding them from the aqueous surrounding (2,4). However, to keep the proteins soluble, less detergent would be sufficient (26). In view of membrane protein stability one wants to minimize the amount of detergent present in a solution before reconstitution to favor lipid-protein contacts in the ternary solution (lipid-protein-detergent). In the case of low cmc detergents dialysis takes considerably longer if excess detergent is present. This means that the reconstitution process takes longer and the protein is kept in a nonnative environment for a longer time.
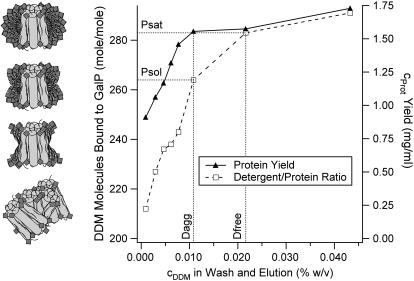
Here we show that it is possible to adjust the amount of detergent bound to the protein during Ni-NTA affinity chromatography by using washes of different near-cmc detergent concentrations (Fig. 7). Based on the assumption that the protein is saturated with detergent after solubilization (Psat), one would expect that when lowering the detergent concentration in the wash, the detergent/protein ratio (DPR) would decrease before the protein elution yield decreases. This is the range where excess detergent molecules are drawn off the protein without affecting its solubility (between Dfree and Dagg). When a critical DPR is reached (Psol) the protein yield starts to decrease too, indicating that part of the protein aggregates and that there is not enough detergent to keep all the protein soluble.
FIGURE 7.
Ni-NTA affinity chromatography with GalP using washes of different DDM concentrations.
As was shown by Møller and le Maire the amount of detergent binding by membrane proteins can be seen as a measure for their hydrophobicity and the size of their hydrophobic sector. The obtained solubility range (Psol to Psat) of 260 to 290 DDM molecules per GalP monomer (i.e., the molar ratio) in this study is an indication for a strong hydrophobicity, since it is higher compared with other published values, which range from 148 to 215 molecules for other membrane proteins (1).
DISCUSSION
When depositing a droplet onto a hydrophobic surface (Parafilm M) the spreading of the droplet over the surface is merely dominated by three phenomena: The molecules at the surface are energetically less favorable than the molecules in the interior of the droplet and hence the droplet tries to minimize its surface. On the other hand, adsorption of surfactant molecules to the liquid-vapor interface disturbs the ordering of the water molecules, thereby reducing the surface tension. Adsorption of surfactant to the solid-liquid interface hydrophilizes the hydrophobic substrate by adsorption of the hydrophobic tails and exposure of the hydrophilic headgroup. The latter two adsorption processes favor the spreading of the droplet. To ensure a (quasi-) equilibrium Young contact angle and good reproducibility, images are taken after 30 s. In many studies (19,27–31) it has been shown that the spreading of surfactant solutions due to detergent adsorption to the liquid-vapor and solid-liquid interface reaches a plateau at the latest within 30 s.
The use of 20-μl droplets ensures a high reproducibility because all adverse effects, such as evaporation and bulk concentration depletion are minimized. In addition, such drops are sufficiently small to assure the validity of the elliptical shape approximation. Assuming a cross-sectional area of 0.4 nm2 per detergent molecule, a mean surface (including the base) of 40 mm2 for a 20-μl droplet can accommodate an absolute maximum of 1014 detergent molecules. This corresponds to a maximum depletion of ∼8.3 μM, which in turn corresponds to an error in the cmc of 5% for a detergent with a cmc of 0.17 mM like DDM. This error would get worse with smaller volumes, since the volume scales with r3 whereas the surface only scales with r2.
The only interfering substances are other surface active reagents like glycerol and polyethylene glycols. Lipids slightly affect the measurement since they exhibit a somewhat similar behavior as detergents in that they possess a cmc (10 mg/ml dimyristoyl-phosphatidylcholine (DMPC) and 10 mg/ml dioleyl-phosphatidylcholine/dioleyl-phosphatidic acid (DOPC/DOPA) 70:30 exhibit contact angles of 106.1° and 107.1°, respectively, compared to 110.7° for water alone). However, for the measurement, one has to dilute the sample typically between 50 and 100 times to be below the cmc. In doing so the concentrations of interfering compounds usually drop below a critical concentration and the disturbing effect can be neglected. Another possibility is to perform calibrations in the presence of interfering substances, thereby implementing their contribution to the reduction in surface tension already in the calibration. Furthermore, it might be possible by generating calibration curves containing multiple surface active components at different ratios to decompose the resulting curves in terms of single components. For precision purposes it is advisable to weigh the pipetted volumes on a balance to prevent errors arising from small pipetting volumes.
The low surface energy of Parafilm M provides a suitable range for the measured contact angles. If the substrate is too hydrophilic the contact angles would be much lower and hence within a narrower range. The ease with which a fresh and clean surface can be prepared by the use of disposable Parafilm makes it a perfect candidate for the substrate. The reproducibility of the surface properties from one piece of Parafilm to another is excellent (see Table 1).
Solubilizations of membranes are often performed with an excess of detergent to ensure complete recovery of the overexpressed membrane protein(s). From a quantitative point of view this is valid. However, from a qualitative point of view there is no need for excess detergent. On the contrary, when working with low cmc detergents it is even desirable to use the minimal amount of detergent in view of an efficient detergent removal (2). During membrane protein reconstitution the lipid headgroups should come in contact with the polar protein surface. However, if the detergent monolayer around the protein is too large and the polar residues are concealed, the bilayer recognition may be hindered (4). Similarly, in x-ray crystallography the size of the detergent collar is of fundamental importance, too, since an oversized micelle is obstructive to the formation of crystal contacts because of steric hindrance (32).
Over the last decades DDM has proven to be a good choice as a solubilizer for a wide range of membrane proteins, since it is relatively mild to the protein, keeping its native tertiary structure intact. It is therefore frequently used in 3D crystallography. However, with its large micellar size DDM tends to concentrate during protein concentration procedures. Moreover, its low cmc makes DDM unsuitable for dialysis-driven 2D crystallization. Nevertheless, we believe that by learning the subtleties in how this detergent behaves and how to adjust the size of the protecting belt around the protein, DDM and other low cmc detergents can well be used for 2D membrane protein crystallization.
CONCLUSION
The speed and ease of use of the presented detergent concentration determination procedure are unique. The mean standard deviation for three contact angle measurements of 1.3° for a large set of detergents (see Fig. 4) and the additional comparison of the calibrated DDM curve with radiolabeled DDM underline the reproducibility and accuracy of the measurements. The universality of surface tension reduction by surfactants makes this method suitable for all types of detergents and the robustness of the procedure with respect to interfering substances even allows for their concentration to be determined in tertiary mixtures.
Acknowledgments
We are grateful to P. L. T. M. Frederix and T. Braun for helping us with the camera layout and the iris diaphragm calculation. We are indebted to J. L. Rigaud for kindly providing us with radioactive DDM and to M. Chami for fruitful discussions on the results obtained with GalP. We thank S. Bürgi for the calibration of OTAB, M. Duckely for the calibration of FOSCh12, and G. Martin for helping with the liquid scintillation counter. Last but not least we are thankful to H. Heerklotz for reading and discussing the manuscript.
This work was supported by the Swiss National Center for Competence in Research in Nanoscale Sciences and the M. E. Müller Foundation.
References
- 1.Moller, J. V., and M. le Maire. 1993. Detergent binding as a measure of hydrophobic surface area of integral membrane proteins. J. Biol. Chem. 268:18659–18672. [PubMed] [Google Scholar]
- 2.Remigy, H. W., D. Caujolle-Bert, K. Suda, A. Schenk, M. Chami, and A. Engel. 2003. Membrane protein reconstitution and crystallization by controlled dilution. FEBS Lett. 555:160–169. [DOI] [PubMed] [Google Scholar]
- 3.Dolder, M., A. Engel, and M. Zulauf. 1996. The micelle to vesicle transition of lipids and detergents in the presence of a membrane protein: towards a rationale for 2D crystallization. FEBS Lett. 382:203–208. [DOI] [PubMed] [Google Scholar]
- 4.Jap, B. K., M. Zulauf, T. Scheybani, A. Hefti, W. Baumeister, U. Aebi, and A. Engel. 1992. 2D crystallization: from art to science. Ultramicroscopy. 46:45–84. [DOI] [PubMed] [Google Scholar]
- 5.Caffrey, M. 2003. Membrane protein crystallization. J. Struct. Biol. 142:108–132. [DOI] [PubMed] [Google Scholar]
- 6.Ai, X., and M. Caffrey. 2000. Membrane protein crystallization in lipidic mesophases: detergent effects. Biophys. J. 79:394–405. [DOI] [PMC free article] [PubMed] [Google Scholar]
- 7.Le Maire, M., S. Kwee, J. P. Andersen, and J. V. Moller. 1983. Mode of interaction of polyoxyethyleneglycol detergents with membrane proteins. Eur. J. Biochem. 129:525–532. [DOI] [PubMed] [Google Scholar]
- 8.daCosta, C. J., and J. E. Baenziger. 2003. A rapid method for assessing lipid:protein and detergent:protein ratios in membrane-protein crystallization. Acta Crystallogr. D Biol. Crystallogr. 59:77–83. [DOI] [PubMed] [Google Scholar]
- 9.Eriks, L. R., J. A. Mayor, and R. S. Kaplan. 2003. A strategy for identification and quantification of detergents frequently used in the purification of membrane proteins. Anal. Biochem. 323:234–241. [DOI] [PubMed] [Google Scholar]
- 10.Reynolds, J. A., and C. Tanford. 1976. Determination of molecular weight of the protein moiety in protein-detergent complexes without direct knowledge of detergent binding. Proc. Natl. Acad. Sci. USA. 73:4467–4470. [DOI] [PMC free article] [PubMed] [Google Scholar]
- 11.Noy, D., J. R. Calhoun, and J. D. Lear. 2003. Direct analysis of protein sedimentation equilibrium in detergent solutions without density matching. Anal. Biochem. 320:185–192. [DOI] [PubMed] [Google Scholar]
- 12.Dubois, M., K. Gilles, J. K. Hamilton, P. A. Rebers, and F. Smith. 1951. A colorimetric method for the determination of sugars. Nature. 168:167. [DOI] [PubMed] [Google Scholar]
- 13.Lau, F. W., and J. U. Bowie. 1997. A method for assessing the stability of a membrane protein. Biochemistry. 36:5884–5892. [DOI] [PubMed] [Google Scholar]
- 14.Ringler, P., B. Heymann, and A. Engel. 2000. Two-Dimensional Crystallization of Membrane Proteins. In Membrane Transport. S.A. Baldwin, editor. Oxford University Press, New York. 229–268.
- 15.Neumann, A. W., R. J. Good, C. J. Hope, and M. Sejpal. 1974. An equation-of-state approach to determine surface tensions of low-energy solids from contact angles. J. Colloid Interface Sci. 49:291–304. [Google Scholar]
- 16.Kwok, D. Y., and A. W. Neumann. 2000. Contact angle Interpretation in terms of solid surface tension. Colloid. Surface. A. 161:31–48. [Google Scholar]
- 17.Li, D., and A. W. Neumann. 1992. Contact angles on hydrophobic solid surfaces and their interpretation. J. Colloid Interface Sci. 148:190–200. [Google Scholar]
- 18.Surface tension values of some common test liquids for surface energy analysis. 2004. http://www.surface-tension.de.
- 19.Dutschk, V., K. G. Sabbatovskiy, M. Stolz, K. Grundke, and V. M. Rudoy. 2003. Unusual wetting dynamics of aqueous surfactant solutions on polymer surfaces. J. Colloid Interface Sci. 267:456–462. [DOI] [PubMed] [Google Scholar]
- 20.Myers, D. 1991. Surfaces, Interfaces, and Colloids: Principles and Applications. VCH Publishers, New York.
- 21.Janczuk, B., T. Bialopiotrowicz, and A. Zdziennicka. 1999. Some remarks on the components of the liquid surface free energy. J. Colloid Interface Sci. 211:96–103. [DOI] [PubMed] [Google Scholar]
- 22.Ikeda, S., M. A. Tsunoda, and H. Maeda. 1978. The application of the gibbs adsorption isotherm to aqueous solutions of a nonionic-cationic surfactant. J. Colloid Interface Sci. 67:336–348. [Google Scholar]
- 23.Ikeda, S., M. A. Tsunoda, and H. Maeda. 1979. The effects of ionization on micelle size of dimethyldodecylamine oxide. J. Colloid Interface Sci. 70:448–455. [Google Scholar]
- 24.Schick, M. J. 1962. Surface films of nonionic detergents. I. Surface tension study. J. Colloid Sci. 17:801–813. [Google Scholar]
- 25.Walter, A., G. Kuehl, K. Barnes, and G. VanderWaerdt. 2000. The vesicle-to-micelle transition of phosphatidylcholine vesicles induced by nonionic detergents: effects of sodium chloride, sucrose and urea. Biochim. Biophys. Acta. 1508:20–33. [DOI] [PubMed] [Google Scholar]
- 26.Koning, R. I. 2003. Cryo-Electron Crystallography—from Protein Reconstitution to Object Reconstruction. University of Groningen, Groningen, The Netherlands.
- 27.von Bahr, M., F. Tiberg, and B. V. Zhmud. 1999. Spreading dynamics of surfactant solutions. Langmuir. 15:7069–7075. [Google Scholar]
- 28.Starov, V. M., S. R. Kosvintsev, and M. G. Velarde. 2000. Spreading of surfactant solutions over hydrophobic substrates. J. Colloid Interface Sci. 227:185–190. [DOI] [PubMed] [Google Scholar]
- 29.Stoebe, T., R. M. Hill, M. D. Ward, and H. T. Davis. 1997. Enhanced spreading of aqueous films containing ionic surfactants on solid substrates. Langmuir. 13:7276–7281. [Google Scholar]
- 30.Stoebe, T., Z. Lin, R. M. Hill, M. D. Ward, and H. T. Davis. 1997. Enhanced spreading of aqueous films containing ethoxylated alcohol surfactants on solid substrates. Langmuir. 13:7270–7275. [Google Scholar]
- 31.von Bahr, M., F. Tiberg, and V. Yaminski. 2001. Spreading dynamics of liquids and surfactant solutions on partially wettable hydrophobic substrates. Colloid. Surface. A. 193:85–96. [Google Scholar]
- 32.Marone, P. A., P. Thiyagarajan, A. M. Wagner, and D. M. Tiede. 1999. Effect of detergent alkyl chain length on crystallization of a detergent-solubilized membrane protein: correlation of protein-detergent particle size and particle-particle interaction with crystallization of the photosynthetic reaction center from Rhodobacter sphaeroides. J. Cryst. Growth. 207:214–225. [Google Scholar]
- 33.Bhairi, S. M. 2001. A Guide to the Properties and Uses of Detergents in Biological Systems. Calbiochem-Novabiochem, La Jolla, CA.
- 34.Zulauf, M., and H. Michel. 1990. Properties of commonly used nonionic and zwitterionic detergents for membrane protein solubilization and crystallization. In Crystallization of Membrane Proteins. H. Michel, editor. CRC Press, Boca Raton, FL. 209–211.
- 35.le Maire, M., P. Champeil, and J. V. Moller. 2000. Interaction of membrane proteins and lipids with solubilizing detergents. Biochim. Biophys. Acta. 1508:86–111. [DOI] [PubMed] [Google Scholar]
- 36.Jang, J., J. H. Oh, and X. L. Li. 2004. A novel synthesis of nanocapsules using identical polymer core/shell nanospheres. J. Mater. Chem. 14:2872–2880. [Google Scholar]
- 37.Ruso, J. M., and F. Sarmiento. 2000. The interaction between n-alkyl trimethylammonium bromides with poly(L-aspartate): a thermodynamics study. Colloid Polym. Sci. 278:800–804. [Google Scholar]


