Abstract
Membrane-active peptides participate in many cellular processes, and therefore knowledge of their mode of interaction with phospholipids is essential for understanding their biological function. Here we present a new methodology based on electron spin-echo envelope modulation to probe, at a relatively high resolution, the location of membrane-bound lytic peptides and to study their effect on the water concentration profile of the membrane. As a first example, we determined the location of the N-terminus of two membrane-active amphipathic peptides, the 26-mer bee venom melittin and a de novo designed 15-mer D,L-amino acid amphipathic peptide (5D-L9K6C), both of which are antimicrobial and bind and act similarly on negatively charged membranes. A nitroxide spin label was introduced to the N-terminus of the peptides and measurements were performed either in H2O solutions with deuterated model membranes or in D2O solutions with nondeuterated model membranes. The lipids used were dipalmitoyl phosphatidylcholine (DPPC) and phosphatidylglycerol (PG), (DPPC/PG (7:3 w/w)), egg phosphatidylcholine (PC) and PG (PC/PG (7:3 w/w)), and phosphatidylethanolamine (PE) and PG (PE/PG, 7:3w/w). The modulation induced by the 2H nuclei was determined and compared with a series of controls that produced a reference “ruler”. Actual estimated distances were obtained from a quantitative analysis of the modulation depth based on a simple model of an electron spin situated at a certain distance from the bottom of a layer with homogeneously distributed deuterium nuclei. The N-terminus of both peptides was found to be in the solvent layer in both the DPPC/PG and PC/PG membranes. For PE/PG, a further displacement into the solvent was observed. The addition of the peptides was found to change the water distribution in the membrane, making it “flatter” and increasing the penetration depth into the hydrophobic region.
INTRODUCTION
Membrane-active peptides participate in many cellular processes. A major family includes host defense peptides (also termed antimicrobial peptides), which serve as the first chemical barrier between all organisms and microbes (1–5). It is generally assumed that many antimicrobial peptides disrupt and permeate the target cell membrane, which result in irreversible damage that is hard to repair (6–8). These cationic peptides bind strongly and permeate efficiently negatively charged phospholipid membranes (containing the anionic phosphatidylglycerol) that mimic the bacterial membrane (9–14). Because in many cases biological activity can be predicted on the basis of the ability of the peptides to interact and disrupt these membranes, many biophysical studies were conducted on model membrane systems (15–19). These studies indicated a direct correlation between target-cell specificity and modes of action. For examples, peptides that bind strongly and insert into zwitterionic membranes (i.e., the bee venom melittin (20), the mammalian effector protein NK-lysin (21), and the neurotoxin pardaxin (22)), are in most cases, hemolytic, whereas those that bind predominantly negatively charged membranes (i.e., the antimicrobial peptides magainin (23) and cecropin (24)) are nonhemolytic but endowed with antibacterial activity. Several methods are utilized, alone or in parallel, to study peptide-membrane interactions, each of which has advantages and disadvantages. Examples include attenuated total reflectance Fourier transform infrared spectroscopy, oriented circular dichroism (25,26), fluorescence spectroscopy (27), surface plasmon resonance (SPR) (28,29), and nuclear magnetic resonance (NMR) (30–32). Another method is electron paramagnetic resonance (EPR) spectroscopy (33–37), which includes line-shape analysis, providing dynamical information, and relaxation time measurements (T1 and T2) that give qualitative distance information.
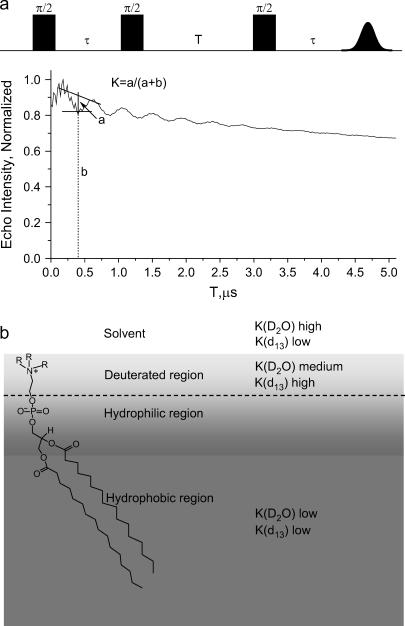
Here we introduce another approach to study peptide-membrane interactions based on electron-spin echo envelope modulations (ESEEM) spectroscopy. This technique is a well-established method for measuring distances between an electron spin and nearby nuclear spins (38–40). The experiment constitutes the application of a series of microwave pulses that generate an echo, and the echo decay is followed as a function of one of the time intervals between the pulses. When an anisotropic hyperfine interaction is present, the echo decay is modulated, as shown in Fig. 1 a for the three-pulse ESEEM experiment. In the case of a very weak anisotropic hyperfine interaction the modulation frequency is the nuclear Larmor frequency, νI, and the modulation depth (K) is a function of the electron-nuclear distance, the number of interacting nuclei, and their nuclear spin (38). Accordingly, K provides direct information on the close environment of the unpaired electron. For example, ESEEM has been extensively used by Kevan and co-workers to study a variety of photoionization and charge-separation problems in micelles and vesicle where modulations from 31P in the polar head and from D2O were followed (41–43). In addition, it was used to determine the location of nitroxide spin probes in micelles through their interactions with specifically deuterated surfactant molecules (44,45). Recently, ESEEM was used to determine the degree of water penetration into phosopholipid bilayers with and without cholesterol (46,47).
FIGURE 1.
(a) The three-pulse ESEEM sequence and the ESEEM waveform with the definition of the modulation depth, K(2H). (b) A schematic representation of the various regions of the model membrane and the expected modulation depth for a spin label located within the different regions. The gradient in the gray color distinguishes between the hydrophilic and hydrophobic regions.
The application of this method to study peptide-membrane interactions requires a spin-labeled peptide, which is achieved using the well-known site-directed spin-labeling methodology (48). The interaction of the peptide with the membrane is then followed using ESEEM induced by 2H nuclei in specifically labeled phospholipids. Furthermore, the exposure of the spin-labeled peptide to the solvent is examined by the ESEEM of a D2O solution of normal phospholipids. This approach gives two points of reference, as roughly illustrated in Fig. 1 b. In this naive schematic representation the headgroup is drawn perpendicular to the surface and the chain is tilted. A more realistic picture is given by probability distribution functions, as summarized in the review of Nagle et al. (49). There the center of the phosphate group probability distribution is somewhat lower than that of the choline (with respect to the surface).
The ESEEM technique offers the following advantages: i), Deuterium labeling of phospholipids preserve their properties. ii), The relation between the modulation pattern and the distance is relatively simple and universal (38), such that different nitroxide spin probes can be directly compared with the spin-labeled peptide. This allows the creation of a reference “ruler” using spin probes with different and well-known properties to which unknowns can be compared. iii), Peculiarities analogous to nonradiative energy homotransfer or other self-quenching mechanisms, as sometimes found in fluorescence spectroscopy (50), are not encountered because the nuclear modulation does not depend on electron-electron spin interactions. iv), The evaluation of the degree of exposure to the solvent is also straightforward through the use of D2O. v), The ESEEM experiments can be complemented by EPR measurements, which provide information on the motional characteristics and binding. vi), The results can be quantitatively analyzed to yield estimated average distances.
We demonstrate the feasibility of this ESEEM methodology by exploring the interaction of two membrane-active peptides with model membranes. Specifically, the effect of the peptides on the water concentration profile of the membrane and the relative location of their N-terminus with respect to the membrane surface were determined. The two membrane-active amphipathic peptides used were: the 26-mer bee venom melittin and a de novo designed 15-mer D,L-amino acid (aa) diastereomeric amphipathic peptide (5D-L9K6C). Melittin served as a model for a non-cell-selective peptide that forms transmembrane pores in zwitterionic but not in negatively charged membranes, whereas the diastereomeric 5D-L9K6C was used as a model for bacteria-selective and non-pore-forming peptides. Both peptides are antimicrobial and bind and act similarly on negatively charged membranes (51–58). Cysteine was added to their N-termini without affecting their biological function, to serve as a site for the attachment of the spin probe. The negative model membranes used were large unilamellar vesicles (LUVs) prepared from dipalmitoyl phosphatidylcholine (DPPC) or egg phosphatidylcholine (PC) mixed with egg phosphatidylglycerol (PG) (DPPC/PG or PC/PG, both 7:3 w/w). In the former, DPPC was deuterated in the polar head region. A few experiments were also carried out on phosphatidylethanolamine (PE) and PG LUVs (PE/PG, 7:3 w/w).
EXPERIMENTAL PROCEDURES
Materials
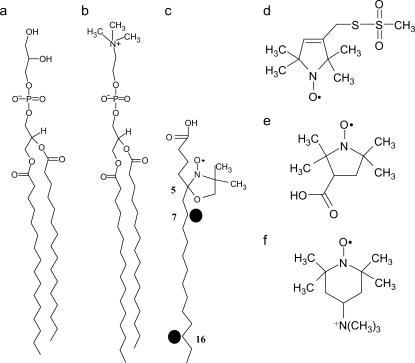
4-Methyl benzhydrylamine resin and butylloxycarbonyl amino acids were purchased from Calibochem-Novabiochem (La Jolla, CA). Other reagents used for peptide synthesis included trifluoroacetic acid (Sigma, St. Louis, MO), N,N-diisopropylethylamine (Aldrich, St. Louis, MO), methylene chloride (peptide synthesis grade, Biolab, Jerusalem, IL), dimethylformamide (peptide synthesis grade, Biolab), piperidine (Merck, Rahway, NJ), and benzotriazolyl-n-oxy-tris-(dimethylamino) phosphonium-hexaflourophosphate (Sigma). Reagents used for site-directed spin labeling included (1-oxyl-2, 2, 5, 5-tetramethyl-3-pyrroline-3-methyl) methanethiosulfonate (MTSSL) (Toronto Research Chemicals, Ontario, CA). The spin probes 4-trimethylam monium-2, 2, 6, 6-tetramethylpiperidine-1-oxyl iodide (CAT1) (Molecular Probes, Eugene, OR), 3-(carboxy)-2, 2, 5, 5-tetramethyl-1-pyrrolidinyloxy (proxy), 5-doxyl-stearic acid (5DSA) and 7-doxyl-stearic acid (7DSA) were purchased from Aldrich. 16-Doxyl-stearic acid (16DSA) was purchased from TCI (Tokyo, Japan). The phospholipids dipalmitoyl phosphatidylcholine (DPPC), egg phosphatidylcholine (PC), egg phosphatidylglycerol (PG), and phosphatidylethanolamine (PE) (Type V, from Escherichia coli) were purchased from Sigma (see Fig. 2 for chemical formulas). The synthesis and purification of rec-1, 2 dipalmitoyl-3-phosphatidylcholine-d13 (DPPC-d13) was done based on the procedures described in Verhoeven et al. (59) and Eibl (60). The products were checked by TLC and 1H-NMR (300 MHz) (CDCl3/TMS) the chemical and isotopic purity was found to be better than 98%.
FIGURE 2.
Schematic illustration of the phospholipids and the nitroxide spin probes used in this study. (a) PG, (b) DPPC, (c) 5DSA, (d) MTSSL, (e) proxy, and (f) CAT1.
Peptide synthesis and purification
The two peptides (sequences are shown on Table 1) were synthesized by a standard F-moc solid-phase method on a Rink amide MBHA resin (61,62). The peptides were cleaved from the resin by trifluoroacetic acid and after treatment with the reducing agent DTT (1:1000), they were purified by RP-HPLC on a C18 reverse phase Vydac analytical column (250 × 4.6 mm, 300-Å pore size, 5-μm particle size). They were shown to be homogeneous (>97%) and their purification was confirmed by mass spectrometry.
TABLE 1.
The peptides used in this work
| Peptide designation | Sequence* |
|---|---|
| Melittin | CGIGAVLKVLTTGLPALISWIKRKRQQ-NH2 |
| 5D-L9K6C | CLKLLKKLLKKLLKLL-NH2 |
D-amino acids are underlined and italic.
Peptide labeling and purification
The spin probe (MTSSL) was attached to the two different peptides through a specific cysteine, located at the N-terminal of the peptide chain (48). A 10-fold excess of the radical was used in 0.1 M phosphate buffer (pH 7.2) and 0.1 M NaCl. The suspensions were stirred at room temperature for 12 h. The spin-labeled peptides were purified by RP-HPLC and the purification was confirmed by mass spectrometry. The spin-labeled peptides are referred to as 5D-L9K6C-NO and melittin-NO. The spin-labeled peptides preserved the antimicrobial activities of the parental peptides.
Preparation of large unilamellar vesicles
Dry lipid mixtures of DPPC/PG (7:3 w/w), PC/PG (7:3 w/w), and PE/PG (7:3 w/w) were dissolved in a CHCl3/MeOH mixture (2:1, v/v). The solvents were evaporated under a nitrogen stream, and the lipids (at a concentration of 5 mg/ml) were resuspended in a phosphate buffer by vortexing. Next, the large unilamellar vesicles (LUVs) were prepared by extrusion as described in detail previously (63). The peptides were added to the LUV solution at a peptide/lipid molar ratio of 1:250 to ensure maximum binding of all the peptide molecules to the LUVs, as determined previously for the parental peptides (56,64). Because the addition of the spin probe did not affect the biological function of the parental peptides, we can assume a similar binding for labeled peptides. Other probes were added to the LUV solution in the same concentration as the peptides. In the case of 5-, 7-, and 16DSA, which are water-insoluble, a 1% (weight) of the spin probe was added to the lipid mixture and then the LUVs were prepared. After equilibration at room temperature, the samples for ESEEM measurements were rapidly frozen by insertion of the EPR tube into liquid nitrogen (43). Thereafter, the samples remained frozen. Tables 2 and 3 list all samples prepared.
TABLE 2.
The DPPC-d13/PG samples studied in this work
| Membrane | DPPC-d13/PG
|
DPPC-d13/PG+melittin
|
DPPC-d13/PG+5D-L9K6C
|
|---|---|---|---|
| Spin probe | |||
| CAT1 | + | – | – |
| proxy | + | – | – |
| 5DSA | + | + | + |
| 7DSA | + | + | + |
| 16DSA | + | + | + |
| 5D-L9K6C-NO | + | – | – |
| Melittin-NO | + | – | – |
TABLE 3.
The D2O samples studied in this work
| Membrane | PC/PG/D2O
|
DPPC/PG/D2O
|
PC/PG/D2O+melittin
|
DPPC/PG/D2O+melittin
|
PC/PG/D2O+5D-L9K6C
|
DPPC/PG/D2O+5D-L9K6C
|
PE/PG/D2O
|
|
|---|---|---|---|---|---|---|---|---|
| Spin probe | D2O | |||||||
| CAT1 | + | + | – | – | – | – | – | – |
| proxy | + | + | – | – | – | – | – | – |
| 5DSA | – | + | + | + | + | + | + | – |
| 7DSA | – | + | + | + | + | + | + | – |
| 16DSA | – | + | + | + | + | + | + | – |
| 5D-L9K6C-NO | + | + | + | – | – | – | – | + |
| Melittin-NO | + | + | + | – | – | – | – | + |
EPR spectroscopy
Continuous wave (CW) X-band (9.2 GHz) EPR measurements were carried out at room temperature on a Varian E12 spectrometer in flat cells. ESEEM experiments were carried out on a Bruker ELEXSYS E580 spectrometer operating at 9.5 GHz at 50 K. The three-pulse ESEEM sequence, π/2-τ-π/2-T-π/2-τ-echo, was employed with a four-step phase cycling (65). The measurements were carried out at a magnetic field where the echo intensity is maximum, and the length of the π/2 and π microwave pulses were 16 and 32 ns, respectively. The pulse interval τ was selected as ∼220 ns, (depending on the magnetic field), to maximize the deuterium modulation according to τ = (2q + 1)/2νI, q = 0, 1, 2….where νI is the deuterium nuclear Larmor frequency (38). The effective modulation depth was taken as K = a/(a + b), where (a + b) is the interpolated echo intensity between the first and second maxima and b is the echo intensity at the first minimum, as shown in Fig. 1 a. Fourier transformation (FT) of the ESEEM trace yields a peak at the 2H Larmor frequency, the intensity of which is I(2H). I(2H) represents the total intensity of the 2H modulation in the ESEEM trace, as opposed to K(2H), where only one representative time point is considered. The two, however, are closely related and should exhibit the same trends. In this work we have used both K(2H) and I(2H) to locate the peptides with respect to the LUVs. The FT was carried out as follows: first the background decay was subtracted using a polynomial fit, then the data were apodized with a Hamming window, zero filling was performed followed by FT, cross-term averaging (66), and finally the magnitude spectrum was calculated. All ESEEM traces were treated identically. The number of accumulations was 30–90 depending on the modulation depth.
W-band ENDOR measurements were carried out at 25 K on a homebuilt spectrometer (67) using the Mims ENDOR sequence (68). The π/2 microwave pulse length was 60 ns, and the interval between the two first pulses, τ was 0.364 μs. The duration of the RF π pulse was 30 μs and the number of accumulations was ∼400.
RESULTS AND DISCUSSION
CW-EPR
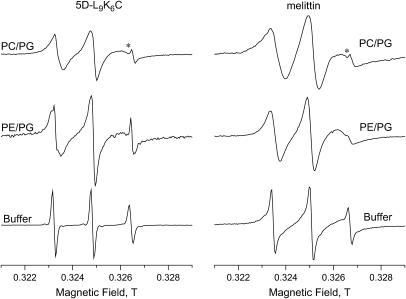
The EPR spectrum of the spin-labeled peptide can give an indication of its binding to the LUVs. Therefore, before the ESEEM experiments, room temperature EPR measurements were carried out. The spectrum of a nitroxide spin probe, undergoing rapid tumbling in solution and fully averaging all anisotropic interactions, is characterized by a triplet with narrow linewidths and equal intensities. In contrast, the EPR spectrum of a probe bound to a LUV is characterized by a spectrum with broader lines and different relative intensities, due to the slower tumbling rate of the larger object (69). The room temperature (22–24°C) CW-EPR spectra of the spin-labeled 5D-L9K6C (5D-L9K6C-NO) and melittin (melittin-NO) in buffer solutions and in solutions of LUVs of PC/PG and PE/PG are shown in Fig. 3. The solution spectrum of melittin-NO is broader than that of 5D-L9K6C-NO because of its larger size, 27 aa compared to 16, which results in a slower tumbling rate for melittin. The spectra of the peptides in solutions with LUVs of DPPC/PG (data not shown), PC/PG, and PE/PG are significantly broader than those in normal solutions, exhibiting a residual anisotropy that shows that both peptides bind to the LUVs. In addition, the spectra of the peptides with DPPC/PG and PC/PG exhibit more pronounced anisotropic characteristics than those with PE/PG, suggesting a better binding in DPPC/PG and PC/PG. Indeed, previous studies showed that the binding of some native and redesigned cationic peptides increases by >10-fold when PE/PG is replaced with PC/PG (56,70). The spectra of both peptides show an additional sharp triplet (marked with * in Fig. 3) superimposed on the broader signal and attributed to some free nitroxide. Its relative intensity is <3% and therefore it will not be considered any further.
FIGURE 3.
Room temperature X-band EPR spectra of some of the samples studied as noted on the figure. The asterisks (*) mark the signal of free nitroxide impurity.
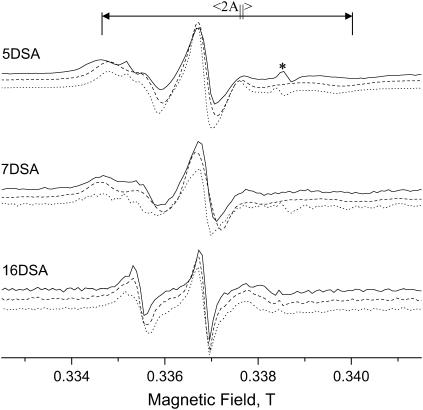
For the characterization of the system and the creation of a reference ruler, LUV solutions with standard spin probes were prepared and compared with those of the spin-labeled peptides (see Fig. 2). Tables 2 and 3 list the samples prepared. The spectra of the positively charged CAT1 and the negatively charged proxy (not presented) showed that the probes are highly mobile and therefore no conclusions regarding their binding/penetration to the LUVs could be drawn. In contrast, the spectra of 5DSA and 7DSA, presented in Fig. 4, reflect a large anisotropy, showing that they have been incorporated into the vesicle bilayer and the nitroxide is located in a position where its motion is highly restricted (on the EPR timescale). Some of the spectra of 5DSA and 7DSA include superimposed sharp triplets (marked with *) attributed to a free nitroxide. The relative intensity of the latter is very small and it can therefore be ignored. Both probes exhibit a higher degree of anisotropy than the spin-labeled peptides. The spectrum of 16DSA shows a smaller anisotropy because the label is located deep in the bilayer, in the more mobile hydrophobic region. These results are in agreement with earlier studies of spin probes and membranes (71–73).
FIGURE 4.
Room temperature X-band EPR spectra of 5DSA, 7DSA, and 16DSA in DPPC-d13/PG LUVs without peptides (solid line), with 5D-L9K6C (dashed line) and with melittin (dotted line).
The comparison of the spin-label peptides with those of the reference spin labels should be done cautiously because the addition of the peptide affects the properties of the membrane. Therefore, a valid comparison is with systems that consist of the reference spin probe and the LUVs with and without nonlabeled peptides. Fig. 4 compares room temperature EPR spectra of 5-, 7-, and 16DSA in DPPC-d13/PG without and with melittin or 5D-L9K6C. For both peptides, 5DSA exhibits a decrease in 〈2A‖〉, reflecting an increase in the mobility. The effect is stronger for melittin. The same behavior was observed for the PC/PG system. Marsh and co-workers (72) have studied the effect of melittin on pure 1, 2 dimyristoyl-sn-glycero-3-phosphocholine and 1, 2 ditetradecyl-sn-glycero-3-phosphoglycerol using spin-labeled phospholipids and 5DSA. They reported that whereas in the gel phase the addition of melittin resulted in increased mobility, a decrease in the motional freedom was observed in the liquid crystalline phase. In addition, melittin caused a smearing of the gel-liquid crystal transition. Temperature-dependent EPR measurements of 5DSA in DPPC/PG (not shown) revealed a continuous decrease of 〈2A‖〉 with increasing temperatures showing that the cooperative change in mobility, manifested by the clear phase transition, is absent. This is attributed to the mixture of lipids used, as noted earlier for the mixture of DPPC/PG (74).
Although the EPR spectra show that the two peptides are bound to the LUVs and affect the mobility of its constituents, they do not provide information regarding the mode of binding. Namely, it is not clear whether they are adsorbed at the LUV water interface or are inserted into the LUV bilayer, and if so, how deep they penetrate. Such information can be obtained from the ESEEM experiments described next.
ESEEM measurements
The ESEEM measurements are usually carried out at low temperatures on frozen solutions to slow down the echo decay. It has been shown that the structure of the membrane is preserved upon fast freezing (43,46,47) and therefore the results of such measurements are relevant. We chose to freeze quench the samples at room temperature because at this temperature the biological activity of the peptides was tested (56). Three-pulse ESEEM measurements were carried out on all samples listed in Tables 2 and 3.
Location of reference spin probes in the LUVs
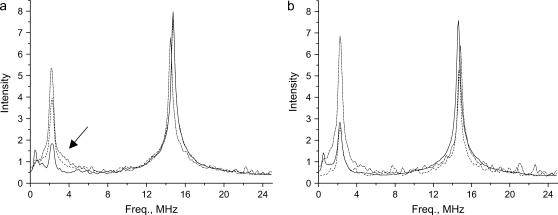
The first step toward determining the location of the peptide with respect to the LUVs surface is to build a reference “ruler” for the modulation depth expected from different regions within and outside the lipid bilayer and to establish the range of distances that is accessible by this method. For this purpose, the K(2H) and I(2H) values of the various reference spin probes in DPPC/PG/D2O and DPPC-d13/PG were determined and analyzed quantitatively. For a comparison, we also investigated the PC/PG/D2O, which is expected to be similar to the DPPC system for which we had specifically deuterated lipids. Sample FT-ESEEM spectra are presented in Fig. 5, a and b. All the spectra show two peaks, at the 2H Larmor frequency (∼2 MHz) and at ∼15 MHz, the 1H Larmor frequency, due to protons. Because the 2H peaks within the DPPC-d13/PG, DPPC/PG/D2O, and PC/PG/D2O groups have the same width (within experimental error), we took the peak height as a measure of its intensity. Furthermore, since the proton modulation is relatively weak (because of the τ-value chosen), it usually can be well separated from the 2H modulations also in the time domain traces. It does not affect the determination of the 2H modulation depth, unless the 2H modulation is very shallow. In this case the presence of the 1H modulation can lead to errors in K(2H) but not in I(2H).
FIGURE 5.
FT-ESEEM spectra of reference spin probes in (a) DPPC/PG/D2O and (b) DPPC-d13 /PG. 16DSA (solid line), 7DSA (dashed line), 5DSA (dotted-dashed line). The arrow marks the broad signal due to water H-bonded to the NO group.
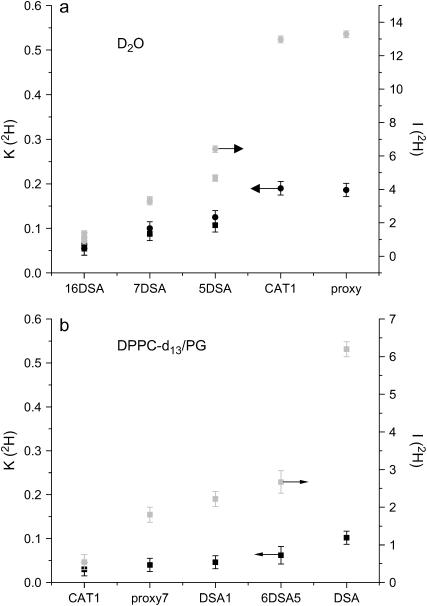
For DPPC/PG/D2O and PC/PG/D2O, K(2H) and I(2H) exhibit the trend: proxy ∼ CAT1 > 5DSA > 7DSA > 16DSA (Figs. 5 a and 6 a). This is expected considering the properties of each of these probes, where 16DSA is buried in the hydrophobic alkyl chain part and the two small polar probes are located in the water solvent. In these systems, the 2H peak is actually a superposition of two signals, a broad peak (marked with an arrow in Fig. 5 a), attributed to water molecules in close contact with the spin probe (via hydrogen bonds), and a narrow peak representing the distant water (47). The spectra show that water molecules are hydrogen bonded down to position 7, and remote water can also be observed from position 16. The ESEEM experiments carried out on a spin-labeled phosphatidylcholine in bilayers of pure DPPC showed a sharp decrease in I(2H) at position 8 (47).
FIGURE 6.
The K(2H) (solid symbols, arrow points to left axis) and I(2H) (shaded symbols, right axis) values of all reference spin probes in (a) DPPC/PG/D2O (▪) and PC/PG/D2O (•) and (b) DPPC-d13/PG.
For DPPC-d13/PG the trend 5DSA > 16DSA ∼ 7DSA > proxy > CAT1 is observed (Figs. 5 b and 6 b). Here the 2H peak does not have a broad component because there are no close, specific interactions between the nitroxide group and the membrane's deuterons. The similar modulation depth of 7DSA and 16DSA is rather surprising. A similar behavior was observed in pure DPPC vesicles with 31P modulation being the reference point (43). There, it was explained in terms of the bending of the alkyl chains such that the nitroxides in 5DSA and 16DSA are at the same depth. However, the reported D2O modulation exhibited by 16DSA was significantly lower than in 7DSA, similar to our observations. Therefore, we attribute the unexpectedly large K(2H) of 16DSA in DPPC-d13/PG to its deep position, which also senses the deuterated layer of the counterpart of the bilayer. The very low value of K(2H) of D2O indicates that the amount of water that penetrates below the deuterated layer is small.
The comparison of the modulation depth of this reference system is summarized in Fig. 6, a and b. Here we present both the K(2H) and I(2H) values. Although the I(2H) value exhibits a better resolution compared to K(2H), in the model calculation we computed K(2H) rather than I(2H) (see Appendix) because of computational time constraints. The calculation of K(2H) requires less computation time because the length of the calculated ESEEM trace can be shorter (see below). Fig. 6 shows that K(2H) and I(2H) exhibit the same trend, but they do not scale linearly. This is attributed to the larger error in K(2H) due to the interference of the protons' modulation when the 2H modulation is shallow.
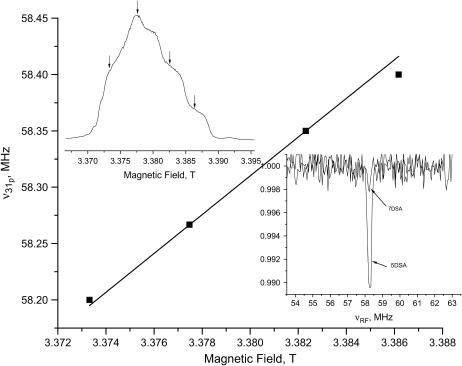
We have also used 31P as a reference point for locating the reference spin probes. Whereas no 31P peaks were detected in the FT-ESEEM spectra, a signal at the 31P Larmor frequency was observed in the W-band Mims ENDOR spectrum, recorded with an optimized τ-value as described in Zänker et al. (75). Fig. 7 shows the spectrum of 5DSA in PC/PG. The ENDOR effect is very weak but clear, and field dependence measurements, also depicted in Fig. 7, confirm its assignment to 31P. The maximum width of the signal, 0.5 MHz, is similar to that obtained by Zänker et al., for 5-doxyl-phosphocholine in a bilayer of unlabeled 1-palmitoyl-2-stearoyl-sn-glycero-3-phophocholine (75). There, simulations of the spectra yielded a maximum distance of 5.1 ± 0.5 Å, which we adopted as a crude higher limit. The spectrum of 7DSA in PC/PG shows a much weaker, hardly detectable signal. From these results we concluded that the carboxylate of 5DSA is, on the average, at the perimeter of the phosphate. The similarity between the 2H modulation results of DPPC/PG D2O and PC/PG in D2O suggests that the 5DSA location is the same in the two systems.
FIGURE 7.
The dependence of the frequency of the W-band Mims ENDOR 31P signal of 5DSA in PC/PG on the magnetic field. The solid line was calculated based on the gyromagnetic ratio of 31P. The inset on the left shows the echo detected EPR spectrum and the fields at which the ENDOR was measured. The inset on the right displays the ENDOR spectra of 5DSA and 7DSA in PC/PG recorded at a magnetic field corresponding maximum echo intensity.
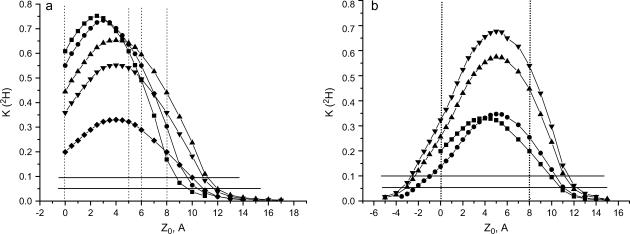
To further quantitate the location of the spin probes with respect to the surface of the membrane, obtained from K(2H) of DPPC-d13/PG, we used the theoretical model described in the Appendix. This model calculates the K(2H) value expected for an electron spin, situated at a distance z0 from the bottom of a deuterated layer with a thickness a and a homogenous distribution of deuterium nuclei with a density d. Fig. 8 a shows the dependence of K(2H) on z0 for several deuterated layers with different thicknesses and densities. As expected, the curve is symmetric about the center of the layer, and it falls off rather fast, such that for z0 > 13–14 Å, no modulation is observed. This translates into a distance of 6–8 Å from the boundaries (inner and outer) of the deuterated layer (depending on the thickness used) and sets the range of distances to which this methodology applies.
FIGURE 8.
Calculated K(2H) values as a function of z0 (the distance of the electron spin from the bottom of the layer) for several layer thicknesses, a, and densities, d, (a) for a homogeneous distribution, d = 0.055 n/A3, a = 5 Å (▪), d = 0.045 n/A3, a = 6 Å (•), d = 0.033 n/A3, a = 8 Å (▴), d = 0.025 n/A3, a = 8 Å (▾), d = 0.0125 n/A3, a = 8 Å (♦). (b) For a bimodal distribution with a = 8 Å and d = 0.0125 n/A3 (•), d = 0.025 n/A3 (▴), d = 0.033 n/A3 (▾). Here one of the traces for a homogeneous distribution (d = 0.0125 n/A3, (▪)) is shown for comparison. The vertical lines define the range of the layer for a = 5, 6, and 8 Å and the horizontal lines the experimental K(2H) values of 5DSA (upper) and 7DSA (lower).
The comparison of the experimental modulation depth of 5DSA and 7DSA in DPPC-d13/PG, 0.1 and 0.046, respectively (marked in Fig. 8 a by horizontal solid lines), with the calculated curves provides an estimated average distance from the boundaries of the layer (marked by the dotted vertical lines in Fig. 8), depending on the d and a values, as listed in Table 4. Taking into consideration the D2O modulation depth, the distances must be from the inner part of the layer. The average distance range for 5DSA is 2–3.8 Å and for 7DSA 3–4.6 Å. If the alkyl chains are tilted with respect to the surface (49,75), the relative distance of 2.6 Å between 5DSA and 7DSA nitroxide on the alkyl chain (49) translates into a shorter distance relative to the deuterated layer. For example, for a tilt of 57° the difference should be ∼1.4 Å, which is not much larger than the above estimates. The probability distribution functions for the different groups in DPPC membranes (49) show that that average position of the 31P is ∼1 Å below the choline. Hence, the distances we obtained are somewhat lower than expected from the 5DSA-31P distance estimated from the ENDOR measurements (≤5 Å). This may be a result of the crude model used, which assumed a constant density of deuterons in the layer, rather than a more complex realistic distribution. In addition, the 2H nuclear quadrupole interaction was not taken into account. This, however, would lead to a shorter rather than a larger distance. Similar calculations were not carried out for the DPPC/PG/D2O system because it should be described by a complicated model that includes specific and nonspecific interaction and a wide inhomogeneous layer.
TABLE 4.
The distance of the bottom of the deuterated layer to the NO group of 5DSA and 7DSA as determined from comparison of the experimental modulation depth in the DPPC-d13/PC with the calculated traces shown in Fig. 8
| Homogeneous
|
Distance 5DSA, Å
|
Distance 7DSA, Å
|
Inhomogeneous
|
Distance 5DSA, Å
|
Distance 7DSA, Å
|
||
|---|---|---|---|---|---|---|---|
| d, n/Å3 | a, Å | d, n/Å3 | a, Å | ||||
| 0.055 | 5 | 3.8 | 4.6 | – | – | – | – |
| 0.045 | 6 | 3.6 | 4.2 | – | – | – | – |
| 0.033 | 8 | 3.2 | 4.0 | 0.033 | 8 | 2.7 | 3.5 |
| 0.025 | 8 | 2.8 | 3.8 | 0.025 | 8 | 2.2 | 3.0 |
| 0.0125 | 8 | 2.0 | 3.0 | 0.0125 | 8 | 1.0 | 2.2 |
We also considered a nonhomogeneous distribution of the deuterons in the layer, accounting for the methyl groups in the top part and methylene groups in the bottom part. Taking a ratio of 9:4 in the densities of the upper and lower halves of the layer (keeping the total number of deuterons in the layer the same as for the symmetric case), we obtained the curves shown in Fig. 8 b for a layer of 8 Å. The average distances for 5DSA and 7DSA for this case are even shorter, 1–2.7 Å and 2.2–3.5 Å for 5DSA and 7DSA, respectively (see Table 4). The 31P ENDOR results imply that the homogeneous distribution seems more appropriate.
The effect of the peptide on the LUVs
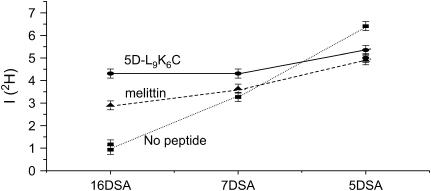
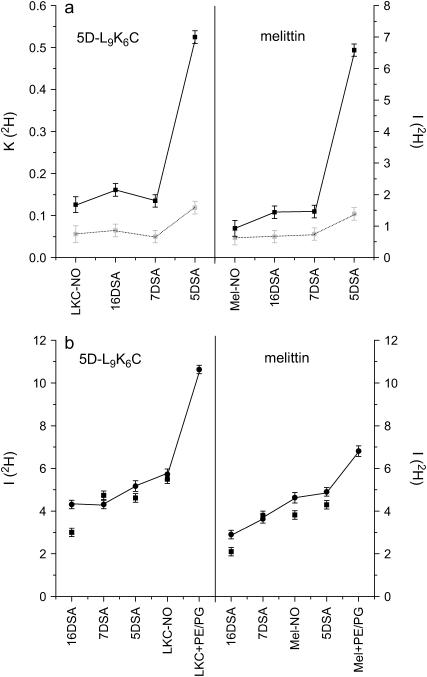
A comparison of the modulation depth of 5-, 7-, and 16DSA, with and without nonlabeled peptide, indicates compositional changes, primarily in the water density profile within the LUVs. The results of the PC/PG system for melittin and 5D-L9K6C are shown in Fig. 9 and a similar behavior was observed for DPPC/PG. The change in I(2H) shows that the presence of the peptides leads to a small decrease in the water exposure of 5DSA, and an increased exposure for 7DSA and 16DSA, with the latter experiencing the largest change. In addition, the effect of 5D-L9K6C is stronger than that of melittin. These changes are associated with a slight increase in I(2H) of DPPC-d13 for 5DSA and a decrease for 7DSA and 16DSA as shown by comparing Figs. 6 b and 10 a. From this we concluded that the peptide's interaction with the membrane changes the water density profile in the membrane, making it less steep. The water penetration into the hydrophobic part of the membrane increases, whereas its content is somewhat reduced at the hydrophilic part. The small increase in I(2H) of DPPC-d13 for 5DSA may be associated with a small increase in the lipid layer density due to the decrease in the water content in this hydrophilic region. This, however, should have led to an increase in I(2H) for 7DSA and 16DSA as well, which was not observed. An additional option is that there is a decrease in the average tilt angle of the alkyl chains, which will lead to a stronger reduction of I(2H) at the end of the chain because of the 1/r6 dependence.
FIGURE 9.
Comparison of the I(2H) values for 5DSA, 7DSA, and 16DSA in PG/PC/D2O LUVs without peptides (▪), with melittin (▴), and with 5D-L9K6C (•).
FIGURE 10.
(a) Comparison of the I(2H) (solid symbols, right axis) and K(2H) (shaded symbols, left axis) values for 5D-L9K6C-NO (LKC-NO) and melittin-NO (Mel-NO) in DPPC-d13/PG with those of 5DSA, 7DSA, and 16DSA in DPPC-d13/PG LUVs with 5D-L9K6C (left) and melittin (right). (b) Comparison of the I(2H) values for LKC-NO and Mel-NO in DPPC/PG/D2O (squares) with those of 5DSA, 7DSA, and 16DSA in DPPC/PG/D2O with 5D-L9K6C (left) and melittin (right). The circles (connected by a line) correspond to the same in a PC/PG/D2O system, including also melittin-NO and 5D-L9K6C-NO in PE/PG/D2O.
The location of the peptides
Initially we compared the modulation depth of the spin-labeled peptides with those of the soluble reference spin probes CAT1 and proxy in a D2O/glycerol-d3 (9:1) buffer solution without the LUVs, and the values obtained were all the same within the experimental error (K(2H) = 0.44 ± 0.015, I(2H) = 24 ± 0.2). This shows that, at least in solution, the size and conformation of the peptides do not significantly affect the exposure of the nitroxide group to the solvent. The appropriate reference system for locating the peptide with respect to the surface of the LUVs should include the peptide, because it is clear from the EPR and the ESEEM results that the peptides change the properties of the LUVs. Fig. 10 a compares the K(2H) and I(2H) values of melittin-NO in DPPC-d13/PG with those of 5-, 7-, and 16DSA in DPPC-d13/PG with a nonlabeled peptide. The trend observed is 5DSA ≫ 7DSA ∼ 16DSA > melittin-NO, whereas for both the DPPC/PG/D2O and PC/PG/D2O systems the trend is 5DSA ∼ melittin-NO > 7DSA > 16DSA (Fig. 10 b). This places the nitroxide group of melittin-NO at the outer surface of the LUVs. Yet the amount of water in its vicinity seems somewhat too low compared with 5DSA, which is well inside the membrane. This suggests a peptide conformation where the N-terminal is buried and less exposed to water. The behavior of 5D-L9K6C-NO, presented in Fig. 10, a and b, as well, is similar to that of melittin, with a generally larger modulation depth for 5D-L9K6C-NO in all systems.
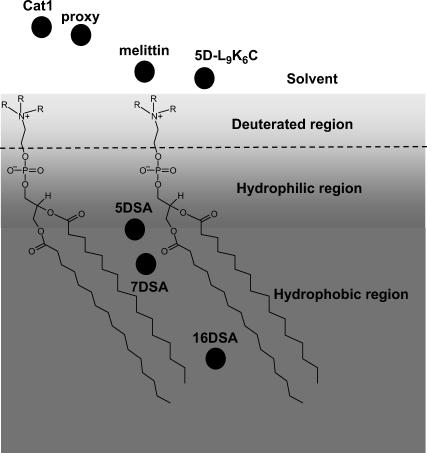
A comparison with the calculated curves of Fig. 8 yields for 5D-L9K6C-NO an average distance of 3–4 Å from the surface of an 8-Å layer for a homogeneous 2H distribution. For a layer divided into two sublayers with different densities the distance is 3–4.5 Å. For melittin the distances are slightly longer (by up to 0.5 Å). These distance estimates are derived from a model where the lateral distribution of the deuterons in the layer is homogeneous. However, an insertion of an α-helical peptide, with a radius of ∼4 Å, will result in a local depletion of deuterons in the layer. Although this local change will not have a considerable effect on the modulation of the 5-, 7- and 16DSA probes due to the low peptide concentration and the random distribution of the spin probes in the LUVs, it can significantly affect a spin label attached to the peptide that is close to this depleted region. The relatively large D2O modulation depth, however, makes this possibility of insertion of the N-termini less likely. This N-termini location at the outer surface of the membrane is also consistent with the relatively large motional freedom deduced from the EPR spectra. Fig. 11 shows a schematic representation of half of the LUVs bilayer with the positions of the various spin labels as determined from this work.
FIGURE 11.
A schematic representation of the relative location (•) of the nitroxide spin label in the reference probes on the labeled peptides with respect to the surface of the model membrane's layer.
Finally, the ESEEM of 5D-L9K6C-NO and melittin-NO added to PE/PG LUVs in D2O were measured as well. The I(2H) values were significantly higher than for the corresponding DPPC/PC and PC/PG systems, especially for 5D-L9K6C-NO, as shown in Fig. 10 b, indicating a higher water exposure. This is consistent with earlier studies (56) showing that the binding constant of melittin to PE/PG is weaker than the binding to PC/PG (53).
The orientation of melittin and the depth of its penetration in negatively charged membranes has been a subject of controversy. Whereas some reported that the peptide is located on the membrane surface with only hydrophobic residues inserted into the lipid bilayer, others showed that melittin is preferentially oriented parallel to the lipid chain (56,57,76). Our study supports a “carpet” mechanism for membrane disruption (8). According to this mechanism, peptides first bind to the phospholipids' membrane surface until a threshold concentration is reached, and only then do they permeate it in a detergent-like manner (15).
In this work we have concentrated on the establishment of a methodology and thereby focused only on the effect of the peptides on the LUVs and the location of the N-terminus of the peptides. Nevertheless, such studies can be extended in the future to other peptides and lipids, which are labeled and deuterated, respectively, at different positions, allowing us to locate the whole peptide within the membrane and obtain further insight into its mode of action. In terms of the model used to calculate the K(2H), it can be improved by representing density of deuterons with a probability distribution function obtained from MD simulation (49,77).
CONCLUSIONS
We have demonstrated a new approach, based on ESEEM measurements of selectively deuterated lipids, for studying peptide-membrane interactions. In the particular case used, the specific labeling of the polar head region with 13 deuterons, in combination with the use of deuterated water, allowed us to probe distances of up to ∼8 Å to the surface of the membrane and 6 Å to the phosphate region (from the hydrophobic region). The location of a set of reference probes provides a reference ruler that can be used for further studies. It was found that the N-terminus of both melittin and 5D-L9K6C are located in the solvent phase, and that the peptides acquire a conformation that reduced the exposure of the N-terminal to water, with the 5D-L9K6C N-terminal being more exposed. In addition, the binding of both peptides significantly changes the water density profile of the model membrane, making it “flatter” and increasing the water penetration depth, with 5D-L9K6C having a stronger effect. Finally, DPPC/PG and PC/PG were shown to behave similarly, both showing stronger binding of the peptides than a PE/PG membrane.
Acknowledgments
We thank Professor Lev Weiner for his help in the spin labeling of the peptides, and Itamar Proccacia from the Weizmann Institute of Science and Dr. Gunnar Jeschke (Max-Planck Institute for Polymer Research, Mainz, Germany) for useful discussions regarding the model calculations.
This research was partially supported by the Ilse Katz Institute for Material Sciences and Magnetic Resonance Research.
APPENDIX: CALCULATION OF MODULATION DEPTH
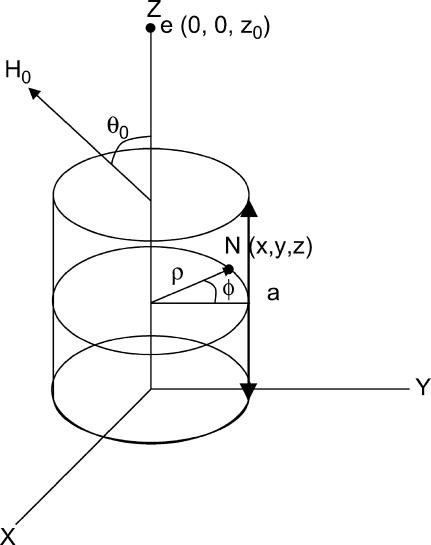
Here we present a model for calculating the modulation depth of an unpaired electron situated away from, or within, a layer of 2H nuclei. The approach is somewhat similar to that used for calculation of the 31P Mims ENDOR line shapes of a spin-labeled lipid in a model membrane (75), with the major difference that ESEEM is calculated, rather than ENDOR. It is assumed that the size of the LUV is considerably larger than the electron-nuclear distance and because of the 1/r6 dependence of the modulation depth, the curvature of the LUV surface can be neglected and treated as an “infinite” layer. Moreover, we assumed that the distribution of the 2H nuclei within the layer is homogeneous. Fig. A1 presents the geometry of the model, where the unpaired electron is on the Z axis (perpendicular to the layer) at position z0, the nucleus location is given by  where 0 < z < a, and a is the layer thickness. The orientation of the magnetic field, H0, with respect to the XYZ system is given by
  and the electron-nucleus distance r is r = [ρ2 + (z0 − z)2]0.5.
FIGURE A1.
The model for calculating K(2H) from a layer with a homogeneous distribution of deuterons.
The angle between the magnetic field and r,  is
is 
Because the positions of the 2H nuclei are not correlated, it is not necessary to consider both φ and  ; hence we set
  and the integration was carried out on φ only.
The three-pulse echo intensity for a single nucleus, neglecting relaxation, is (38,77)
 |
(A1) |
where for S = 1/2 and I = 1, neglecting the nuclear quadrupole interaction,
 |
(A2) |
 |
(A3) |
and
 |
 |
 |
In case of weak nonspecific interactions, the point dipole approximation applies and
 |
 |
For a nucleus at  and a H0 orientation of
  (for brevity, the T dependence is removed):
 |
(A4) |
and the normalized echo intensity for a single nucleus that can be anywhere within the layer, is
 |
(A5) |
and the expression for  is similar, just exchanging α with β. P(ρ) is the probability of finding the nucleus at ρ and is given by
  where d is the nuclei density. For n nuclei the echo intensity is given by (78):
 |
(A6) |
Hence, for two nuclei:
 |
(A7) |
Because the nuclear positions are independent, integration can be carried out on each nucleus separately yielding
 |
(A8) |
The latter approximation relies on the spherical model of Kevan and co-workers (38) and stems from  being a function of the type (1-ɛ), where ɛ ≪ 1. Analogously, for n nuclei, we obtain
 |
(A9) |
where  and v is the volume of the layer. After inclusion of the Vβ term the final expression becomes:
 |
(A10) |
The integration limits of z were taken from 0 to the layer thickness a, and the values tested were 5, 6, and 8 Å. The value ρ was integrated from 0 to 40 Å, where the upper value was determined by checking for convergence. We added the limit of a minimum r of 2.5 Å imposed by steric constraints. The integration limits for φ and θ0 were 0–2 and 0–
 respectively.
Both the density and the thickness of the deuterated layer are unknown and have to be evaluated. The lower limit of a is obtained by taking the length of the fragment (CD3)3NCD2CD2. The lower limit of d was obtained by dividing the number of deuterons in the fragment, 13, by its volume, taking into account the relative content of the deuterated lipid, 70% in our case. This yields a maximum value of 0.055 deuterons/Å3. In reality, this part of the membranes also contains water and has elements of disorder. Hence, we also calculated the modulation depth for lower densities. Molecular dynamics simulations (77) reported a width of 10–13 Å for the interface, from which a value of 8 Å for the deuterated section is reasonable (75,77).
References
- 1.Boman, H. G. 1995. Peptide antibiotics and their role in innate immunity. Annu. Rev. Immunol. 13:61–92. [DOI] [PubMed] [Google Scholar]
- 2.Nicolas, P., and A. Mor. 1995. Peptides as weapons against microorganisms in the chemical defense system of vertebrates. Annu. Rev. Microbiol. 49:277–304. [DOI] [PubMed] [Google Scholar]
- 3.Hancock, R. E., and G. Diamond. 2000. The role of cationic antimicrobial peptides in innate host defences. Trends Microbiol. 8:402–410. [DOI] [PubMed] [Google Scholar]
- 4.Brotz, H., and H. G. Sahl. 2000. New insights into the mechanism of action of lantibiotics: diverse biological effects by binding to the same molecular target. J. Antimicrob. Chemother. 46:1–6. [DOI] [PubMed] [Google Scholar]
- 5.Zasloff, M. 2002. Antimicrobial peptides of multicellular organisms. Nature. 415:389–395. [DOI] [PubMed] [Google Scholar]
- 6.Lehrer, R. I., and T. Ganz. 1999. Antimicrobial peptides in mammalian and insect host defence. Curr. Opin. Immunol. 11:23–27. [DOI] [PubMed] [Google Scholar]
- 7.Hoffmann, J. A., F. C. Kafatos, C. A. Janeway, and R. A. Ezekowitz. 1999. Phylogenetic perspectives in innate immunity. Science. 284:1313–1318. [DOI] [PubMed] [Google Scholar]
- 8.Shai, Y. 2002. Mode of action of membrane active antimicrobial peptides. Biopolymers. 66:236–248. [DOI] [PubMed] [Google Scholar]
- 9.Zasloff, M. 1987. Magainins, a class of antimicrobial peptides from xenopus skin: isolation, characterization of two active forms, and partial cDNA sequence of a precursor. Proc. Natl. Acad. Sci. USA. 84:5449–5453. [DOI] [PMC free article] [PubMed] [Google Scholar]
- 10.Mor, A., V. H. Nguyen, A. Delfour, D. Migliore-Samour, and P. Nicolas. 1991. Isolation, amino acid sequence and synthesis of dermaseptin, a novel antimicrobial peptide of 5D–L9K6Chibian skin. Biochemistry. 30:8824–8830. [DOI] [PubMed] [Google Scholar]
- 11.Steiner, H., D. Hultmark, A. Engstrom, H. Bennich, and H. G. Boman. 1981. Sequence and specificity of two antibacterial proteins involved in insect immunity. Nature. 292:246–248.7019715 [Google Scholar]
- 12.Zanetti, M., R. Gennaro, B. Skerlavaj, L. Tomasinsig, and R. Circo. 2002. Cathelicidin peptides as candidates for a novel class of antimicrobials. Curr. Pharm. Des. 8:779–793. [DOI] [PubMed] [Google Scholar]
- 13.Lehrer, R. I., and T. Ganz. 2002. Cathelicidins: a family of endogenous antimicrobial peptides. Curr. Opin. Hematol. 9:18–22. [DOI] [PubMed] [Google Scholar]
- 14.Mangoni, M. L., A. C. Rinaldi, A. Di Giulio, G. Mignogna, A. Bozzi, D. Barra, and M. Simmaco. 2000. Structure-function relationships of temporins, small antimicrobial peptides from amphibian skin. Eur. J. Biochem. 267:1447–1454. [DOI] [PubMed] [Google Scholar]
- 15.Shai, Y. 1999. Mechanism of the binding, insertion and destabilization of phospholipid bilayer membranes by α-helical antimicrobial and cell non-selective membrane-lytic peptides. Biochim. Biophys. Acta. 1462:55–70. [DOI] [PubMed] [Google Scholar]
- 16.Matsuzaki, K., K. Sugishita, and K. Miyajima. 1999. Interactions of an antimicrobial peptide, magainin 2, with lipopolysaccharide-containing liposomes as a model for outer membranes of Gram-negative bacteria. FEBS Lett. 449:221–224. [DOI] [PubMed] [Google Scholar]
- 17.Tossi, A., L. Sandri, and A. Giangaspero. 2000. Amphipathic, α-helical antimicrobial peptides. Biopolymers. 55:4–30. [DOI] [PubMed] [Google Scholar]
- 18.Bechinger, B. 2000. Biophysical investigations of membrane perturbations by polypeptides using solid-state NMR spectroscopy (review). Mol. Membr. Biol. 17:135–142. [DOI] [PubMed] [Google Scholar]
- 19.Dathe, M., and T. Wieprecht. 1999. Structural features of helical antimicrobial peptides: their potential to modulate activity on model membranes and biological cells. Biochim. Biophys. Acta. 1462:71–87. [DOI] [PubMed] [Google Scholar]
- 20.Dempsey, C. E., and A. Watts. 1987. A deuterium and phosphorus-31 nuclear magnetic resonance study of the interaction of melittin with dimyristoylphosphatidylcholine bilayers and the effects of contaminating phospholipase A2. Biochemistry. 26:5803–5811. [DOI] [PubMed] [Google Scholar]
- 21.Schroder-Borm, H., R. Willumeit, K. Brandenburg, and J. Andra. 2003. Molecular basis for membrane selectivity of NK-2, a potent peptide antibiotic derived from NK-lysin. Biochim. Biophys. Acta. 1612:164–171. [DOI] [PubMed] [Google Scholar]
- 22.Rapaport, D., and Y. Shai. 1992. Aggregation and organization of pardaxin in phospholipid membranes. A fluorescence energy transfer study. J. Biol. Chem. 267:6502–6509. [PubMed] [Google Scholar]
- 23.Tachi, T., R. F. Epand, R. M. Epand, and K. Matsuzaki. 2002. Position-dependent hydrophobicity of the antimicrobial magainin peptide affects the mode of peptide-lipid interactions and selective toxicity. Biochemistry. 41:10723–10731. [DOI] [PubMed] [Google Scholar]
- 24.Gazit, E., A. Boman, H. G. Boman, and Y. Shai. 1995. Interaction of the mammalian antibacterial peptide cecropin P1 with phospholipid vesicles. Biochemistry. 34:11479–11488. [DOI] [PubMed] [Google Scholar]
- 25.Hong, J., Z. Oren, and Y. Shai. 1999. Structure and organization of hemolytic and nonhemolytic diastereomers of antimicrobial peptides in membranes. Biochemistry. 38:16963–16973. [DOI] [PubMed] [Google Scholar]
- 26.Glenn, A. O., and H. W. Huang. 1988. Circular dichroism of oriented α-helices. I. Proof of the exciton theory. J. Chem. Phys. 89:2531–2538. [Google Scholar]
- 27.Bolen, J. E., and W. P. Holloway. 1990. Quenching of tryptophan fluorescence by brominated phospholipid. Biochemistry. 29:9638–9643. [DOI] [PubMed] [Google Scholar]
- 28.Cooper, L. J. N., D. Robertson, R. Granzow, and N. S. Greenspan. 1995. Variable domain-identical antibodies exhibit IgG subclass-related differences in affinity and kinetic constants as determined by surface plasmon resonance. Mol. Immunol. 31:577–584. [DOI] [PubMed] [Google Scholar]
- 29.Rock, F. L., D. Peterson, B. C. Weig, R. A. Kastelein, and J. F. Bazan. 1996. Binding of leptin to the soluble ectodomain of recombinant leptin receptor: a kinetic analysis by surface plasmon resonance. Horm. Metab. Res. 28:748–750. [DOI] [PubMed] [Google Scholar]
- 30.Yamaguchi, S., T. Hong, A. Waring, R. I. Lehrer, and M. Hong. 2002. Solid-state NMR investigations of peptide-lipid interaction and orientation of a ss-sheet antimicrobial peptide, protegrin. Biochemistry. 41:9852–9862. [DOI] [PubMed] [Google Scholar]
- 31.Hunter, H., W. Jing, D. J. Schibli, T. Trinh, I. Y. Park, S. C. Kim, and H. J. Vogel. 2005. Interactions of the antimicrobial peptide Ac-FRWWHR-NH2 with model membrane systems and bacterial cells. Biochim. Biophys. Acta. 1668:175–189. [DOI] [PubMed] [Google Scholar]
- 32.Friedrich, C. L., A. Rozek, A. Patrzykat, and R. E. Hancock. 2001. Structure and mechanism of action of an indolicidin peptide derivative with improved activity against gram-positive bacteria. J. Biol. Chem. 276:24015–24022. [DOI] [PubMed] [Google Scholar]
- 33.Zhan, H., J. K. Oh, Y. K. Shin, W. L. Hubbell, and J. R. Collier. 1995. Interaction of the isolated transmembrane domain of diphtheria toxin with membranes. Biochemistry. 34:4856–4863. [DOI] [PubMed] [Google Scholar]
- 34.Glasgow, B. J., O. K. Gasymov, A. R. Abduragimov, T. N. Yusifov, C. Altenbach, and W. L. Hubbell. 1999. Side chain mobility and ligand interactions of the G strand of tear lipocalins by site-directed spin labeling. Biochemistry. 38:13707–13716. [DOI] [PubMed] [Google Scholar]
- 35.Oh, J. K., H. Zhan, C. Cui, C. Altenbach, W. L. Hubbell, and J. R. Collier. 1999. Conformation of the diphtheria toxin T domain in membranes: a site-directed spin-labeling study of the TH8 helix and TL5 loop. Biochemistry. 38:10336–10343. [DOI] [PubMed] [Google Scholar]
- 36.Hung, C. S., W. Wang, I. S. Chan, and M. H. Chen. 1999. Membrane lysis by the antibacterial peptides cecropins B1 and B3: a spin-label electron spin resonance study on phospholipid bilayers. Biophys. J. 77:3120–3133. [DOI] [PMC free article] [PubMed] [Google Scholar]
- 37.Fanucci, E. G., A. K. Coggshall, N. Cadieux, M. Kim, J. R. Kadner, and S. D. Cafiso. 2003. Substrate-induced conformational changes of the periplasmic N-terminus of an outer-membrane transporter by site-directed spin labeling. Biochemistry. 42:1391–1400. [DOI] [PubMed] [Google Scholar]
- 38.Kevan, L. 1979. Modulation of electron spin-echo decay in solids. In Time Domain Electron Spin Resonance. L. Kevan, and R. N. Schwartz, editors. John Wiley & Sons, New York. 279–341.
- 39.Schweiger, A., and G. Jeschke. 2001. Principles of Pulse Electron Paramagnetic Resonance. Oxford University Press, New York.
- 40.Dikanov, S. A., and Yu. D. Tsvetkov. 1992. Electron Spin-Echo Envelope Modulation (ESEEM) Spectroscopy. CRC Press, Boca Raton, FL.
- 41.Kang, Y. S., and L. Kevan. 1994. Interaction of poly-(ethylene oxide) with the sodium dodecyl sulfate micelle interface studied with nitroxide spin probes. J. Phys. Chem. 98:7624–7627. [Google Scholar]
- 42.Stenland, C., and L. Kevan. 1994. Electron spin resonance and electron spin echo modulation studies of the photoionization of N-Alkyl-N,N′,N′-trimethylbenzidines in anionic, zwitterionic, and cationic vesicles: correlation of photoproduced cation location with the photoyield. Langmuir. 10:1129–1133. [Google Scholar]
- 43.Kursev, V. V., and L. Kevan. 1995. Electron spin echo modulation studies of doxylstearic acid spin probes in frozen vesicle solutions: interaction of the spin probe with 31P in the surfactant headgroups. J. Phys. Chem. 99:10616–10620. [Google Scholar]
- 44.Baglioni, P., and L. Kevan. 1987. Structural effects of alcohol addition to sodium dodecyl sulfate micelles studied by electron spin-echo modulation of 5-doxylstearic acid spin probe. J. Phys. Chem. 91:1516–1518. [Google Scholar]
- 45.Hiff, T., and L. Kevan. 1989. Electron spin echo modulation studies of doxylstearic acid spin probes in frozen vesicles: interaction of the spin probe with water-d2 and effects of cholesterol addition. J. Phys. Chem. 93:1572–1575. [Google Scholar]
- 46.Bartucci, R., R. Guzzi, D. Marsh, and L. Sportelli. 2003. Intramembrane polarity by electron spin echo spectroscopy of labeled lipids. Biophys. J. 84:1025–1030. [DOI] [PMC free article] [PubMed] [Google Scholar]
- 47.Erilov, D. A., R. Bartucci, R. Guzzi, A. A. Shubin, A. G. Maryasov, D. Marsh, S. A. Dzuba, and L. Sportelli. 2005. Water concentration profiles in membranes measured by ESEEM of spin-labeled lipids. J. Phys. Chem. B. 109:12003–12013. [DOI] [PubMed] [Google Scholar]
- 48.Hubbell, W. L., A. Gross, R. Langen, and A. M. Lietzow. 1998. Recent advances in site-directed spin labeling of proteins. Curr. Opin. Struct. Biol. 8:649–656. [DOI] [PubMed] [Google Scholar]
- 49.Nagle, J., and S. Tristan-Nagle. 2000. Structure of lipid bilayers. Biochim. Biophys. Acta. 1469:159–195. [DOI] [PMC free article] [PubMed] [Google Scholar]
- 50.Ladokhin, S. A. 2000. Flourescence spectroscopy in peptide and protein analysis. In Encyclopedia of Analytical Chemistry. R. A. Meyers, editor. John Wiley & Sons, Chichester, UK. 5672–5779.
- 51.Habermann, E., and J. Jentsch. 1967. Sequenzanalyse des melittins aus den tryptischen und peptischen spaltstücken. [in German]. Hoppe Seylers Z. Physiol. Chem. 348:37–50. [PubMed] [Google Scholar]
- 52.Vogel, H., and F. Jahnig. 1986. The structure of melittin in membranes. Biophys. J. 50:573–582. [DOI] [PMC free article] [PubMed] [Google Scholar]
- 53.Beschiaschvili, G., and J. Seelig. 1990. Melittin binding to mixed phosphatidylglycerol/phosphatidylcholine membranes. Biochemistry. 29:52–58. [DOI] [PubMed] [Google Scholar]
- 54.Marsh, D. 1996. Peptide models for membrane channels. Biochem. J. 315:345–361. [DOI] [PMC free article] [PubMed] [Google Scholar]
- 55.Papo, N., Z. Oren, U. Pag, G. H. Sahl, and Y. Shai. 2002. The consequence of sequence alteration of an amphipathic α-helical antimicrobial peptide and its diastereomers. J. Biol. Chem. 277:33913–33921. [DOI] [PubMed] [Google Scholar]
- 56.Papo, N., and Y. Shai. 2003. Exploring peptide membrane interaction using surface plasmon resonance: differentiation between pore formation versus membrane disruption by lytic peptides. Biochemistry. 42:458–466. [DOI] [PubMed] [Google Scholar]
- 57.Ladokhin, S. A., and S. H. White. 2001. “Detergent-like” permeabilization of anionic lipid vesicles by melittin. Biochim. Biophys. Acta. 1514:253–260. [DOI] [PubMed] [Google Scholar]
- 58.Yang, L., T. A. Harroun, T. M. Weiss, L. Ding, and H. W. Huang. 2001. Barrel-stave model or toroidal model? A case study on melittin pores. Biophys. J. 81:1475–1485. [DOI] [PMC free article] [PubMed] [Google Scholar]
- 59.Verhoeven, A., T. F. P. Williamson, H. Zimmermann, M. Ernst, and B. Meier. 2004. Rotational-resonance distance measurements in multi-spin systems. J. Magn. Reson. 168:314–326. [DOI] [PubMed] [Google Scholar]
- 60.Eibl, H. 1978. Phospholipid synthesis: oxazaphospholanes and dioxaphospholanes as intermediates. Proc. Natl. Acad. Sci. USA. 75:4074–4077. [DOI] [PMC free article] [PubMed] [Google Scholar]
- 61.Merrifield, R. B., L. D. Vizioli, and H. G. Boman. 1982. Synthesis of the antibacterial peptide cecropin A(1–33). Biochemistry. 21:5020–5031. [DOI] [PubMed] [Google Scholar]
- 62.Gerber, D., and Y. Shai. 2000. Insertion and organization within membranes of the δ-endotoxin pore-forming domain, helix 4-loop-helix 5, and inhibition of its activity by a mutant helix 4 peptide. J. Biol. Chem. 275:23602–23607. [DOI] [PubMed] [Google Scholar]
- 63.Kiger, Y., A. Aharoni, D. Rapaport, P. Jones, R. Blumenthal, and Y. Shai. 1997. Fusion peptides derived from the HIV type 1 glycoprotein 41 associate within phospholipid membranes and inhibit cell-cell fusion. Structure-function study. J. Biol. Chem. 272:13496–13505. [DOI] [PubMed] [Google Scholar]
- 64.Papo, N., and Y. Shai. 2004. Effect of drastic sequence alteration and D-amino acid incorporation on the membrane binding behavior of lytic peptides. Biochemistry. 43:6393–6403. [DOI] [PubMed] [Google Scholar]
- 65.Fauth, J. M., A. Schweiger, L. Braunschweiler, J. Forrer, and R. R. Ernst. 1986. Elimination of unwanted echoes and reduction of dead time in three-pulse electron spin-echo spectroscopy. J. Magn. Reson. 66:74–85. [Google Scholar]
- 66.Van Doorslaer, S., G. A. Sierra, and A. Schweiger. 1999. Dead time-dependent line distortions in absolute-value electron spin echo envelope modulation spectra. J. Magn. Reson. 136:152–158. [DOI] [PubMed] [Google Scholar]
- 67.Gromov, I., V. Krymov, P. Manikandan, D. Arieli, and D. Goldfarb. 1999. A W-band pulsed ENDOR spectrometer: setup and application to transition metal centers. J. Magn. Reson. 139:8–17. [DOI] [PubMed] [Google Scholar]
- 68.Mims, W. B. 1965. Pulsed ENDOR experiments. Proc. R. Soc. Lond. 283:452–457. [Google Scholar]
- 69.Freed, H. J. 1976. Spin Labeling Theory and Applications, Chapter 3. J. L. Berliner, editor. Academic Press, New York.
- 70.Mozsolits, H., H. J. Wirth, J. Werkmeister, and M. I. Aguilar. 2001. Analysis of surface plasmon resonance. Biochim. Biophys. Acta. 1512:64–76. [DOI] [PubMed] [Google Scholar]
- 71.Altenbach, C., and W. Hubbell. 1988. The aggregation state of spin-labeled melittin in solution and bound to phospholipid membranes: evidence that membrane-bound melittin is monomeric. Proteins. 3:230–242. [DOI] [PubMed] [Google Scholar]
- 72.Kleinschmidt, J. H., J. E. Mahaney, D. D. Thomas, and D. Marsh. 1997. Interaction of bee venom melittin with zwitterionic and negatively charged phospholipid bilayers: a spin-label electron spin resonance study. Biophys. J. 72:767–778. [DOI] [PMC free article] [PubMed] [Google Scholar]
- 73.Vishnyakova, E. A., A. E. Ruuge, E. A. Golovina, F. A. Hoekstra, and A. N. Tikhonov. 2000. Spin-labeling study of membranes in wheat embryo axes. 1. Partitioning of doxyl stearates into the lipid domains. Biochim. Biophys. Acta. 1467:380–394. [DOI] [PubMed] [Google Scholar]
- 74.Alminana, N., M. A. Alsina, M. Espina, and F. Reig. 2003. Synthesis and physicochemical study of the laminin active sequence: SIKVAV. J. Colloid and Interface Sci. 263:432–440. [DOI] [PubMed] [Google Scholar]
- 75.Zänker, P. P., G. Jeschke, and D. Goldfarb. 2005. Distance measurements between paramagnetic centers and a planar object by matrix Mims ENDOR. J. Chem. Phys. 122:024515/1–024515/11 [DOI] [PubMed] [Google Scholar]
- 76.Altenbach, C., W. Froncisz, J. S. Hyde, and W. Hubbell. 1989. Conformation of spin-labeled melittin at membrane surfaces investigated by pulse saturation recovery and continuous wave power saturation electron paramagnetic resonance. Biophys. J. 56:1183–1191. [DOI] [PMC free article] [PubMed] [Google Scholar]
- 77.Bachar, M., and O. M. Becker. 1999. Melittin at a membrane/water interface: effects on water orientation and water penetration. J. Chem. Phys. 111:8672–8685. [Google Scholar]
- 78.Dikanov, S. A., A. A. Shubin, and V. N. Parmon. 1981. Modulation effects in the electron spin echo resulting from hyperfine interaction with a nucleus of an arbitrary spin. J. Magn. Reson. 42:474–487. [Google Scholar]


