Abstract
In this study, we examine the relationships between the structure and stability of five related collagen-like molecules that have hydroxyproline residues occupying positions not observed in vertebrate collagen. Two of the molecules contain valine or threonine and form stable triple helices in water. Three of the molecules contain allo-threonine (an enantiomer of threonine), serine, or alanine, and are not stable. Using molecular dynamics simulation methods, we examine possible explanations for the stability difference, including considering the possibility that differences in solvent shielding of the essential interchain hydrogen bonds may result in differences in stability. By comparing the structures of threonine- and allo-threonine-containing molecules in six polar and nonpolar solvation conditions, we find that solvent shielding is not an adequate explanation for the stability difference. A closer examination of the peptides shows that the structures of the unstable molecules are looser, having weaker intermolecular hydrogen bonds. The weakened hydrogen bonds result from extended Yaa residue Ψ-angles that prevent optimal geometry. The Φ−Ψ-maps of the relevant residues suggest that each residue's most favorable Ψ-angle determines the corresponding collagen-like molecule's stability. Additionally, we propose that these molecules illustrate a more general feature of triple-helical structures: interchain hydrogen bonds are always longer and weaker than ideal, so they are sensitive to relatively small changes in molecular structure. This sensitivity to small changes may explain why large stability differences often result from seemingly small changes in residue sequence.
INTRODUCTION
Collagen is the most abundant protein in humans and other vertebrates, accounting for ∼¼ of our total protein mass. Fibrillar collagen molecules, the most commonly occurring type of collagen, adopt long, rope-like structures consisting of three peptide chains twisted around each other to form triple-helical molecules. The total size of the triple-helix varies, but typically contains ∼3000 residues. Collagen molecules assemble to form the basic structural matrices upon which bones, tendons, and extracellular matrices are built (1,2).
As a result of collagen's essential role in the physiology of higher animals, there is considerable interest in learning more about its structure and stability. Because it is physically large, performing atomic level studies of native collagen molecule is difficult. Thus, many studies use model collagen-like peptides that consist of ∼30 residues per chain. For example, Bachinger (3,4), Brodsky (5–7), and Raines (8–10) have examined collagen stability and how it is affected by variations in the residue sequence. Our own studies (11–15) have used molecular dynamics methods to examine atomic level structural and dynamic details of collagen-like peptides that are unavailable to experimentalists.
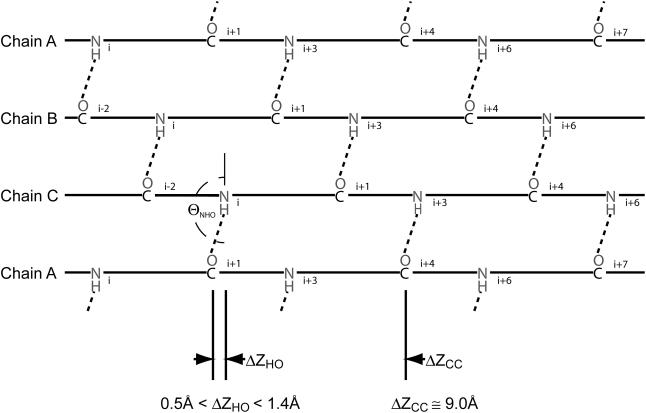
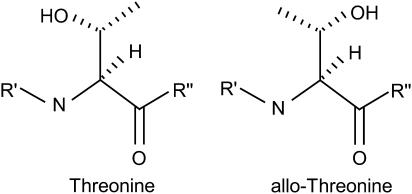
In our most recent study (15), we showed that the average strength of interchain hydrogen bonds (as measured by length) stabilizing the triple helix (for a schematic representation of interchain collagen hydrogen bonds, see Fig. 1) varies based on the residue sequence. Here, we further examine how residue sequence affects the structure and stability of collagen-like molecules by focusing on five related peptides that form triple helices and have been experimentally examined by Mizuno et al. (3). The peptides are structurally very similar but differ greatly in stability (see Table 1). Each is capped with neutral end groups and consists of a series of repeating residue triples, (Gly-Hyp-Yaa†)n, where the Hyp residues are 4(R)-hydroxyproline and the Yaa residues are valine and threonine for peptides that form stable molecules in water and allo-threonine, serine, and alanine for the remaining peptides (for example, [Ace-(Gly-Hyp-Thr)10-NMe]3 is stable in water, and [Ace-(Gly-Hyp-allo-Thr)10-NMe]3 is not). In the first part of this study we focus on the threonine- and allo-threonine-containing triple-helices because of the similarities in their structure. These two structures differ only in the chirality of the Yaa residue's β-carbon, which is solvent-exposed and not well positioned to interact with other parts of the molecule (see scheme 1).
FIGURE 1.
Schematic view of interchain hydrogen-bonding patterns. Hydrogen bonds between the three chains are shown (chain A is shown twice to capture the cyclic nature of the hydrogen-bonding pattern). Shown are the z axis offset (ΔZHO), hydrogen-bond angle (ΘNHO), and the z axis distance between adjacent Xaa residue carbonyl carbons (ΔZcc). Note that the z axis offset always places the hydrogen-bond donor C-terminal to the hydrogen-bond acceptor.
TABLE 1.
Experimental stability for five collagen-like molecules
SCHEME 1.
Short test simulations and visual inspection give no clear indication of what causes the stability difference between the two molecules. The structures look the same, and the residue side chains do not form intramolecular hydrogen bonds. Our earlier work suggested that the strength of the interchain backbone-backbone hydrogen bonds varies depending on local sequence, and so we looked more closely at these hydrogen bonds as well as other features of the triple-helical structure.
METHODS
Molecular dynamics simulations were performed using the Sander module of the AMBER 7 (16) molecular simulation package and the Cornell et al. force field (17). Parameters for the hydroxyproline residue were derived by Mooney et al. (14), and allo-threonine parameters are identical to threonine parameters. The peptides were capped with acetyl and N-methylamine end groups. The initial structures were generated using Gencollagen (18). The SHAKE algorithm was used to fix the lengths of all covalent bonds involving hydrogen atoms to their equilibrium distances. A 2.0 fs time step was used in all simulations, where each simulation was 5 ns in length. Electrostatic and van der Waals interactions were truncated at 12 Å (particle-mesh Ewald methods were not used). Molecular coordinates were saved periodically, and all structural calculations were based on these coordinate sets.
Explicit solvent calculations were performed using periodic boundary conditions with a box size of ∼55 × 55 × 125 Å. For the water simulations, ∼10,000 TIP3P water molecules were used (19). For the methanol simulations, ∼4000 methanol molecules with parameters developed by Caldwell and Kollman (17) were used. For the chloroform simulations, ∼3400 chloroform molecules were used. The Berendsen temperature and pressure coupling methods (20) were used to maintain constant temperature and pressure. Coordinate sets were saved every 20 ps. All simulations were done on an SGI Origin 3800 class supercomputer. The total CPU time for the data collection portion of the simulations was ∼3500, 3000, and 1300 processor hours for the water, methanol, and chloroform molecules, respectively.
Implicit solvent calculations were performed using the generalized Born solvation model developed by Onufriev et al. (21,22). For water, an ion concentration of 0.2 M was used. For the low dielectric implicit solvent, a dialectic constant of 1.0 was used with zero ion concentration. To maintain a constant temperature, velocities of each atom were randomly reassigned from a Maxwellian distribution every 5 ps. Coordinate sets were saved every 2 ps. The total CPU time for the data collection portion of each of these simulations was ∼480 processor-hours on an SGI Origin 3800 class supercomputer. The in vacuo calculations were performed in a similar manner. We did not attempt to model solvent here; therefore a distance-dependent dielectric was not used.
Simulations of the 20 host-guest peptides (6) were performed using implicit solvent, in the same manner as described above. Each molecule was of the form [Ace-(Gly-Pro-Hyp)3-(Gly-Pro-Yaa)-(Gly-Pro-Hyp)4-Gly-Gly-NH2]3, where Yaa represents the naturally occurring amino acids including hydroxyproline, but excluding proline.
The Φ−Ψ-maps for the five individual residues were determined from 10 ns simulations of each residue capped with neutral acetyl and N-methylamine end groups using the implicit water model described above. To maximize the efficiency of the calculations, the Φ−Ψ-angles were constrained to the relevant region of −100° ≤ Φ ≤ −20° and 0° ≤ Ψ ≤ 180°, using harmonic constraints outside this region. (Note: no constraints were used for any conformation within the plot region; thus, the constraints do not affect these results.) Atomic coordinates were saved every 20 fs (for a total of 500,000 saved conformations per simulation) and used to calculate the maps.
The structural properties were calculated using a suite of programs written by the authors. Hydrogen-bond energies were calculated using the method described by Kabsch and Sander (23). Since the terminal residues are often disordered, hydrogen bonds involving the two glycines nearest each end of each peptide were excluded from the calculations. The plots were done using MATLAB (The MathWorks, Natick, MA) and Microsoft Excel.
RESULTS
Mizuno et al. proposed that the differences in stability between the subject molecules may result from differences in the ability of the residue's side chains to shield the essential interchain hydrogen bonds from solvent (3). Their results are summarized in Table 1. We began our study to test this theory by examining differences in the threonine and allo-threonine structures and hydrogen-bond strength for the molecules in various solvents. For each of these molecules, 5 ns simulations were performed using a total of six different solvation conditions: explicit water, explicit methanol, explicit chloroform, implicit water (using the Born solvation model), implicit low-dielectric solvent (abbreviated LDS, using the Born solvation model with ɛ = 1.0), and no solvent (in vacuo calculation). All structures showed the typical triple-helical hydrogen-bonding pattern (see Fig. 1). For each molecule, the structural features were relatively constant over the course of the simulation. No side-chain groups were seen forming stable interchain hydrogen bonds in any of the simulations. The hydrogen-bonding statistics for these simulations are summarized in Table 2.
TABLE 2.
Backbone-backbone (Gly-to-Xaa) hydrogen-bond strength for threonine- and allo-threonine-containing molecules
| H-bond energy (kcal/mol)
|
H-bond frequency
|
Average H-bond length (Å)
|
|||||||
|---|---|---|---|---|---|---|---|---|---|
| Simulation type | [(GOT)10]3 | [(GOaT)10]3 | Δ Value | [(GOT)10]3 | [(GOaT)10]3 | Δ Value | [(GOT)10]3 | [(GOaT)10]3 | Δ Value |
| Explicit water | −2.25 | −1.68 | −0.57 | 0.82 | 0.58 | 0.23 | 2.05 | 2.19 | −0.14 |
| Explicit methanol | −2.39 | −1.77 | −0.62 | 0.90 | 0.62 | 0.27 | 1.99 | 2.19 | −0.20 |
| Explicit chloroform | −2.37 | −1.60 | −0.77 | 0.91 | 0.33 | 0.58 | 2.00 | 2.71 | −0.71 |
| Implicit water | −1.71 | −1.31 | −0.40 | 0.50 | 0.27 | 0.23 | 2.27 | 2.45 | −0.18 |
| Implicit LDS | −1.69 | −1.13 | −0.56 | 0.54 | 0.31 | 0.24 | 2.21 | 2.42 | −0.21 |
| In vacuo | −1.60 | −1.15 | −0.45 | 0.54 | 0.31 | 0.23 | 2.23 | 2.41 | −0.18 |
| Average | −2.00 | −1.44 | −0.56 | 0.70 | 0.40 | 0.30 | 2.13 | 2.40 | −0.27 |
Hydrogen-bond strength for the two molecules in six solvents is given using three metrics: The first is an estimate of the average hydrogen-bond energy calculated using the DSSP program and protocol developed by Kabsch and Sander (23). The second is the average fraction of time that the hydrogen-bond lengths are ≤2.2 Å. The third is the average hydrogen-bond length (H to O distance) for all interchain hydrogen-bonding pairs in all saved coordinate sets. The Δ-value columns give the difference between the two molecules. The low dielectric solvent label is abbreviated LDS.
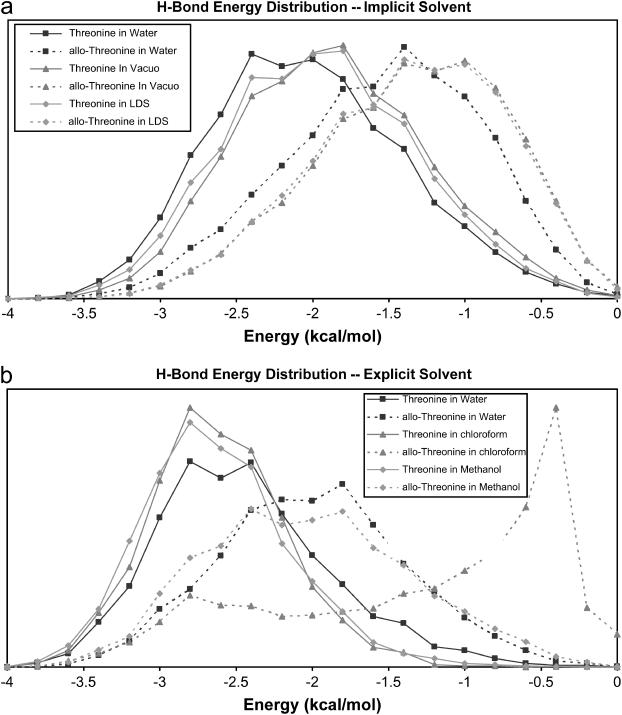
Table 2 shows average hydrogen-bond strength using three metrics. The first metric is average hydrogen-bond energy, calculated for each of the saved structures using the DSSP program and protocol developed by Kabsch and Sander (23). The second metric is average frequency of interchain hydrogen bonds, which is calculated by determining the average fraction of time that putative hydrogen bonds are 2.2 Å in length or shorter. The third metric is average interchain hydrogen-bond length defined as the distance from the hydrogen atom to the oxygen atom. Fig. 2, a and b, details the hydrogen-bonding energies by showing their distribution for each of the molecules in each solvent.
FIGURE 2.
Hydrogen-bond energy for [(GOT)n]3 and [(GOaT)n]3 simulations. Probability density functions for hydrogen-bond energies for simulations using implicit solvent models (a) and simulations using explicit solvent models (b). Threonine and allo-Threonine data are shown as solid and broken lines, respectively. The low dielectric solvent label is abbreviated LDS.
For all features in Table 2, there are clear differences between the molecules regardless of the solvent used. In all cases, the threonine-containing molecule shows stronger hydrogen bonds than does the allo-threonine-containing molecule. The same trend is evident in Fig. 2, a and b, which shows stronger hydrogen bonds for the threonine-containing molecules (the three solid lines centered near −2.5 kcal/mol in Fig. 2 a and near −3.0 kcal/mol in Fig. 2 b) and weaker hydrogen bonds for the allo-threonine molecules. Since this difference exists for both polar and nonpolar solvent models (including the model with no solvent), solvent shielding does not explain the hydrogen-bond weakening.
To better understand the stability differences, we performed simulations of all five molecules listed in Table 1. This was done using both implicit and explicit water models. The two models lead to the same conclusion for the questions posed in this study, although we find quantitative differences between the two water models. The major shortcoming of the implicit water model can be seen by comparing the two models in Table 2 and Fig. 2, a and b, where weaker hydrogen bonds are observed in the simulations that use the implicit solvent models. This difference seems to be a shortcoming of the implicit solvent models and might be a result of the absence of a cage of explicit solvent molecules that dampen fluctuations in the triple-helical structures. The primary advantage of using the implicit water models is a significant reduction in computer time (by almost an order of magnitude per time step) and greater ability to sample conformation space because of the absence of the conformational constraints imposed by the slowly relaxing solvent structure. To validate our results, we use both water models in this study.
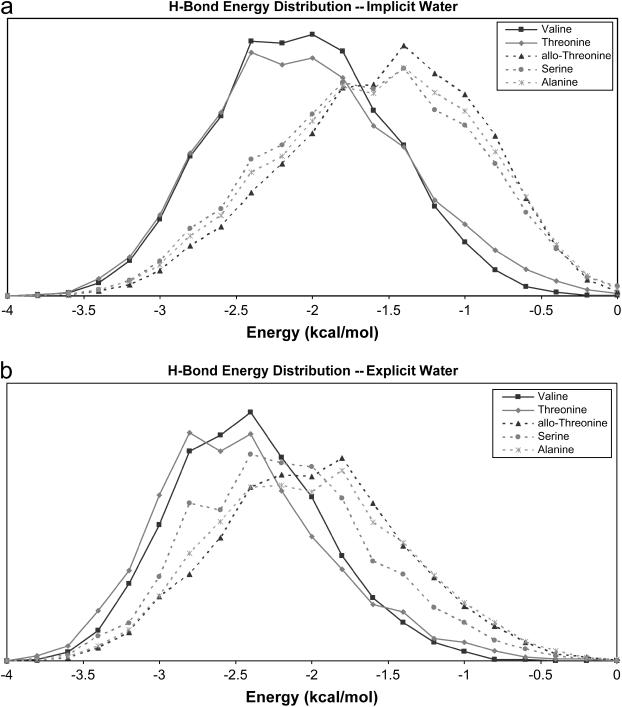
Hydrogen-bonding statistics for each of the five molecules are shown in Table 3, where the first three metrics are the same as shown in Table 2. The additional metric is z axis offset, which indicates the nonlinearity of the interchain hydrogen bonds and is shown in Fig. 1 (labeled ΔZHO). Note that by all measures, the more stable molecules have stronger hydrogen bonds. Fig. 3, a and b, gives the distribution of hydrogen-bond energies for each molecule, where stable molecules are shown using solid lines and unstable molecules are shown using broken lines.
TABLE 3.
Backbone-backbone (Gly-to-Xaa) hydrogen-bond statistics for all molecules in water
| Energy (kcal/mol)
|
Frequency
|
Length (Å)
|
z axis offset (Å)
|
|||||
|---|---|---|---|---|---|---|---|---|
| Molecule | Implicit | Explicit | Implicit | Explicit | Implicit | Explicit | Implicit | Explicit |
| [(GOV)10]3 | −1.82 | −2.19 | 53% | 83% | 2.22 | 2.05 | 0.68 | 0.62 |
| [(GOT)10]3 | −1.71 | −2.25 | 50% | 82% | 2.27 | 2.05 | 0.73 | 0.64 |
| [(GOaT)10]3 | −1.31 | −1.68 | 27% | 58% | 2.45 | 2.19 | 1.01 | 0.89 |
| [(GOS)10]3 | −1.34 | −1.90 | 32% | 68% | 2.58 | 2.13 | 1.18 | 0.81 |
| [(GOA)10]3 | −1.37 | −1.75 | 29% | 58% | 2.45 | 2.19 | 1.04 | 0.91 |
FIGURE 3.
Hydrogen-bond energy for [(GOX)n]3 simulations. Probability density functions for hydrogen-bond energies for simulations of five molecules shown in Table 1, using the implicit water model (a) and explicit water model (b). Stable molecule data are shown as solid lines, and unstable molecule data are shown as broken lines.
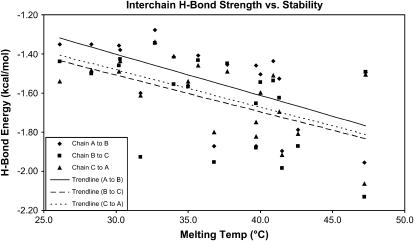
To further examine the relationship between hydrogen-bonding energies and stability, additional simulations were performed on collagen-like molecules described by Persikov et al. (6). The results are given in Table 4 and Fig. 4, which show results from simulations of 20 host-guest peptides, where the guest occupies the Yaa position and is one of the 20 naturally occurring residues (including hydroxyproline, but excluding proline). These simulations were performed using the implicit water model. The three energies shown correspond to the time-average hydrogen-bonding energies for the three hydrogen bonds originating with the glycines immediately after the three guest residues (where the energies are calculated using the method of Kabsch and Sander (23)). Also shown are the correlation coefficients for all residues and for all residues excluding hydroxyproline.
TABLE 4.
Host-guest hydrogen-bonding energy versus melting temperature
| Melting Temp (°C)
|
Energy (kcal/mol)
|
|||
|---|---|---|---|---|
| Guest Residue | Chain A to B | Chain B to C | Chain C to A | |
| Hyp | 47.3 | −1.49 | −1.49 | −1.51 |
| Arg | 47.2 | −1.96 | −2.13 | −2.06 |
| Met | 42.6 | −1.79 | −1.87 | −1.81 |
| Ile | 41.5 | −1.90 | −1.98 | −1.92 |
| Gln | 41.3 | −1.53 | −1.63 | −1.70 |
| Ala | 40.9 | −1.44 | −1.54 | −1.51 |
| Val | 40.0 | −1.50 | −1.54 | −1.60 |
| Glu | 39.7 | −1.46 | −1.65 | −1.75 |
| Thr | 39.7 | −1.87 | −1.88 | −1.82 |
| Cys | 37.7 | −1.46 | −1.45 | −1.49 |
| Lys | 36.8 | −1.87 | −1.95 | −1.80 |
| His | 35.7 | −1.41 | −1.43 | −1.46 |
| Ser | 35.0 | −1.56 | −1.57 | −1.54 |
| Asp | 34.0 | −1.42 | −1.56 | −1.41 |
| Gly | 32.7 | −1.28 | −1.35 | −1.34 |
| Leu | 31.7 | −1.60 | −1.93 | −1.61 |
| Asn | 30.3 | −1.38 | −1.43 | −1.44 |
| Tyr | 30.2 | −1.36 | −1.46 | −1.49 |
| Phe | 28.3 | −1.35 | −1.50 | −1.48 |
| Trp | 26.1 | −1.35 | −1.44 | −1.54 |
| R (all residues) | −0.59 | −0.48 | −0.60 | |
| R (excluding Hyp) | −0.68 | −0.60 | −0.72 | |
Time average energies for three of the hydrogen bonds in each of the host-guest molecules described by Persikov (6), where the guest residues occupy the Yaa position. Each molecule was of the form [Ace-(Gly-Pro-Hyp)3-(Gly-Pro-Yaa)-(Gly-Pro-Hyp)4-Gly-Gly-NH2]3 where Yaa represents the naturally occurring amino acids (including hydroxyproline, but excluding proline). The three sets of energies correspond to the hydrogen bonds involving the glycine immediately after the guest residue (Yaa), and exist between each pair of the three peptide chains. The correlation coefficients were calculated in two ways: using all residues and using all residues except hydroxyproline. Since hydroxyproline's contribution to stability is primarily entropic, its hydrogen-bond strength is smaller then predicted based on melting temperatures (for more discussion of this point, see Radmer and Klein (15)).
FIGURE 4.
Hydrogen-bonding energies versus melting temperature of 20 host-guest peptides. Plots of data shown in Table 4. The trendlines show best file linear regression line for each hydrogen-bonding position.
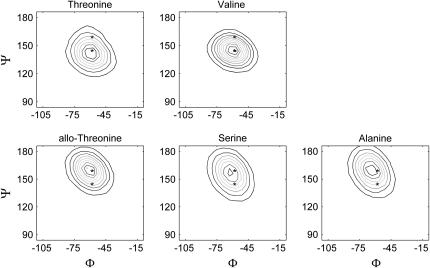
Table 5 shows average Φ and Ψ-angles for all triplet positions in each molecule shown in Table 1. Note that the angles are typically smaller for the stable molecules. This is particularly apparent for the Yaa residue Ψ-angles. Fig. 5 is a set of Φ−Ψ-maps for the Yaa residues of each molecule. In each map, the average Φ−Ψ-angles for the threonine-containing molecule is indicated with the lower asterisk and the average Φ−Ψ-angles for the allo-threonine-containing molecule is indicated with a upper asterisk. In all cases, the contour surfaces for the stable molecules are centered on the lower asterisks, and the surfaces for the unstable molecules are centered on the upper asterisks.
TABLE 5.
Dihedral angles for all molecules
| Gly
|
Hyp
|
Yaa
|
||||||||||
|---|---|---|---|---|---|---|---|---|---|---|---|---|
| Φ
|
Ψ
|
Φ
|
Ψ
|
Φ
|
Ψ
|
|||||||
| Molecule | Implicit | Explicit | Implicit | Explicit | Implicit | Explicit | Implicit | Explicit | Implicit | Explicit | Implicit | Explicit |
| [(GOV)10]3 | −70 | −69 | 169 | 170 | −70 | −70 | 158 | 158 | −60 | −59 | 142 | 142 |
| [(GOT)10]3 | −70 | −69 | 171 | 172 | −70 | −68 | 160 | 158 | −60 | −59 | 141 | 141 |
| [(GOaT)10]3 | −79 | −76 | 176 | 178 | −71 | −69 | 166 | 164 | −60 | −60 | 154 | 152 |
| [(GOS)10]3 | −77 | −74 | 175 | 177 | −71 | −70 | 164 | 163 | −63 | −59 | 152 | 147 |
| [(GOA)10]3 | −79 | −77 | 176 | 179 | −71 | −71 | 164 | 164 | −63 | −61 | 154 | 151 |
Average angles resulting from all simulations (calculated from the arctangent of the ratio of the averages of the sine and cosine of the dihedral angles).
FIGURE 5.
Φ−Ψ-maps for Yaa residues from the [(GOX)n]3 simulations. Contour maps of Φ−Ψ-angles for each of the five molecules shown in Table 1. The lower asterisk shows average Φ−Ψ-angles for the threonine-containing molecule, and the upper asterisk shows average Φ−Ψ-angles for the allo-threonine-containing molecule.
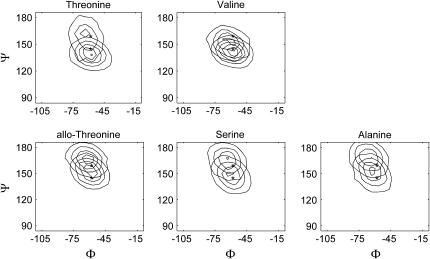
Fig. 6 is similar to Fig. 5, but the lower contour lines show Φ−Ψ-angles when the adjacent glycine is involved in a short (strong) hydrogen bond (≤2.0 Å) and the upper contour lines show angles when the adjacent glycine is involved in a long (strong) hydrogen bond (>2.7 Å). Note that for all molecules, conformations with short hydrogen bonds have Φ−Ψ-maps that are similar to those of stable molecules, and conformations with long hydrogen-bonds have Φ−Ψ-maps that are more similar to those of unstable molecules.
FIGURE 6.
Short and long hydrogen-bond Φ−Ψ-maps for Yaa residues from the [(GOX)n]3 simulations. Contour maps of Φ−Ψ-angles for each of the five molecules shown in Table 1, split into short hydrogen-bond and long hydrogen-bond sets. The lower contour surface shows conformation where the adjacent glycine has a short hydrogen bond (≤2.0 Å), and upper contour surface shows conformations where the adjacent glycine has long hydrogen bond (>2.7 Å). See Fig. 5 for description of the asterisks.
Table 6 gives the probability that each γ-atom will occupy the χ = 180° conformation. For example, the most common conformations of the valine- and threonine-containing molecules have a carbon atom in this position (91% and 80% in implicit water). The most common conformations for the remaining molecules place a hydrogen atom in this position.
TABLE 6.
Probability of observing each atom type at χ = 180°
| Atom 1
|
Atom 2
|
Atom 3
|
|||||||
|---|---|---|---|---|---|---|---|---|---|
| Atom Type
|
Frequency
|
Atom Type
|
Frequency
|
Atom Type
|
Frequency
|
||||
| Molecule | Implicit | Explicit | Implicit | Explicit | Implicit | Explicit | |||
| [(GOV)10]3 | C | 7% | 21% | C | 91% | 79% | H | 2% | 1% |
| [(GOT)10]3 | O | 0% | 4% | H | 20% | 16% | C | 80% | 80% |
| [(GOaT)10]3 | O | 1% | 2% | C | 1% | 0% | H | 98% | 98% |
| [(GOS)10]3 | O | 1% | 2% | H | 14% | 6% | H | 85% | 92% |
| [(GOA)10]3 | H | 31% | 32% | H | 38% | 31% | H | 31% | 37% |
The fraction of time each atom spends in the χ = 180° conformation is shown. Atom number (Atom 1, Atom 2, and Atom 3) is somewhat arbitrary, but in all cases their sequence corresponds to the clockwise order around the Cα-Cβ bond, viewed from the Cα atom. An essential point is that the most frequent conformation for [(GOV)10]3 and [(GOT)10]3 has a carbon atom at χ = 180° (Atom 2, 79%, and Atom 3, 80%, for the explicit water model) and the most frequent conformation for [(GOaT)10]3 and [(GOS)10]3 has a hydrogen atom at χ = 180° (Atom 3, 98%, and Atom 3, 92%, for the explicit water model).
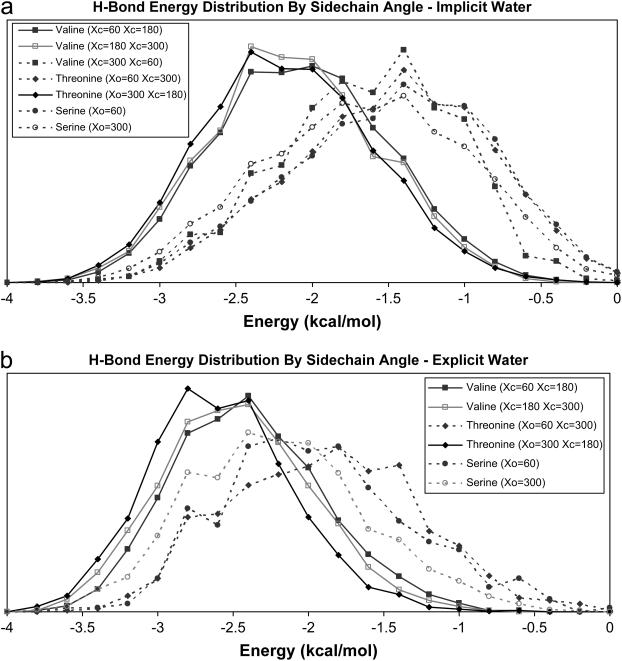
Fig. 7, a and b, shows the distribution of hydrogen-bond energies for all χ conformations that occur >2% of the time. (Plots of the remaining conformations are too noisy to be useful, so are not shown.) As can been seen, the three plots with the strongest hydrogen bonds (shown with solid lines) all correspond to a structure with a methyl group at χ = 180°. The remaining plots (dotted lines) all correspond to structures that have a hydrogen atom at χ = 180°.
FIGURE 7.
Hydrogen-bond length displayed by χ-angle, for [(GOX)n]3 simulations. Probability density functions for hydrogen-bond energies for simulations of five molecules shown in Table 1, split into sets based on χ-angle (results using the implicit water model are shown in a, and results using the explicit model are shown in b). Conformations present <2% of the time resulted in plots that were too noisy to be useful, and are not shown.
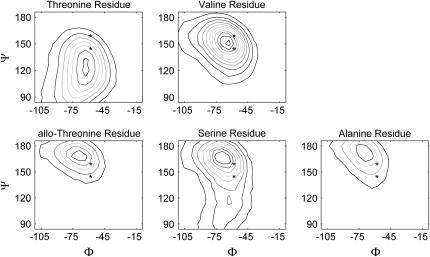
Fig. 8 shows Φ−Ψ-maps for valine, threonine, allo-threonine, serine, and alanine residues when they are not part of large peptides. These are calculated by doing simulations of each residue capped with neutral Ace and NMe groups. For each simulation, the χ-angle is constrained to the most frequent conformation seen in the triple-helical simulations (from Table 6). Also shown are the average Yaa residue Φ−Ψ-angles from the simulations of the threonine- (lower asterisk) and allo-threonine- (upper asterisk) containing molecules, as described for Figs. 4 and 5.
FIGURE 8.
Φ−Ψ-maps from single residues simulations. Contour maps of Φ−Ψ-angles for each of the five residues occupying the Yaa position of the molecules shown in Table 1. Each residue is terminated with neutral capping groups. See Fig. 5 for description of the asterisks.
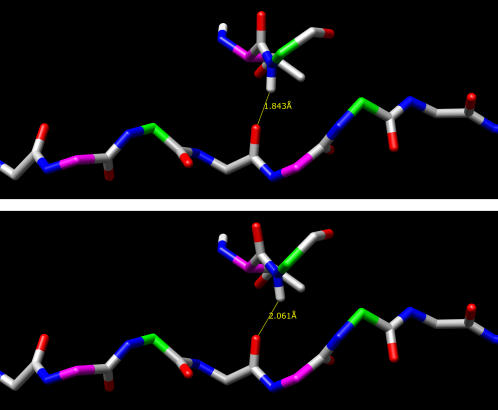
The upper image in Fig. 9 shows a representative structure taken from the threonine-containing peptide simulation. The Ψ-angle (centered on the yellow bond) is 141°, and hydrogen-bond length is given in the figure; both are typical of this simulation. The lower image shows the same structure with the Ψ-angle increased to a value of 153°, which is more typical of the allo-threonine simulations (not shown are corresponding changes in the subsequent glycine Φ−Ψ-angles). Note that this action has shifted the subsequent backbone nitrogen toward the C-terminal end of the molecule, increasing the interchain hydrogen-bond length.
FIGURE 9.
Hydrogen bond for threonine with two different Ψ-angles. Structures taken from a threonine-containing simulation (implicit water). The molecules' long axis (z axis) is horizontal and in the plane of the figure, with the N-terminal end at the left and the C-terminal at the right. Glycine α-carbons are shown in green, and Yaa residue α-carbons are shown in magenta. The upper residues in each image are threonine (in the Yaa position) and glycine, with the Yaa residue Ψ-angle indicated by a yellow bond. An extended section of the lower chain is shown to provide perspective. The upper image shows the hydrogen bond for a threonine Ψ-angle of 141°. The lower image shows the same hydrogen bond after this angle is increased to 153°. Note the increase in hydrogen-bond length and the shift of the glycine nitrogen and hydrogen atoms toward the C-terminal end of the molecule.
DISCUSSION
The purpose of this study is to characterize and explain the structure and stability differences seen for the five collagen-like molecules listed in Table 1. We first considered the possibility, proposed by Mizuno et al. (3), that the γ-methyl groups on the Yaa residues in the stable molecules (containing threonine and valine) stabilize the triple-helical structure by shielding the interchain hydrogen bonds from solvent and that the equivalent methyl groups on the Yaa residues in the unstable molecules (containing allo-threonine, serine, and alanine) are unable to because they occupy positions farther from the hydrogen bonds or are nonexistent.
To some extent our results and Mizuno's hypothesis are consistent since we do find that the threonine and valine's methyl groups are well positioned to shield these hydrogen bonds (they occupy the χ = 180° conformation; see Table 6) and the allo-threonine's methyl group is not, as it rarely occupies this position, and serine and alanine obviously have no methyl group to shield anything. However, the simulations of threonine and allo-threonine using various solvent models (including an absence of solvent) consistently showed significant differences between the hydrogen-bonding properties for the two molecules (see Table 2 and Fig. 2).
If solvent shielding were to explain the observed stability difference in water, then we would expect the stability differences to exist only for polar solvents. We consistently see structural differences for both polar and nonpolar solvents; thus, it is clear that the type of solvent is not the primary cause of the observed structural differences. This by itself does not necessarily mean that solvent shielding is an inadequate explanation for the observed stability difference since we are not considering the unfolded (fully solvated) state. Nonetheless, the constant structural differences between the stable and unstable molecules suggest that this is the major determining factor in the observed stability differences.
Our explanation for the stability difference is slightly different than Mizuno's. We do find that the position of the Yaa residue's γ-methyl group correlates with molecular stability, as suggested by Mizuno et al. However, we believe that this methyl group affects the preferred molecular structure and indirectly the molecule's stability.
A key point from Tables 3–6 and Figs. 3–7 is that molecular stability, hydrogen-bond strength, and Yaa residue Ψ-and χ-angles are all correlated with each other. Perhaps the most important correlation is the one observed between molecular stability and average hydrogen-bond strength (Table 3 and Fig. 3). For every measure of hydrogen-bond strength that we examined, stable molecules have stronger hydrogen bonds. Since strong hydrogen bonds increase the enthalpy of formation and molecular stability, this suggests that a structural explanation for the observed difference in hydrogen-bond strength might give an explanation for the relative stabilities of the molecules.
Since we are not considering the unfolded states of the molecules, we are effectively assuming that differences between the unfolded states do not greatly affect the relative stability of the molecules. Since little is known about the unfolded states (unlike the folded state, where crystal structures are available), this assertion is difficult to prove. However, the correlations shown here suggest that this is a reasonable approximation for this set of molecules (and possibly collagen-like molecules in general).
The observed correlation between hydrogen-bond strength and molecular stability for these molecules raises the question of how strong the correlation is for a more divergent set of molecules. This was tested by examining the 20 Persikov host-guest peptides shown in Table 4. A plot of the average hydrogen-bond energies for three hydrogen bonds (chosen to be adjacent to the guest residue) versus experimental melting temperature does show a clear correlation (Fig. 4). The correlation coefficients are in the range of from −0.60 to −0.72 (excluding the hydroxyproline, whose primary contribution to stability is entropic) and show that a real correlation does exist. This was surprising to us considering the structural and chemical diversity of the residues. These results support the idea that the correlation between hydrogen-bond strength and stability seen for the molecules listed in Table 1 is real.
Two interesting correlations involving a structural feature for the molecule from Table 1 can be seen in Table 5 and Figs. 4 and 5. The first is between molecular stabilities and the average Yaa residue Ψ-angles, which shows that stable molecules have smaller average angles (forming tighter helices). The second correlation shows that for individual conformations of any molecule, smaller Ψ-angles correlate with shorter hydrogen bonds. These correlations suggest that differences between the Yaa residues might result in different preferred Ψ-angles, which could affect the hydrogen-bond strength to the adjacent glycine.
An explanation for the observed correlation between extended Ψ-angles and longer hydrogen bonds can be seen in the molecular structures shown in Fig. 9, where the upper image shows a structure with Ψ-angle and hydrogen-bond lengths that are typical of the threonine- and valine-containing peptide simulations and the lower image shows the same structure with the Ψ-angle increased such that it is more consistent with the allo-threonine, serine, and alanine simulations. This action shifts the subsequent backbone nitrogen toward the C-terminal end of the molecule, increasing the interchain hydrogen-bond length in the lower image, presumably decreasing the peptide's stability. As can be seen in the schematic representation of the interchain hydrogen bonding shown in Fig. 1, the backbone nitrogen atom is typically displaced toward the C-terminal end of the molecule, so any additional displacement in this direction will increase the hydrogen-bond length, decreasing its strength. Table 3 shows that smaller z axis offsets also correlate with stronger hydrogen bonds and with more stable molecules.
The preceding discussion suggests that changes in the Yaa residue result in different preferred Ψ-angles, which in turn result in changes in hydrogen-bond strength and molecular stability. Lacking is an explanation for how the type of Yaa residue affects the Ψ-angle. To make these connections, we explored the possibility that the intrinsic Ψ-angle preferences of the isolated residues determine the preferred Ψ-angles observed in the peptide simulations, and that this in turn affects hydrogen-bond strength and the molecular stability. To do this, we calculated Φ−Ψ-maps for each residue (Fig. 8). Since the triple helical simulations show that conformations with the Yaa residue hydroxyl at the χ = 300° position are preferred (apparently because electrostatic stabilization is provided by interaction with the nearby hydroxyl group of the hydroxyproline on the subsequent chain), we constrained the side chains to this conformation.
Fig. 8 shows that three residues (allo-threonine, serine, and alanine) have preferred Ψ-angles that are larger than the values typically seen in any of the peptide simulations. The two other residues (threonine and valine) have smaller preferred Ψ-angles that are close to the value seen in the stable triple helical molecules, where threonine shows a Ψ-angle that is smaller than any of the peptides simulations and valine's preferred Ψ-angle is centered on the midpoint between the two asterisks. A simple explanation for this is that a methyl group at the χ = 180° position experiences steric clashes with the subsequent main-chain nitrogen, forcing the Ψ-angle to adopt smaller values. A hydrogen atom at this position allows the Ψ-angle to adopt a more extended conformation. This suggests that the maps generated from the peptide simulations (Fig. 5) can be explained, in part, by the presence or absence of a methyl group in the χ = 180° position, which would sterically clash with the subsequent main-chain nitrogen atom and shift the Φ−Ψ-map downward.
In summary, we believe that when Yaa methyl groups are in the χ = 180° conformation, they experience steric clashes with the subsequent backbone nitrogen atoms, forcing the residue's Ψ-angle to a smaller value that is more consistent with stronger interchain hydrogen bonds and a better enthalpy of formation (see Figs. 4–8). In short, the observed stability differences seem to be an indirect consequence of each residue's preference Φ−Ψ-angles.
Generalizing these results suggests that any amino acids with methyl or methylene groups that occupy the χ = 180° position will have Φ−Ψ-maps centered on smaller values of Ψ and would result in stable triple helices. For example, adding an additional methyl group to the β-carbon of valine or allo-threonine (or equivalently, the threonine) should also result in a peptide that forms stable triple helices since it would always have a methyl group at the χ = 180° position.
With respect to the use of implicit and explicit water, we find that the two models give quantitatively different results. Most obviously, hydrogen bonds are generally shorter and stronger in explicit water simulations. However, the two models invariably lead to the same conclusion when we examine structure differences between the molecules. Hydrogen bonds are always longer and weaker in the unstable molecules than in the stable molecules regardless of which water model we focus on.
The ability to understand and predict the stability of collagen-like molecules may result in better bioengineered materials and could help predict the severity of inherited collagen diseases. We are particularly interested in applying lessons learned here to understanding and predicting the clinical severity of Osteogenesis Imperfecta, an inherited disease resulting from mutations in type I collagen.
Acknowledgments
We thank the Biocomputation Core Facility at Stanford University for the use of the SGI 3800 Origin computer.
This work was funded by the National Institutes of Health Grant AR051582 (T.E.K., principal investigator).
Abbreviations used: [(GOV)10]3, Ace-(Gly-Hyp-Valr)10-Nme]3; [(GOT)10]3, Ace-(Gly-Hyp-Thr)10-Nme]3; [(GOaT)10]3, Ace-(Gly-Hyp-allo-Thr)10-Nme]3; [(GOS)10]3, Ace-(Gly-Hyp-Ser)10-Nme]3; [(GOA)10]3, Ace-(Gly-Hyp-Ala)10-Nme]3; Ace, neutral acetyl capping group; LDS, low-dielectric solvent; NMe, neutral N-methylamine capping group; Xaa, triplet residue after glycine; Yaa, triplet residue before glycine hydroxyproline 4(R)-hydroxyproline.
References
- 1.Alberts, B., A. Johnson, J. Lewis, M. Raff, K. Roberts, and P. Walter. 2002. Molecular Biology of the Cell. Garland Science, New York.
- 2.Kreis, T., and R. Vale. 1999. Guidebook to the Extracellular Matrix, Anchor, and Adhesion Proteins. Oxford University Press, New York.
- 3.Mizuno, K., T. Hayashi, and H. P. Bachinger. 2003. Hydroxylation-induced stabilization of the collagen triple helix. Further characterization of peptides with 4(R)-hydroxyproline in the Xaa position. J. Biol. Chem. 278:32373–32379. [DOI] [PubMed] [Google Scholar]
- 4.Mizuno, K., T. Hayashi, D. H. Peyton, and H. P. Bachinger. 2004. The peptides acetyl-(Gly-3(S)Hyp-4(R)Hyp)10–NH2 and acetyl-(Gly-Pro-3(S)Hyp)10–NH2 do not form a collagen triple helix. J. Biol. Chem. 279:282–287. [DOI] [PubMed] [Google Scholar]
- 5.Persikov, A. V., J. A. Ramshaw, and B. Brodsky. 2000. Collagen model peptides: sequence dependence of triple-helix stability. Biopolymers. 55:436–450. [DOI] [PubMed] [Google Scholar]
- 6.Persikov, A. V., J. A. Ramshaw, A. Kirkpatrick, and B. Brodsky. 2000. Amino acid propensities for the collagen triple-helix. Biochemistry. 39:14960–14967. [DOI] [PubMed] [Google Scholar]
- 7.Persikov, A. V., J. A. Ramshaw, A. Kirkpatrick, and B. Brodsky. 2002. Peptide investigations of pairwise interactions in the collagen triple-helix. J. Mol. Biol. 316:385–394. [DOI] [PubMed] [Google Scholar]
- 8.Jenkins, C. L., and R. T. Raines. 2002. Insights on the conformational stability of collagen. Nat. Prod. Rep. 19:49–59. [DOI] [PubMed] [Google Scholar]
- 9.DeRider, M. L., S. J. Wilkens, M. J. Waddell, L. E. Bretscher, F. Weinhold, R. T. Raines, and J. L. Markley. 2002. Collagen stability: insights from NMR spectroscopic and hybrid density functional computational investigations of the effect of electronegative substituents on prolyl ring conformations. J. Am. Chem. Soc. 124:2497–2505. [DOI] [PubMed] [Google Scholar]
- 10.Jenkins, C. L., L. E. Bretscher, I. A. Guzei, and R. T. Raines. 2003. Effect of 3-hydroxyproline residues on collagen stability. J. Am. Chem. Soc. 125:6422–6427. [DOI] [PubMed] [Google Scholar]
- 11.Klein, T. E., and C. C. Huang. 1999. Computational investigations of structural changes resulting from point mutations in a collagen-like peptide. Biopolymers. 49:167–183. [DOI] [PubMed] [Google Scholar]
- 12.Mooney, S. D., C. C. Huang, P. A. Kollman, and T. E. Klein. 2001. Computed free energy differences between point mutations in a collagen-like peptide. Biopolymers. 58:347–353. [DOI] [PubMed] [Google Scholar]
- 13.Mooney, S. D., and T. E. Klein. 2002. Structural models of osteogenesis imperfecta-associated variants in the COL1A1 gene. Mol. Cell. Proteomics. 1:868–875. [DOI] [PubMed] [Google Scholar]
- 14.Mooney, S. D., P. A. Kollman, and T. E. Klein. 2002. Conformational preferences of substituted prolines in the collagen triple helix. Biopolymers. 64:63–71. [DOI] [PubMed] [Google Scholar]
- 15.Radmer, R. J., and T. E. Klein. 2004. Severity of osteogenesis imperfecta and structure of a collagen-like peptide modeling a lethal mutation site. Biochemistry. 43:5314–5323. [DOI] [PubMed] [Google Scholar]
- 16.Case, D. A., D. A. Pearlman, J. W. Caldwell, T. E. I. Cheatham, J. Wang, W. S. Ross, C. L. Simmerling, T. A. Darden, K. M. Merz, R. V. Stanton, A. L. Cheng, J. J. Vincent, M. Crowley, V. Tsui, H. Gohlke, R. J. Radmer, Y. Duan, J. Pitera, I. Massova, G. L. Seibel, U. C. Singh, P. K. Weiner, and P. A. Kollman. 2002. AMBER. Version 7. University of California, San Francisco.
- 17.Cornell, W. D., P. Cieplak, C. I. Bayly, I. R. Gould, K. M. Merz Jr., D. M. Ferguson, D. C. Spellmeyer, T. Fox, J. W. Caldwell, and P. A. Kollman. 1995. A second generation force field for the simulation of proteins, nucleic acids, and organic molecules. J. Am. Chem. Soc. 177:5179–5197. [Google Scholar]
- 18.Huang, C. C., G. S. Couch, E. F. Pettersen, T. E. Ferrin, A. E. Howard, and T. E. Klein. 1998. The object technology framework: an object-oriented interface to molecular data and its application to collagen. Pac. Symp. Biocomput. 349–361. [PubMed]
- 19.Jorgensen, W. L., J. Chandrasekhar, J. D. Madura, R. W. Impey, and M. L. Klein. 1983. Comparison of simple potential functions for simulating liquid water. J. Chem. Phys. 79:926–935. [Google Scholar]
- 20.Berendsen, H. J., J. P. Postma, W. F. van Gunsteren, A. DiNola, and J. R. Haak. 1984. Molecular dynamics with coupling to an external bath. J. Chem. Phys. 81:3684–3690. [Google Scholar]
- 21.Onufriev, A., D. Bashford, and D. A. Case. 2000. Modification of the generalized Born model suitable for macromolecules. J. Phys. Chem. B. 104:3712–3720. [Google Scholar]
- 22.Onufriev, A., D. A. Case, and D. Bashford. 2002. Effective Born radii in the generalized Born approximation: the importance of being perfect. J. Comput. Chem. 23:1297–1304. [DOI] [PubMed] [Google Scholar]
- 23.Kabsch, W., and C. Sander. 1983. Dictionary of protein secondary structure: pattern recognition of hydrogen-bonded and geometrical features. Biopolymers. 22:2577–2637. [DOI] [PubMed] [Google Scholar]
- 24.Bann, J. G. and H. P. Bachinger. 2000. Glycosylation/hydroxylation-induced stabilization of the collagen triple helix. 4-trans-hydroxyproline in the Xaa position can stablilize the triple helix. J. Biol. Chem. 275:24466–24469. [DOI] [PubMed] [Google Scholar]


