

Abstract
We present an extensive investigation of the accuracy and precision of temporal image correlation spectroscopy (TICS). Using simulations of laser scanning microscopy image time series, we investigate the effect of spatiotemporal sampling, particle density, noise, sampling frequency, and photobleaching of fluorophores on the recovery of transport coefficients and number densities by TICS. We show that the recovery of transport coefficients is usually limited by spatial sampling, while the measurement of accurate number densities is restricted by background noise in an image series. We also demonstrate that photobleaching of the fluorophore causes a consistent overestimation of diffusion coefficients and flow rates, and a severe underestimation of number densities. We derive a bleaching correction equation that removes both of these biases when used to fit temporal autocorrelation functions, without increasing the number of fit parameters. Finally, we image the basal membrane of a CHO cell with EGFP/α-actinin, using two-photon microscopy, and analyze a subregion of this series using TICS and apply the bleaching correction. We show that the photobleaching correction can be determined simply by using the average image intensities from the time series, and we use the simulations to provide good estimates of the accuracy and precision of the number density and transport coefficients measured with TICS.
INTRODUCTION
Fluorescence correlation spectroscopy (FCS) was originally conceived over 30 years ago (1) to study the reversible binding of ethidium bromide to DNA molecules in solution. Since then, it has emerged as a powerful technique to measure translational diffusion (2), rotational diffusion (3), triplet state kinetics (4), and number densities and dynamics of fluorescent proteins inside living cells (5,6). Scanning FCS (7) and ICS (8) were later developed to study slow moving or immobile fluorescent membrane proteins at timescales inaccessible via traditional FCS.
Membrane dynamics can also be probed using other techniques such as single-particle tracking (9) and fluorescence recovery after photobleaching (FRAP) (10). Single-particle tracking measures the trajectories of individual labeled particles, enabling the complete characterization of a range of macromolecular dynamics in the cell. However, it requires the particles be individually resolvable, and hence labeled at a low density, a requirement frequently not met for transfected cells expressing GFP/protein constructs. FRAP has also proven to be useful in the study of membrane dynamics. Although fluctuation correlation techniques observe systems at thermodynamic equilibrium, FRAP introduces a large external photobleaching perturbation and monitors the system relaxation back to equilibrium. FRAP can measure the diffusion coefficients and mobile fractions of membrane proteins, but it cannot determine number densities and aggregation states in contrast to fluorescence fluctuation techniques.
Temporal image correlation spectroscopy (TICS), the imaging analog of FCS, has been used to measure dynamics, number densities, and aggregation states of proteins in the membranes of living cells (11–13). Although it was introduced several years ago, there has not been a systematic investigation of the accuracy and precision of TICS measurements. Previously, the precision of TICS measurements on cells has only been examined by calculating a cell population average, which reflected the biological distribution and not instrumental uncertainty (14) along with preliminary investigations into temporal sampling (15). The main purpose of this work is to fully characterize the accuracy and precision of TICS measurements.
A large body of work has characterized the accuracy and standard deviation of FCS measurements (16–21). These studies have mapped out the complex phase space of experimental FCS parameters, which dictate the precision of such measurements. In the past, only a preliminary examination of the accuracy of temporal ICS measurements had been performed (15). Furthermore, it is known that the temporal autocorrelation function (TACF) calculated from a short finite data set can be a biased estimator of the true TACF in both FCS and light scattering experiments (17,22–24). In this work, we investigate if this bias is significant in typical TICS collection regimes.
It is evident that most cell types exhibit spatial heterogeneity in both transport properties and the distribution of membrane receptors within individual cells (25). For example, single CHO cells have recently been shown to have regions that vary in their diffusion and flow rates of α5-integrin and α-actinin (11). Since sampling of regions within a single cell prohibits calculation of a population average, the significance of a single TICS measurement can only be judged if its corresponding accuracy and precision is known.
This work examines several important, and previously unaddressed areas of TICS measurements: the effect of spatiotemporal sampling and particle density on the precision of measured diffusion coefficients, and an examination of the effects of photobleaching of fluorophores. In all previous TICS studies, organic fluorophores or fluorescent proteins were used. During imaging, a fraction of the fluorophores irreversibly photobleach. In these past studies, the contributions to the TACF of the fluctuations due to photobleaching were neglected. In this work, we show how photobleaching systematically perturbs TACFs, and introduce a correction factor that corrects for bleaching. We also examine the effect of background and counting noise on the recovery of transport coefficients and number densities from temporal correlation decays.
We demonstrate the application of TICS simulations to determine the precision of experimental TICS analysis of a two-photon LSM image time series of a single CHO cell expressing EGFP/α-actinin. By comparing the sampling and noise characteristics of the subregion imaged in this measurement with the results of our simulations, we estimate the accuracy and precision of the TICS measured number density and diffusion coefficient. Finally, we show that a photobleaching correction can successfully be applied to this live cell measurement. The material we present will allow researchers with little expertise in the field to estimate the accuracy and precision of single TICS measurements, and to correct for the effects of omnipresent fluorescence photobleaching.
THEORY
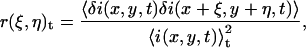
Temporal image correlation spectroscopy has been described in detail elsewhere (15). We review here the basic formulas needed to understand this work. We define a spatiotemporal intensity fluctuation (δi(x,y,t)) as the difference between the fluorescence intensity at pixel location (x,y) in the image sampled at time t (i(x,y,t)) and the mean image intensity
 |
(1) |
where the angular brackets indicate a spatial average over the image.
Spatial image correlation spectroscopy
The normalized two-dimensional intensity fluctuation spatial autocorrelation function (SACF) of the image recorded at time t in a time series is given by
 |
(2) |
where the angular brackets denote spatial averaging over the image, and ξ and η are spatial lag variables. These functions are typically calculated using Fourier methods (8), and fit to a two-dimensional Gaussian using a three-parameter nonlinear least-squares algorithm (fit parameters are in bold):
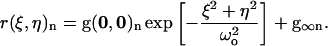 |
(3) |
Although number densities can be extracted from the amplitude of the SACF (8,26), the SACFs are only used here to obtain an estimate of the e−2 beam radius (ωo) at the laser focus (15).
Temporal image correlation spectroscopy
The normalized-intensity fluctuation temporal autocorrelation function (TACF) of an image series as a function of time lag τ is defined as
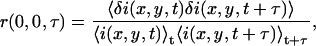 |
(4) |
where the angular brackets denote spatial and temporal averaging.
The image series is discrete in both space and time, so a discrete approximation of the TACF is calculated as
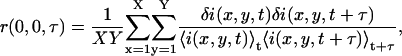 |
(5) |
where X and Y are the number of pixels spanning the region being analyzed. The discrete TACF calculated by Eq. 5 is then fit with the functional decay model derived for the mode of transport present in the sample.
For samples with two-dimensional diffusion, the TACF has the functional form (27) of
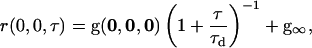 |
(6) |
where the characteristic diffusion time, τd, is related to the diffusion coefficient, D, by
 |
(7) |
The mean fit e−2 radius (〈ω0〉) for a particular analysis is determined by fitting the SACF of each image to Eq. 3 and finding the average value of ω0 from the time series (28).
The correlation decay model of a sample with two-dimensional flow is (29)
 |
(8) |
where the characteristic flow time, τf, is used to calculate the flow speed, |ν|,
 |
(9) |
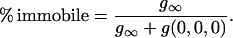
The percentage of the population that is immobile can be calculated from the offset parameter g∞ in Eq. 6 or 8 (11) as
 |
(10) |
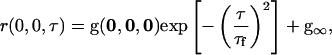
Finally, assuming the laser excitation volume has a three-dimensional Gaussian intensity profile, the functional form of the TACF for a system with three-dimensional diffusion is (30)
 |
(11) |
where z0 is the e−2 radius of the laser focus in the axial direction.
Photobleaching
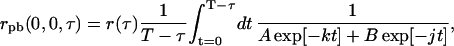
We now present a derivation for the theoretical form of the TACF decay in the presence of fluorophore photobleaching. When a two-dimensional sample is imaged on a LSM and bleaching occurs, the average intensity of an image in the series is dependent on time, and the system is no longer strictly stationary. Nevertheless, we will show in the following section that accurate information can still be obtained in this case. Under typical LSM imaging conditions, photobleaching of a two-dimensional sample manifests itself as either a mono- or bi-exponential decay in the average intensity of the image series as a function of time. When a planar membrane is imaged by LSM, bleached fluorophore exchange occurs only at the edges. Consequently, if the series analyzed is a subregion of a larger imaged region, and is not directly adjacent to the edge of the cell or the edge of the parent image, there will be a constant bleaching rate without replenishment by unbleached fluorophores. This behavior is in stark contrast to FCS measurements in which bleached fluorophores are constantly replaced by fluorescent particles from outside the stationary beam spot. For a mono-exponential bleaching process, the average intensity of an image at time t, 〈i(x,y,t)〉t, is given by experiment as
 |
(12) |
where 〈i(x,y,t)〉0 is the average intensity of the first image, and k is the bleaching decay constant with reciprocal time units. The angular brackets in Eq. 12 indicate spatial averaging over the entire image. For a bi-exponential bleaching decay, the average intensity is given by
 |
(13) |
where j is a second bleaching rate, and A and B are amplitude constants. The bleaching rate in laser scanning imaging is dependent on a number of experimental parameters, including: laser intensity, pixel dwell time, the spectroscopic and photophysical properties of the fluorophore, and the oxygen content of the sample. Instead of determining the individual effect of each of these variables, we empirically characterize the photobleaching according to Eq. 12 or 13 from the image subregion series data. The information from these fits is sufficient to correct the TACF for bleaching.
The normalized intensity fluctuation TACF for a system with one fluorescent component undergoing photobleaching, rpb(0,0,τ), is given by
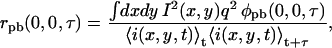 |
(14) |
where q is a factor that accounts for the quantum yield and collection efficiency, I(x,y) is the laser intensity profile, and φpb(x,y,τ) is the concentration fluctuation correlation function in the presence of photobleaching,
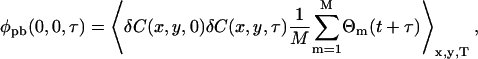 |
(15) |
where the angular brackets denote spatial averaging over each image, and temporal averaging over the length of the image series of total time T. The concentration fluctuation, δC(x,y,t), is defined analogously to the intensity fluctuation (Eq. 1) as
 |
(16) |
where 〈C(x,y,t)〉t is the mean concentration in the image at time t and C(x,y,t) is the concentration at pixel location (x,y) in the image at time t. The function Θm(t + τ) in Eq. 15 is 1 if particle m is emitting fluorescence, and 0 if it has bleached at time t + τ. The sum is over all M particles in the image. This factor is included only once in Eq. 15 because we consider bleaching to be irreversible; if a fluorophore is fluorescent at time t + τ, then it must have been fluorescent at time t as well. Furthermore, it is assumed that the bleaching is independent of any processes that give rise to concentration fluctuations.
We will proceed, without loss of generality, with the mono-exponential case. In this case, the bleaching factor on the right in Eq. 15 becomes
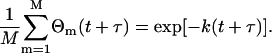 |
(17) |
When Eqs. 17 and 12 are substituted in Eq. 14 and the separability of photobleaching and concentration fluctuations is assumed, we obtain
 |
(18) |
Simplifying, we see the TACF in the presence of photobleaching is a product of the TACF without bleaching, r (τ), and a factor that accounts for the effect of the photobleaching,
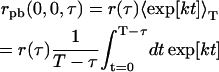 |
(19) |
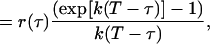 |
(20) |
where the limits of integration of Eq. 19 were chosen because the experimental TACF is calculated from an image series with finite length and total image series time, T. Analogously, if the bleaching is a bi-exponential process, Eq. 19 becomes
 |
(21) |
which can be integrated numerically for a particular set of A-, B-, k-, and j-values.
We have only presented the theoretical form of the TACF in the presence of mono- or bi-exponential photobleaching. However, any arbitrary function (e.g., a high-order polynomial) can be used to fit the intensity decay and an equation analogous to Eq. 20 or 21 can be derived.
Thus, in the presence of photobleaching, the TACF is a product of the original theoretical autocorrelation function, and a correction factor due to photobleaching. Note that when k → 0, Eqs. 20 and 21 reduce to r(τ), as required. The constants A and B must be renormalized such that they sum to one, for the factor to have the correct behavior as k or j approach zero. To correct for photobleaching, an experimental TACF is fit to a theoretically corrected function, rpb, which is a product of the uncorrected r(τ) decay model (Eq. 6 or 8), and a factor to account for the effect of the bleaching on the temporal autocorrelation function. This correction does not add a fitting parameter to the functional form of the TACF, since all variables in the correction factor are determined from the decay in average intensity of the image series. The photobleaching correction is not applicable to samples with three-dimensional diffusion since fluorophores are not bleached uniformly, as in a two-dimensional sample if the imaging is conducted in a single plane as we assume in this work.
MATERIALS AND METHODS
Computer simulations
All simulations and TACF analyses were written in MatLab R14 (The MathWorks, Natick, MA), using the Optimization and Image Processing Toolboxes, and performed on a personal computer (2.4 GHz, 1-GB RAM). Static images were simulated as previously described (26). Briefly, particle positions are randomly assigned to a matrix, which is then convolved with a Gaussian filter, with odd numbered dimensions, to simulate excitation of point fluorophores in a two-dimensional membrane with a TEM00 beam. Also, each image series was normalized such that each pixel contained only integer values, ranging from 0 to 4095, simulating a 12-bit A/D converter of the PMT current. Particle positions were always stored as floating-point double-precision numbers, and only rounded before the convolution. For diffusing particles, each x and y coordinate was changed separately by adding a random number drawn from a normal distribution with a mean of zero, and a standard deviation, σ, as
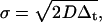 |
(22) |
where D is the diffusion coefficient, and Δt is the sampling time between sequential images. Circular boundary conditions for both particle movement and convolution were followed.
The formation of triplet dark states was not included, because this process occurs on the nanosecond timescale, and is not manifested in typical TICS imaging modalities where the frame rate is on the order of seconds. We assume that the laser power being used does not cause saturation effects. Furthermore, we assume that the particles are ideal at the densities and concentrations simulated in this work.
In three-dimensional diffusion simulations, particles were moved in each dimension according to Eq. 22. The excitation (convolution) profile was set to be Gaussian in z, with a z0 e−2 beam radius of 3ω0. Three-dimensional convolutions are significantly slower than their two-dimensional analogs. So instead of a full three-dimensional convolution, a Gaussian convolution was only performed at the z = 0 (focal) plane, yielding an image in which particles not in the focal plane were appropriately dimmer than their in-focus counterparts. The size of the z dimension of the simulation was arbitrarily set at 12z0.
Artifacts were not introduced in the simulations because of a repeating sequence of random numbers as the built-in MatLab random number generator has a period of 21492, which far exceeds the 229 random numbers generated in a single simulation. As well, each set of 100 simulations was seeded with a different initial state for the generator, thereby ensuring their independence.
Unless otherwise specified, all simulations were performed with the following conditions: an e−2 beam radius of four pixels; an image size of 256 × 256 pixels (yielding 1304 beam areas per image); a temporal sampling interval of four images per τd or τf; and a total simulation time of 25 τd or τf. These values correspond to typical laser scanning imaging conditions, and diffusion and flow times for proteins in the cell membrane (11). Furthermore, these parameters provide adequate spatiotemporal sampling, such that it gives a reasonable baseline, from which the effect of changing experimental conditions can be examined. Results are given in reduced parameters instead of dimensional values (e.g., beam areas per image instead of μm2 per image) to make the results as general as possible.
Photobleaching
To model photobleaching at each time step in the simulations, individual particles in the image were randomly selected and their yield was permanently changed to zero. For a mono-exponential bleaching process, the number of particles bleached in image n + 1,  was calculated as
 |
(23) |
where RandP is a built-in MatLab function that returns a random number from a Poisson distribution with a given mean, Nn is the number of fluorescent particles from the previous image, k is a bleaching rate constant as defined in Theory (see previous section), and Δt is the time between successive images. Because no particles photobleach before the image series is acquired,  for all values of k.
To create an image series with bi-exponential bleaching, two populations with different densities and k values were generated in the same image series. The densities were chosen to correspond to A and B constants, whereas the values of k and j were the corresponding decay rate constants, effectively simulating the decay of the average intensity as given in Eq. 13.
Background and photon counting noise
As previously described in detail (26), noise in an image series was considered to be due to both counting and background noise. The method used to add noise will only be described briefly here. In TICS analysis, an image series is corrected for background signal, such as scattered light and PMT dark current, by subtracting the mean intensity of an off-cell region. This mean correction does not remove the positive fluctuations of the background noise distribution. To simulate this residual noise distribution, an image matrix without noise, A, with matrix elements aij, is transformed to an image matrix with background noise, C, with matrix elements cij,
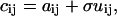 |
(24) |
where U is the same size as A and C, and is composed of the absolute value of normally distributed numbers with a mean of zero, and standard deviation of one. This standard deviation was scaled using a coefficient σ, giving a final image C with a given signal/background, S/B:
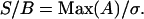 |
(25) |
The Poissonian nature of photon emission ensures that there is always variability in the number of photons emitted from the fluorophore. Additionally, the signal amplification in the PMT electronics broadens the signal distribution in this analog detection scheme. We approximate this broadened signal distribution as a Gaussian. To model this behavior, the image matrix A, was modified to yield an image with noise, C,
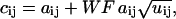 |
(26) |
where U is a matrix, the same size of A, and contains normally distributed random numbers with a mean of zero, and a standard deviation of one. The parameter WF is the analog detection-distribution width factor. Note that WF = 1 is the best case scenario, in which the noise present in C is solely of a Poissonian nature. At higher WF, the added noise simulates the amplification of a signal from a PMT-type detector.
Data analysis
TACFs were fit using a Levenberg-Marquardt nonlinear least-squares algorithm. The values at equal τ were not averaged, and were weighted equally when fit. Because lower lag times contain more pairs of images, this fitting scheme weighted the correlation from each pair of images equally, and therefore gave a higher weight to the lower lags as compared to the higher lags, which contained fewer images. This fitting scheme both avoids an arbitrary cutoff in the TACF fit function and improves the precision of the returned fit parameters. In previous work, experimental TACFs were fit using a nonlinear least-squares fit, weighting all points in the decay equally, and points after an arbitrary time lag value were discarded, in an effort to minimize the effect of the inherent noise associated with long time-lag values in the ACF. White noise in the signal contributes to the numerator of Eq. 4 only at lag τ = 0; consequently, points at this lag were given no weight in the fit. The TACF calculated from Eq. 5 was then fit to the corresponding theoretical functional form for the underlying transport process.
The parameters returned from the fit of the TACFs would be improved if the points in the decay were weighted by their standard deviation. However, a theoretical derivation for the standard deviation of image correlation function time lags has not been undertaken as has been done for FCS (17,18). Thus, the accuracy and precision of the TICS presented here is a baseline that can be improved upon in the future.
The quality of a fit is judged using the χ-squared statistic, χ2,
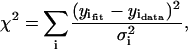 |
(27) |
where the sum is over each point in the fit, and  is the variance of the ith point. It is customary to define a reduced χ-squared value,
  which is independent of the number of degrees of freedom of the fit,
 |
(28) |
where ν is the number of points in the fit, and n is the number of fit parameters.
Live cell imaging
CHO K1 cells transfected with EGFP/α-actinin were plated on fibronectin-coated (5 μg/mL) #1.5 coverslips. Cells were imaged at 37°C using a Bioptechs FCS2 incubation chamber (Butler, PA) 30 min to 3 h after plating. Images were collected with a Bio-Rad RTS2000MP two-photon microscope (Hercules, CA) in inverted configuration. Excitation was provided with a Mai-Tai pulsed femtosecond Ti:Sapphire laser (Spectra Physics, Mountain View, CA), tuned to 890 nm, and laser power at the focus was attenuated to <5 mW using neutral density filters. Fluorescence was collected by a 60× PlanApo oil immersion objective (NA 1.4) through a fully opened pinhole, using a 560 DCLPXR dichroic and an HQ528/50 emission filter. Individual cells were viewed with a zoom that gave a resolution 0.118 μm/pixel in both x and y directions. Time series of 45 images were collected with 5 s between consecutive scans. Control measurements were performed on nontransfected cells to test for the presence of autofluorescence. Negligible autofluorescence was detected using the collection conditions described above. Additionally, labeled cells fixed in 4% paraformaldehyde for 20 min at room temperature were used as controls for drift in the stage position, focus, and laser power.
RESULTS AND DISCUSSION
Spatiotemporal sampling
The effect of temporal sampling on the precision of TICS measurements was studied using simulations of laser scanning microscopy image time series, with a variable number of images, but constant transport dynamics, densities, and image sizes (Fig. 1 A). Both two- and three-dimensional diffusion coefficients obtained via TICS are systematically underestimated (i.e., τd is overestimated) when few images are included in the analysis. Conversely, flow rates are accurately determined even with low temporal sampling. If the number of images in a series places the analysis in a nonbiased regime, then acquiring additional images results in an increased precision proportional to the square-root of the number of images. This trend is verified by the magnitude of the error bars in Fig. 1 A, and is plotted explicitly for two-dimensional diffusion simulations, as an inset (slope: 0.7 ± 0.3, R2 = 0.89).
FIGURE 1.

(A) A plot of the relative error for recovered characteristic decay times as a function of the number of τd or τf (characteristic fluctuation times), as averaged from 100 simulations. The error bars are mean ± SD. The simulations contained a variable number of images, each with an area of 1304 beam areas (BAs), a fixed τd or τf of four frames, and an average density of five particles per BA. The inset shows that when in a nonbiased regime, the reciprocal relative standard deviation grows as the square-root of the number of τd in the series. The relative standard deviation of either τd or τf was calculated as the ratio of the standard deviation of 100 values to the value set in the simulation. The error bars are calculated according to Taylor (36). (B) A plot of the reciprocal of the relative standard deviation for recovered characteristic decay times as a function of the square-root of the number of BAs sampled per image (characteristic fluctuation areas). Linear regression lines to the data are shown. The simulations contained 100 images, each with a variable number of BAs per image, a τd or τf of four frames, and an average density of five particles per beam area.
In most cases, image subregions, and not the full image, are analyzed in ICS studies on living cells due to spatial heterogeneities in molecular distributions across mammalian cells. The e−2 radius beam focal spot size sets the characteristic spatial fluctuation sample size (beam area, BA) for ICS. A typical adherent CHO cell has an area of ∼2500 μm2 (11) on its basal membrane, and would therefore have 8800 BAs when observed with a typical LSM. However, TICS analyses are routinely performed on regions of only 40–700 BAs for the reason stated above. Adequate spatial sampling must therefore be balanced against efforts to resolve cellular spatial heterogeneity by reducing the analysis subregion size.
We, therefore, studied the effect of spatial sampling on the precision of TICS measurements using simulations of laser scanning microscopy image time series, with variable image sizes, but constant transport dynamics, and temporal sampling (Fig. 1 B). As expected from basic signal/noise theory (31), the precision (or true value divided by the standard deviation) of a measurement increases linearly with the square-root of the number of samples (flow slope: 1.01 ± 0.06, R2 = 0.99; two-dimensional diffusion slope: 0.43 ± 0.02, R2 = 0.94; three-dimensional diffusion slope: 0.55 ± 0.02, R2 = 0.99). Although the precision of TICS measurements of all three processes examined scale with the square-root of the number of samples, their proportionality constants vary. These differences are due to the processes' unique relaxation methods. The relative magnitude of the slopes agrees qualitatively with those predicted by Zwanzig and Ailawadi (32).
At image areas smaller than those shown in Fig. 1 B, a bias is introduced as with temporal sampling. However, this regime was not further investigated because regions of interest smaller than 20 beam areas are not typically used in TICS analyses. Furthermore, the low precision associated with such small areas would render their analysis of limited utility.
In theory, the systems simulated were completely ergodic, so spatial and temporal sampling should be equivalent, and a reduction in one can be compensated for by increasing the other. A typical TICS experiment contains far fewer samples in time than does an FCS experiment, but, each image is comprised of many beam areas, effectively creating a parallel FCS experiment. However, it should be noted that the effect of reducing temporal sampling is different from decreasing spatial sampling. In the latter case, the only change is sampling fewer spatial fluctuations, resulting in a decrease in precision of the points in the TACF. However, shortening the time of the experiment introduces a bias in the experimental TACF since it becomes a biased estimator of the true TACF when calculated from a short, finite data set (17,24). Additionally, reducing the number of images in the series results in a TACF with fewer points included in the fit. In the extreme limit of sampling only one τd using our simulation parameters, this results in a total of only four images in the series, and only three different lags in the time decay. This decrease in temporal sampling not only causes a decrease in the precision of the results, but also introduces a systematic bias if only a few images are analyzed (Fig. 1 A). In other words, even if a large number of short image series are analyzed, the mean value of recovered transport coefficients will differ significantly from their true value. This bias is a result of the combination of the inherent problems associated with fitting Eq. 6 or 8 to so few points, and the statistical effect of calculating a correlation function from a small data set.
Sampling rate
On LSM systems, there is some flexibility regarding the image acquisition rate. To investigate the effect of the temporal sampling frequency on the ability of TICS to recover transport coefficients, we generated simulated image series in which the total time (i.e., the total number of characteristic fluctuation times sampled) was kept constant, and the frequency of image acquisition was changed (Fig. 2). As long as there are at least two images sampled per correlation time, the rate of diffusion or flow can be determined precisely. As the sampling rate increases past this threshold, the precision increases due to an increased number of images in the series, as described in the previous section.
FIGURE 2.

A plot of the relative standard deviation for recovered characteristic decay times as a function of the sampling frequency. The relative standard deviation of either τd or τf was calculated as the ratio of the standard deviation of 100 simulation results to the true (set) value. The error bars are calculated according to Taylor (36). The simulations contained a variable number of total images in the series, each with an area of 1304 BAs, a density of five particles per BA, and a fixed τd or τf of four frames.
To ensure the trends in Fig. 2 were not artifacts introduced by changing the number of images in each series, we generated a second set of simulated image series. In this set of simulations, the sampling rate and the total time were held constant, but the characteristic correlation time was changed. These simulations verified the sampling criterion of at least two images per correlation time established by Fig. 2 (data not shown). Furthermore, the precision did not increase significantly as the sampling rate was increased above two images per correlation time. Thus, it is clear that the decrease in precision at sampling rates slow compared to the characteristic fluctuation time is caused by the sampling rate—and not the number of fluctuations sampled, or the number of images in the series. Assuming that at least two images per correlation time are sampled, then it is the total number of images in the series, and not the image sampling frequency relative to τd or τf that determines the precision. Oversampling these processes does not significantly improve the precision or the accuracy of the result. This has three important consequences. First, one need not be overly concerned with determining an optimal sampling frequency since the criterion is usually easy to meet under typical experimental conditions for LSM imaging of membrane proteins. Second, since two observations are required to adequately sample each correlation time, an upper limit is created on the dynamics observable given an image sampling frequency. The combination of these two parameters effectively determines the maximum diffusion or flow rate, which can be detected by a particular imaging system with a given correlation area or volume. Practically, this means that the timescales accessible via traditional TICS are much slower than those previously probed using FCS. However, recently the image raster scan mechanism on a LSM has been exploited to obtain fast dynamics (33), bridging the gap in timescales between FCS and TICS. Third, for a given image size, the precision of a given measurement is ultimately determined by the temporal sampling. The number of images in the series is, in turn, determined by the photobleaching of the sample, or the time in which the system remains stationary.
Density effects
The precision of a measurement in fluctuation spectroscopy is determined by two opposing effects. On one hand, the magnitude of each intensity fluctuation (Eq. 1) should be maximized by using a small correlation volume and a low fluorophore concentration. On the other, the number of fluctuations sampled should be high, commensurate with a high density. This balance is exemplified by the effect of density on the precision of measured τd-values, for both two- and three-dimensional diffusion (Fig. 3). At lower densities, too few particles are sampled, resulting in a decrease in the precision of the results. At higher densities, the relative fluctuations decrease due to the larger number of particles in the focal area/volume. These opposing effects are balanced in the density/concentration range of 0.5–5 particles per beam volume, giving the optimum concentration for TICS diffusion studies. The density in a cellular system is usually not an experimentally controlled parameter; however, it is clear that TICS can still reveal meaningful dynamics over five orders of magnitude of concentration. The precision of measured flow rates is independent of the density of the sample due to the deterministic mechanics of directed flow (Fig. 3). In all three transport regimes, there was no significant bias at any density level. At very high densities and concentrations, nonideality would become significant, as described by Abney et al. (34).
FIGURE 3.

A plot of the relative standard deviation for recovered characteristic decay times as a function of the number of particles per BA (two-dimensional simulations) or effective beam volume (three-dimensional simulations). The relative standard deviation of either τd or τf was calculated as the ratio of the standard deviation of 100 simulation results to the true (set) value. The error bars are calculated according to Taylor (36). The simulations contained 100 images, each with an area of 1304 BAs, and a fixed τd or τf of four frames.
Recovery of immobile population
A population of membrane proteins frequently has an immobile fraction, usually attributed to crowding interactions or binding with cytoskeletal or scaffolding proteins (25). In contrast to FCS, the long correlation time offset in the TACF of ICS is sensitive to the presence of immobile proteins (11). In cases of a low immobile fraction (<10%), it is difficult to extract a precise value for the immobile population from the TACF with this sampling (Fig. 4). However, as the immobile fraction increases, it can be measured with great precision.
FIGURE 4.

A plot of the relative standard deviation for recovered percentage of immobile particles as a function of the set percentage of immobile particles. The relative standard deviation of the percent immobile was calculated as the ratio of the standard deviation of 100 simulation results to the true (set) value. The error bars are calculated according to Taylor (36). The simulations contained 100 images, each with an image area of 1304 beam areas, and a fixed τd or τf of four frames. The total number of particles was kept constant at five per beam area on average, and the ratio of the number of immobile to mobile particles was varied.
Photobleaching
To investigate the effect of photobleaching in TICS analysis, we ran a series of simulations in which we varied the rates of a mono-exponential bleaching process. We found photobleaching perturbs a TACF in two distinct ways (Fig. 5). First, it increases the amplitude of the TACF, yielding number densities that are significantly lower than the true particle density, as is expected. Second, photobleaching causes the TACF to decrease more quickly than in the absence of photobleaching, resulting in a systematic underestimation of either τd or τf. For the diffusion simulations shown in Fig. 5 with a set τd of 4.0 frames, the recovered τd values were 4.1, 4.0, 3.8, and 3.4 for the increasing bleach rates. This effect is caused by intensity fluctuation correlations disappearing faster than they would if only transport were present.
FIGURE 5.

Representative plot of (A) mean intensity and (B) TACF amplitude as a function of time or time lag for photobleaching simulations. Simulations were generated in which the bleaching followed Eq. 12 with five different values of k (images−1). The average image intensity decays exponentially as a function of image number. Photobleaching increases both the amplitude and the rate of decay of the correlation function for each simulation (B). The image time-series simulations were of two-dimensional diffusion; contained 100 images, each with an area of 326 BAs; a τd of four frames; an average density of 2.5 particles per beam area; and a counting noise WF of 5.
The severity of these two systematic effects differs significantly. The transport coefficients, τd or τf, exhibit an increasing negative bias as k increases (Fig. 6 A). However, this bias never surpasses 10% for flow studies, and is approximately the same value for diffusion if the bleaching is only moderate (k ≤ 0.025 images−1). However, if the fluorophore is susceptible to bleaching, the recovered value of τd can be up to 40% lower than the true value. This bias was undetected in the previous preliminary study on the accuracy of TICS (15), because microspheres that exhibit minimal photobleaching were used. The recovered τd values are more sensitive to photobleaching than the τf-values because, if Eqs. 6 and 8 are each multiplied by a constant value, the characteristic decay constant of the former will be affected to a greater degree when extracted algebraically.
FIGURE 6.

The mean relative error in the TICS measured (A) characteristic decay constants, and (B) number densities, in the presence of photobleaching without bleaching correction. When the bleaching correction is used, the decay constants (C) and number densities (D) are measured without a bias. Error bars are mean ± SD from 100 simulations. The image series simulations contained 100 images, each with an image area of 1304 BAs, a τd or τf of four frames, and an average density of five particles per BA.
As shown in Fig. 6 B, the relative error in the number densities as determined from the amplitude of the TACF has a significant bias even at relatively low bleaching rates. For example, when k = 0.02 images−1 (corresponding to a decrease in average intensity of ∼30% after 20 images), the number density obtained from the amplitude of the TACF is more than three times lower than the true density. This perturbation is so severe that it had previously prevented the determination of number densities via TICS.
To correct for photobleaching, Eq. 20 was used to fit the TACFs. The value of k was determined beforehand for each image series analyzed by fitting the average image intensity over time to a single exponential decay. Thus, all variables in the photobleaching correction term are held fixed during the fit, and the number of fitting parameters is the same as without the correction. Furthermore, we do not require any prior knowledge concerning the bleaching rate of the fluorophores as all relevant information is obtained from the image series itself. Also, the decay in average intensity can be fit with any appropriate function, as described in Theory, above.
The correction derived in Photobleaching, Theory, above, completely removes the bias associated with photobleaching for both transport coefficients (Fig. 6 C) and number densities (Fig. 6 D). Furthermore, the correction does not adversely affect the results obtained from simulations with zero or nearly negligible bleaching. It should thus be applied to those TICS analyses in which bleaching is present, and would be adequately modeled by Eq. 12 or Eq. 13.
In measurements on a commercial CLSM with standard excitation with the 488-nm line of an Ar+ laser, we have found EGFP has a k-value of ∼0.02–0.03 images−1 (data not shown), depending on the imaging conditions, and therefore exhibits minimal bleaching effects. However, fluorophores such as CFP and DsRed are much more susceptible to photobleaching (35), and will therefore exhibit a higher k, resulting in a non-negligible perturbation of a TICS measurement. We want to emphasize that, even under cases of high bleaching rates, TACFs can appear to be fit well with a functional decay model that does not include bleaching terms (e.g., Eqs. 6 and 8) but with hidden systematic errors. These systematic errors can be avoided by applying our correction procedure.
Additionally, the photobleaching correction can be extended to temporal cross correlation measurements (11), in which fluorophores bleach at different rates.
We should note that no correction is needed if the full spatiotemporal autocorrelation function is calculated to determine the direction of concerted protein fluxes in cells (STICS (12)). In this case, the center of a Gaussian is tracked, and its position will be independent of photobleaching.
Noise
As previously described in detail for spatial ICS (26), we divide the noise contributions in TICS measurements into two categories. Background noise results from scattered light or detector dark current, while counting noise is caused by inherent counting statistics and the signal amplification electronics. Although both are simultaneously present in a real image series, this distinction is useful because each can be simulated and measured separately experimentally. Background noise is determined using Eq. 25 after subtracting the mean value of a background (i.e., off-cell) region. The counting noise WF must be determined for a given PMT voltage using a constant signal source, such as a concentrated dye solution.
Background noise is ubiquitous and can only be completely subtracted from the image if the S/N is very high. Any residual intensity has been shown to perturb the number densities obtained from spatial ICS (26). This is also true for TICS. As shown in Fig. 7 A, background noise also introduces a bias in the recovery of number densities from TACF decays. Although the mean value of the background can be subtracted, the positive part of the noise distribution remains in the image, systematically increasing the average intensity of the image. Because the noise is uncorrelated between successive images, it makes no contribution to the numerator in Eq. 4, except at the lag τ = 0, which is given no weight when fitting. However, it does increase the denominator, resulting in an underestimation of g(0, 0, 0) and a systematic overestimation in the number of independent fluorescent entities as shown in Fig. 7 A. If the number of background counts is known, this bias can be corrected as suggested by Koppel (16).
FIGURE 7.

The mean relative error in the TICS measured number densities, in the presence of (A) background noise and (B) counting noise. Error bars are mean ± SD from 100 simulations. The image series simulations contained 100 images, each with an area of 1304 BAs, a τd or τf of four frames, and an average density of five particles per BA.
Compared to background noise, counting (detector) noise introduces a relatively small bias in the recovery of number densities (Fig. 7 B). However, this is encountered only at high instrumental width factors, i.e., for high PMT voltages in analog detection. In any case under most experimental conditions, the noise added by light detection will likely be dwarfed by the more severe error introduced via background noise.
Both background noise and counting noise did not significantly affect the standard deviation or bias in the recovery of transport coefficients at the experimentally encountered noise levels investigated (data not shown). Spatiotemporal sampling is clearly the limiting parameter in the measurement of dynamics via TICS.
TICS measurements in living cells considering noise, photobleaching, and sampling
To show that the photobleaching correction presented earlier can be applied to TICS analyses of living cells, we imaged EGFP/α-actinin fusion proteins in the basal membrane of CHO cells. After collecting a time series of 45 images at 0.2 Hz, a subregion of the lower membrane (Fig. 8) was selected for TICS analysis. Background noise was removed by subtracting the mean intensity of an off-cell region from the image series. The average intensity of the region of interest, after background subtraction, was plotted as a function of image number (Fig. 9 A), and was fit to an exponential decay. The noise in the average intensity decay is likely due to a combination of the small size of the region analyzed, and the noise associated with light collection and detection.
FIGURE 8.

Two-photon LSM image of EGFP/α-actinin in a CHO cell plated on fibronectin. The 94 × 74 pixel2 subregion analyzed is outlined in white, contained 81 beam areas, and 45 frames at 0.2 Hz.
FIGURE 9.

(A) A plot of the average intensity of each frame from the region of interest image series (Fig. 8) fit to a single exponential. The line of best fit is I/I0 = exp [−0.0050 s−1 t]. The bi-exponential fit yielded equal decay constants, equivalent to the mono-exponential fit (data not shown). (B) The experimental TACF for the cell region highlighted in Fig. 8 (·) along with the line of best fit to Eq. 6 (two-dimensional diffusion, - - -) and Eq. 20 (two-dimensional diffusion with photobleaching correction, —). The residuals for each fit are shown below their respective plots.
The calculated TACF of the region of interest is shown in Fig. 9 B. As with the simulations, the data is fit well by the theoretical model for diffusion without a photobleaching correction (Eq. 6, dashed line,  ). As noted earlier, the good fit does not imply either that photobleaching was not present or that the values from the fit are not biased parameters. The τd from this fit was 49.2 s, the cluster density was 6.6 per BA, and no immobile fraction was detected. When the photobleaching correction was used in the fitting (Eq. 20, solid line,
  ), the τd from the fit was 63.1 s, the cluster density was 12.4 per BA, and again no immobile fraction was measured. The trends and relative magnitudes of overestimated amplitudes and underestimated τd values were compatible with the simulation results. Note that the number densities reported by fluorescent correlation techniques are not the absolute number of fluorophores in the focal volume. Rather, TICS measures the mean number of independent fluorescent entities in the focal volume. It cannot be determined if these are monomers, dimers, or oligomers without additional experiments to determine the brightness of a monomeric unit (8).
Given the simulation data presented in previous sections, we expect the τd value recovered from the decay model with bleaching correction to be an unbiased estimator of the true characteristic diffusion time. The spatial sampling, 81 BAs, ultimately limits the precision of the measurement, which is within 24% of the true value. The S/B ratio for this analysis was 30.8, so the number density is likely overestimated by a factor of 19% because of background noise remaining after subtracting the mean value of an off-cell region. The counting noise WF at the PMT voltage used was insignificant compared to that from the background noise (unpublished data from dye solution measurements).
CONCLUSIONS
We examined the effect of spatiotemporal sampling, noise, and photobleaching on temporal autocorrelation functions measured by ICS. If a critical sampling threshold of two images per correlation time is met, then the determination of dynamics is primarily limited by sampling and the precision of transport coefficients increases proportionally with the square-root of spatial sampling, whereas increased temporal sampling decreases bias present in the experimental TACF. In contrast, the recovery of number densities by fitting TACFs was fundamentally limited by residual background counts in the image. These results will allow researchers to estimate both the accuracy and precision of a result from a single TICS measurement. They can also be used to attribute the variation of a group of measurements to either the precision of the technique, or the inherent heterogeneity of the system being studied.
We also examined the effect of photobleaching on TACFs, and found that it causes an overestimation of transport coefficients, and a severe underestimation of number densities. We presented a fitting correction to the TACF, which satisfactorily corrects this bias, and can be extended to bleaching described by arbitrary functions. Furthermore, the correction does not require any prior knowledge of the photophysics of the fluorophore under consideration as the parameters relevant to the correction can be extracted directly from the analyzed image series. We expect the photobleaching correction to be of great utility for future TICS studies. Additionally, it will be imperative to use such a correction for temporal image cross-correlation measurements, in which an accurate determination of an interacting fraction depends crucially on the amplitudes of the TACF for each component, as well as the amplitude of the cross-correlation function.
SUPPLEMENTARY MATERIAL
An online supplement to this article can be found by visiting BJ Online at http://www.biophysj.org.
Supplementary Material
Acknowledgments
We thank Prof. A. R. Horwitz (University of Virginia) for his generous gift of the transfected CHO cell line.
D.L.K. thanks Natural Sciences and Engineering Research Council of Canada and Le Fonds québécois de la recherche sur la nature et les technologies for their financial support, as well as Prof. D. Ronis, J. Rossner, A. Bashir, and M. Sergeev (McGill), for helpful discussions and technical assistance. S.C. acknowledges financial support from a Canadian Institutes of Health Research Neurophysics Training grant. P.W.W. thanks NSERC, CIHR, and FQRNT for financial support, as well as Prof. Mark Ellisman (University of California, San Diego) for providing time on the two-photon microscope at the National Center for Microscopy and Imaging Research.
References
- 1.Magde, D., E. Elson, and W. W. Webb. 1972. Thermodynamic fluctuations in a reacting system—measurement by fluorescence correlation spectroscopy. Phys. Rev. Lett. 29:705–708. [Google Scholar]
- 2.Korlach, J., P. Schwille, W. W. Webb, and G. W. Feigenson. 1999. Characterization of lipid bilayer phases by confocal microscopy and fluorescence correlation spectroscopy. Proc. Natl. Acad. Sci. USA. 96:8461–8466. [DOI] [PMC free article] [PubMed] [Google Scholar]
- 3.Widengren, J., U. Mets, and R. Rigler. 1999. Photodynamic properties of green fluorescent proteins investigated by fluorescence correlation spectroscopy. Chem. Phys. 250:171–186. [Google Scholar]
- 4.Widengren, J., J. Dapprich, and R. Rigler. 1997. Fast interactions between Rh6G and dGTP in water studied by fluorescence correlation spectroscopy. Chem. Phys. 216:417–426. [Google Scholar]
- 5.Cluzel, P., M. Surette, and S. Leibler. 2000. An ultrasensitive bacterial motor revealed by monitoring signaling proteins in single cells. Science. 287:1652–1655. [DOI] [PubMed] [Google Scholar]
- 6.Brock, R., M. A. Hink, and T. M. Jovin. 1998. Fluorescence correlation microscopy of cells in the presence of autofluorescence. Biophys. J. 75:2547–2557. [DOI] [PMC free article] [PubMed] [Google Scholar]
- 7.Ruan, Q., M. A. Cheng, M. Levi, E. Gratton, and W. W. Mantulin. 2004. Spatial-temporal studies of membrane dynamics: scanning fluorescence correlation spectroscopy (SFCS). Biophys. J. 87:1260–1267. [DOI] [PMC free article] [PubMed] [Google Scholar]
- 8.Petersen, N. O., P. L. Hoddelius, P. W. Wiseman, O. Seger, and K. E. Magnusson. 1993. Quantitation of membrane receptor distributions by image correlation spectroscopy: concept and application. Biophys. J. 65:1135–1146. [DOI] [PMC free article] [PubMed] [Google Scholar]
- 9.Saxton, M. J., and K. Jacobson. 1997. Single-particle tracking: applications to membrane dynamics. Annu. Rev. Biophys. Biomol. Struct. 26:373–399. [DOI] [PubMed] [Google Scholar]
- 10.Axelrod, D., P. Ravdin, D. E. Koppel, J. Schlessinger, W. W. Webb, E. L. Elson, and T. R. Podleski. 1976. Lateral motion of fluorescently labeled acetylcholine receptors in membranes of developing muscle fibers. Proc. Natl. Acad. Sci. USA. 73:4594–4598. [DOI] [PMC free article] [PubMed] [Google Scholar]
- 11.Wiseman, P. W., C. M. Brown, D. J. Webb, B. Hebert, N. L. Johnson, J. A. Squier, M. H. Ellisman, and A. F. Horwitz. 2004. Spatial mapping of integrin interactions and dynamics during cell migration by image correlation microscopy. J. Cell Sci. 117:5521–5534. [DOI] [PubMed] [Google Scholar]
- 12.Hebert, B., S. Costantino, and P. W. Wiseman. 2005. Spatiotemporal image correlation spectroscopy (STICS) theory, verification, and application to protein velocity mapping in living CHO cells. Biophys. J. 88:3601–3614. [DOI] [PMC free article] [PubMed] [Google Scholar]
- 13.Wiseman, P. W., P. Höddelius, N. O. Petersen, and K. Magnusson. 1997. Aggregation of PDGF-β receptors in human skin fibroblasts: characterization by image correlation spectroscopy (ICS). FEBS Lett. 401:43–48. [DOI] [PubMed] [Google Scholar]
- 14.Srivastava, M., and N. O. Petersen. 1998. Diffusion of transferrin receptor clusters. Biophys. Chem. 75:201–211. [DOI] [PubMed] [Google Scholar]
- 15.Wiseman, P. W., J. A. Squier, M. H. Ellisman, and K. R. Wilson. 2000. Two-photon image correlation spectroscopy and image cross-correlation spectroscopy. J. Microsc. 200:14–25. [DOI] [PubMed] [Google Scholar]
- 16.Koppel, D. E. 1974. Statistical accuracy in fluorescence correlation spectroscopy. Phys. Rev. A. 10:1938–1945. [Google Scholar]
- 17.Saffarian, S., and E. L. Elson. 2003. Statistical analysis of fluorescence correlation spectroscopy: the standard deviation and bias. Biophys. J. 84:2030–2042. [DOI] [PMC free article] [PubMed] [Google Scholar]
- 18.Wohland, T., R. Rigler, and H. Vogel. 2001. The standard deviation in fluorescence correlation spectroscopy. Biophys. J. 80:2987–2999. [DOI] [PMC free article] [PubMed] [Google Scholar]
- 19.Ulrich, M., T. Wohland, R. Rigler, and H. Vogel. 1999. Resolution of fluorescence correlation measurements. Biophys. J. 76:1619–1631. [DOI] [PMC free article] [PubMed] [Google Scholar]
- 20.Qian, H. 1990. On the statistics of fluorescence correlation spectroscopy. Biophys. Chem. 38:49–57. [DOI] [PubMed] [Google Scholar]
- 21.Kask, P., R. Günther, and P. Axhausen. 1997. Statistical accuracy in fluorescence fluctuation experiments. Eur. Biophys. J. 25:163–169. [Google Scholar]
- 22.Bartlett, M. S. 1946. On the theoretical specification and sampling properties of autocorrelated time-series. J. Royal Statist. Soc. Suppl. 8:27–41. [Google Scholar]
- 23.Marriott, F. H. C., and J. A. Pope. 1954. Bias in the estimation of autocorrelations. Biometrika. 41:390–402. [Google Scholar]
- 24.Oliver, C. J. 1979. Spectral analysis with short data batches. J. Phys. A. 12:591–617. [Google Scholar]
- 25.Jacobson, K., D. O'Dell, and J. T. August. 1984. Lateral diffusion of an 80,000-Dalton glycoprotein in the plasma membrane of murine fibroblasts: relationships to cell structure and function. J. Cell Biol. 99:1624–1633. [DOI] [PMC free article] [PubMed] [Google Scholar]
- 26.Costantino, S., J. W. D. Comeau, D. L. Kolin, and P. W. Wiseman. 2005. Accuracy and dynamic range of spatial image correlation and cross–correlation spectroscopy. Biophys. J. 89:1251–1260. [DOI] [PMC free article] [PubMed] [Google Scholar]
- 27.Srivastava, M., and N. O. Petersen. 1996. Image cross-correlation spectroscopy: a new experimental biophysical approach to measurement of slow diffusion of fluorescent molecules. Methodol. Cell Sci. 18:47–54. [Google Scholar]
- 28.Petersen, N. O. 2001. FCS and spatial correlations on biological surfaces. In Fluorescence Correlation Spectroscopy, R. Rigler, and E. S. Elson, editors. Springer, New York, Berlin. 162–184.
- 29.Magde, D., W. W. Webb, and E. L. Elson. 1978. Fluorescence correlation spectroscopy. III. Uniform translation and laminar flow. Biopolymers. 17:361–376. [Google Scholar]
- 30.Aragón, S. R., and R. Pecora. 1976. Fluorescence correlation spectroscopy as a probe of molecular dynamics. J. Chem. Phys. 64:1791–1803. [Google Scholar]
- 31.Ingle, J. D. J., and S. R. Crouch. 1988. Signal-to-noise ratio considerations. In Spectrochemical Analysis. Prentice Hall, Englewood Cliffs, NJ. 135–163.
- 32.Zwanzig, R., and N. K. Ailawadi. 1969. Statistical error due to finite time averaging in computer experiments. Phys. Rev. 182:280–283. [Google Scholar]
- 33.Digman, M. A., P. Sengupta, P. W. Wiseman, C. M. Brown, A. R. Horwitz, and E. Gratton. 2005. Fluctuation correlation spectroscopy with a laser-scanning microscope: exploiting the hidden time structure. Biophys. J. 88:L33–L36. [DOI] [PMC free article] [PubMed] [Google Scholar]
- 34.Abney, J. R., B. A. Scalettar, and C. R. Hackenbrock. 1990. On the measurement of particle number and mobility in nonideal solutions by fluorescence correlation spectroscopy. Biophys. J. 58:261–265. [DOI] [PMC free article] [PubMed] [Google Scholar]
- 35.Harms, G. S., L. Cognet, P. H. M. Lommerse, G. A. Blab, and T. Schmidt. 2001. Autofluorescent proteins in single-molecule research: applications to live cell imaging microscopy. Biophys. J. 80:2396–2408. [DOI] [PMC free article] [PubMed] [Google Scholar]
- 36.Taylor, J. R. 1997. An Introduction to Error Analysis, 2nd Ed. University Science Books, Mill Valley, CA.
Associated Data
This section collects any data citations, data availability statements, or supplementary materials included in this article.