Abstract
The complexity of RNA hairpin folding arises from the interplay between the loop formation, the disruption of the slow-breaking misfolded states, and the formation of the slow-forming native base stacks. We investigate the general physical mechanism for the dependence of the RNA hairpin folding kinetics on the sequence and the length of the hairpin loop and the helix stem. For example, 1), the folding would slow down when a stable GC basepair moves to the middle of the stem; 2), hairpin with GC basepair near the loop would fold/unfold faster than the one with GC near the tail of the stem; 3), within a certain range of the stem length, a longer stem can cause faster folding; and 4), certain misfolded states can assist folding through the formation of scaffold structures to lower the entropic barrier for the folding. All our findings are directly applicable and quantitatively testable in experiments. In addition, our results can be useful for molecular design to achieve desirable fast/slow-folding hairpins, hairpins with/without specific misfolded intermediates, and hairpins that fold along designed pathways.
INTRODUCTION
Recent experimental and theoretical studies on RNA hairpin folding kinetics are beginning to shed light on full complex folding energy landscapes and folding kinetics for RNA (and DNA) hairpins (1–18). RNA hairpin folding kinetics is found to give a wide range in magnitude and sign of the folding activation barriers for different sequences and for different temperatures (12–18). Furthermore, from the general theory developed in the previous article, we find that RNA hairpins, even though simple in structure, can be very complex in the folding kinetics. For example, depending on the nucleotide sequence, the folding can be rate-limited by the formation of the loop; or by the slow formation of the base stacks; or by the slow disruption of a misfolded non-native base stack. Moreover, the hairpin structure can form cooperatively through a two-state transition, or noncooperatively through multiple intermediate states. And a decrease in temperature can accelerate or decelerate the folding process.
Different sequences of the hairpins can have a wide range of very different folding kinetics behaviors. Most of the previous studies are focused on isolated sequences and the effect of loop closure on the folding kinetics. In this study, we go beyond the isolated sequences by exploring systematically the sequence and structural dependence of the folding kinetics by investigating how the loop length, loop sequence, stem length, and stem sequence affect the hairpin folding kinetics. In addition, we investigate the effect of the kinetic intermediates, especially the misfolded intermediates, on the folding kinetics. We found that certain misfolded intermediates may assist the folding process by lowering the entropic barrier of folding.
Since this study is based on the general RNA hairpin folding theory developed in the previous article, we first briefly summarize major conclusions from the general theory.
We describe the chain conformations according to base stacks. Different conformations are kinetically connected through a kinetic move set defined as the formation and disruption of a base stack or a stacked basepair. The rate of a kinetic move is given by  and
and  for the formation and breaking of a base stack (or a basepair), respectively. Here ΔS and ΔH are the corresponding entropy and enthalpy changes. As a result, the rate-limiting steps of folding correspond to the formation of the native base stacks with the largest entropy decrease ΔS and the disruption of the non-native base stacks with the largest enthalpy cost ΔH.
RNA hairpin folding can involve the following four types of rate-limiting steps:
Loop nucleation, i.e., the formation of the first base stack of the chain. The process involves the entropy loss from loop closure as well as the formation of the base stack that closes the loop. The rate constant of loop closure is
 where ΔSstack and ΔSloop are the corresponding entropy losses.
- Formation of the rate-limiting stack. The formation of certain base stack s* may involve a significantly large entropy loss ΔSstack* and thus has a slow rate:

(1) - Direct folding. If the loop is closed by a rate-limiting (slow) stack s*, the loop closure would be extremely slow with a rate constant of

(2) Detrapping. The disruption of non-native (nn) base stacks has a rate constant of
 where ΔHnn is the enthalpy cost for the disruption of the non-native base stack. kdetrap is slow for large ΔHnn or low temperature T.
If there is one rate-limiting base stack s*, according to the possible rate-limiting steps, we can classify the conformational ensemble into five types of clusters (i.e., C, Nn, Nnn, In, and Inn):
 |
(3) |
Here the subscripts n and nn denote the conformations without and with the non-native stacks (in the respective clusters), respectively. If kdetrap is large, In and Inn in cluster I can equilibrate quickly, resulting in a merged cluster I = In + Inn, and similarly, Nn and Nnn in cluster N merge into a pre-equilibrated cluster N = Nn + Nnn.
The folding kinetics is a result of the intercluster transitions. In a cluster, there are two types of conformations: pathway conformations and nonpathway conformations. Conformations that directly participate in the intercluster transitions are called pathway conformations. All other conformations are nonpathway conformations. Therefore, the intercluster transitions (between cluster U and N) are realized by the kinetic moves between the pathway conformations Ui in cluster U and the pathway conformations Ni in cluster N, and the resultant rate constant is given by
 |
(4) |
where [Ui] and [Ni] are the equilibrium fractional populations (i.e., Boltzmann distribution) of Ui and Ni in the respective clusters. The kinetic partitioning factor (equal to the probability for taking a microscopic pathway, e.g., Ui → Ni) is determined by
 |
(5) |
The pathways with the largest  are the dominant pathways for U → N. Higher stability (larger [Ui] in Eq. 4) of the pathway conformations (versus nonpathway conformations) and higher stability of the fast-rate pathway conformations (larger
  in Eq. 4) result in a faster kinetics.
Depending on the nucleotide sequence, the Arrhenius plot of the rate-temperature dependence can show non-Arrhenius behavior: there exists a rollover temperature Tr such that the folding activation barrier changes from positive for T ≤ Tr to negative for T > Tr, and the folding kinetics changes from noncooperative (multi-state) to cooperative. Summarized in Table 1 are the four folding kinetic scenarios in different temperature regimes.
TABLE 1.
A summary for the different scenarios of the folding kinetics
| Scenario | Rate-limiting step | Cooperativity | Temperature |
|---|---|---|---|
| 1 | Loop formation | Two-state; C → F (= I + N) | T > Tr |
| 2 | Formation of the rate-limiting native base stack s* | Two-state; U (= C + I) → N | T > Tr |
| 3 | Formation of s* and detrapping from the non-native states | Multi-state; C, In, Inn, Nn, Nnn | T ≤ Tr |
| 4 | Rate-limiting steps not discrete | Glassy | T < Tr |
Loop-length dependence
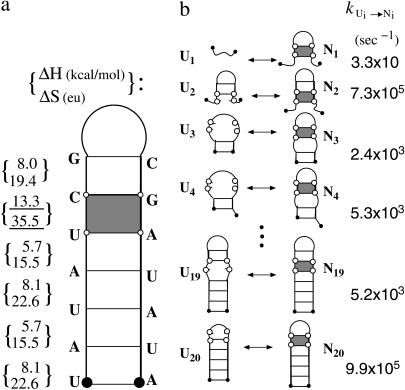
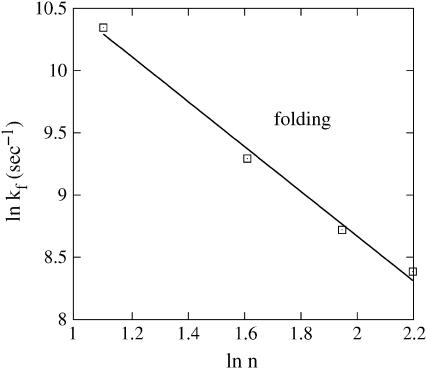
In this section, we investigate the loop-length dependence of the folding kinetics. To be specific, we study a series of sequences UAUAUCGCnCGAUAUA(n = 3–9). The sequences have different loop lengths but have the same helix stem in the native structure. Moreover, the sequences have the same rate-limiting base stack s* = (U,C,G,A), which has the largest ΔS and ΔH (see Fig. 1). We find that as loop size is increased, the folding rate decreases, but the unfolding rate nearly does not change (data not shown). Moreover, we find that the folding rate kf scales with the loop size n as kf ∼ n−1.8 at T = 30°C (Fig. 2). These findings agree with the experimental measurements for hairpin-folding kinetics (18).
FIGURE 1.
(a) The native structure and enthalpic and entropic parameters of the native state for sequence UAUAUCGCnCGAUAUA. The shaded stack is the rate-limiting stack s*. (b) The pathway conformations Ui and Ni (i = 1, 2, … , 20) in the respective clusters U and N, the corresponding intercluster pathways Ui ↔ Ni, and the rate constants.
FIGURE 2.
Loop length-dependence of the relaxation rate for sequence (UAUAUCGCnCGAUAUA) at T = 30°C. Symbols (n = 3, 5, 7, 9): the folding rate solved from the exact master equation for the original (unclustered) conformational ensemble. (Line) The scaling law kf ∼ n−1.8.
To understand the loop-length dependence, we consider the cooperative folding condition (scenario 2:  ) and use the two-cluster model with the native cluster N and unfolded cluster U = C + I. We first consider the unfolding transition N → U for the breaking of the rate-limiting stack s*. The rate kN→U is given by the sum over all the pathway conformations
  Because both [Ni] (= the fractional population of Ni) and
  are independent of the loop length n, the unfolding rate is independent of the loop size.
The folding transition U → N corresponds to the formation of s*. The rate kU→N is given by  Except the direct folding pathway U1 → N1, which has an extremely small rate kdirect (see Eq. 2), the other 19 pathways have the rate
  for the formation of s*. The fractional population [Ui] (i > 1) depends on the loop size through
  So
So  where ΔSloop is the entropy of the native hairpin loop. From the experimental measurements (19) and the theoretical modeling (20), the loop entropy is ΔSloop ∼ kB ln n−1.8. So we have kf ∼ n−1.8 (see Fig. 2). This scaling law for the folding rate, which is obtained from the kinetic cluster analysis, agrees nearly exactly with the experimental data (18).
In the present model, the unfolding is rate-limited by the disruption of the rate-limiting stack s*. Since the enthalpy cost ΔH* for breaking s* is assumed to be n-independent (under 1 M NaCl condition), the unfolding rate  would be nearly independent of the loop size n. However, for small loops under lower ionic concentrations, the loop can be stabilized by excess loop-stem interaction (21–23). Considering the n-dependence of such excess stabilization ΔHexcess, the unfolding rate
  can be n-dependent. Specifically, the loop would unfold faster for larger n. In fact, the n-dependence of the unfolding rate has been estimated from experiments as ku ∼ n2.3 for DNA hairpins under 0.1 M NaCl (18). However, ku for RNA hairpin folding (in 1 M NaCl) may scale differently.
Stem-length dependence
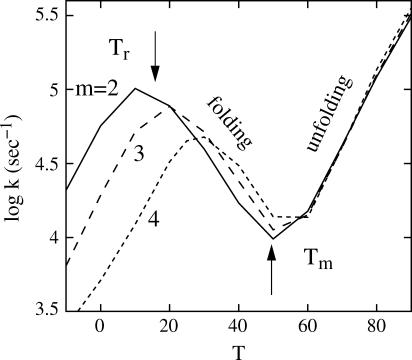
In this section, we investigate the stem-length dependence of folding rate. By adding AU or UA basepairs to the helical stem of the sequence with n = 5 in the previous section, we generate a series of sequences with the same loop size but different stem length: (AU)mCGC5CG(AU)m (m = 2, 3, …). As shown in Fig. 3, we find the stem-length dependence of the folding and unfolding rate, as discussed below.
FIGURE 3.
Temperature (T in °C) and stem-length dependence of the relaxation rate kr for (AU)mCGC5CG(AU)m with m = 2 (solid line), m = 3 (dashed line), and m = 4 (dotted line). The rollover temperature (Tr) and melting temperature (Tm) are different for the sequences. At T < Tr, the kr-value decreases as T is decreasing; at Tr < T < Tm, the kr-value increases as T is decreasing; and at T > Tm, the kr-value increases as T is increasing.
Cooperative folding regime (Tr < T < Tm; scenario 2 in Table 1)
Here Tm ∼ 50°C is the melting temperature (computed from the statistical mechanical model (20)) and Tr ∼ 10°C is the rollover temperature. The fast-folding pathway conformations in cluster U contain helical stems (see U19 and U20 in Fig. 1 b), and the longer helix stem enhances the stability of these fast-folding conformations. Therefore, a longer stem leads to faster folding. However, if the stem is too long, the nonpathway conformations (non-native states in Inn) can be very stable and can dominate the population. This would effectively destabilize the pathway conformation and cause a slow folding.
Noncooperative folding (T < Tr; scenarios 3 and 4 in Table 1)
In this case, detrapping is rate-limiting. As the chain is elongated, the number of non-native conformations quickly increases. This greatly enhances the probability for the chain to fold to the misfolded states, causing a slower folding.
Cooperative unfolding (T > Tm; scenario 2 in Table 1)
At the unfolding temperature T > Tm, the dominant kinetic process is the unfolding. The rate is determined by the (unfolding) rate of the disruption of the rate-limiting stack (N → U),
 |
Here,  and ΔH* is the enthalpy of the rate-limiting stack (U,C,G,A). Since the stem length only weakly affects the fractional population [Ni] of N, the unfolding rate ku is independent of the stem length.
Loop-sequence dependence
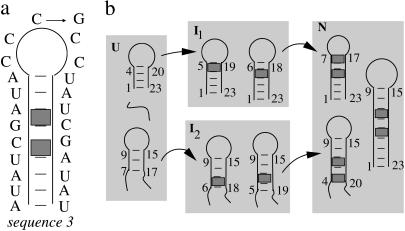
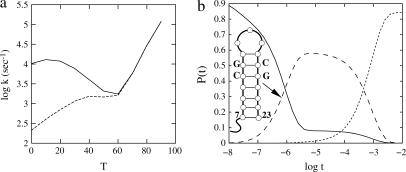
The loop sequence can affect the folding kinetics through two effects: (1), the sequence-dependent, single-stranded stacking in the loop region; and (2), the possible formation of non-native basepairs between the loop and the stem. Here we explore the loop-sequence dependence due to the formation of the non-native basepairs. We make a loop mutation C12 → G for sequence (AU)2CGAUAC5UAUCG(AU)2 (see Fig. 4). The mutation does not alter the native structure (shown in Fig. 4 a) and the unfolding rate, but it notably changes the folding rate and its temperature-dependence (see Fig. 5 a): (1), the wild-type sequence folds much faster than the mutant sequence; and (2), they show opposite temperature-dependence: as the temperature is increased, the wild-type folds more slowly and the mutant sequence folds more quickly.
FIGURE 4.
(a) The wild-type and mutant sequence and structure. (b) The four-cluster system and the most probable folding pathways for U (unfolded) → N (folded) for the wild-type sequence.
FIGURE 5.
(a) The temperature (T in °C) dependence of the relaxation rate for the wild-type sequence (solid line) and the mutant sequence (dashed line). (b) The populational kinetics of the denatured state (solid line), the intermediate state (long dashed line), and the native state (short dashed line) for the mutant sequence at T = 30°C. The inset is the structure of the misfolded intermediate state. Time t is in units of seconds.
The wild-type sequence has two rate-limiting stacks:  ; and
; and  (see Fig. 4). The formation of
  and
and  have rate constants of
  and
and  respectively. According to the two rate-limiting stacks, we classify the conformational ensemble into four clusters:
 |
(6) |
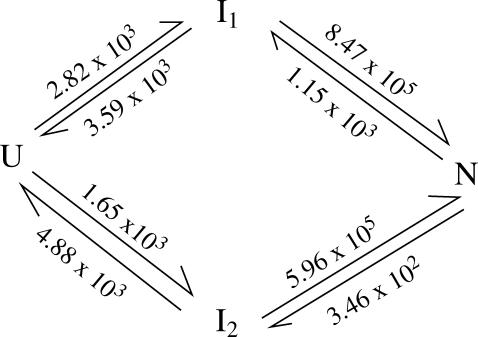
To be specific, we study the kinetics at a representative temperature T = 40°C. We construct the 4 × 4 rate matrix for the four-cluster system (see Fig. 6). The eigenvalues of the four-cluster system are (0, 4.03 × 10³, 5.96 × 10⁵, 8.46 × 10⁵) s−1. The large gap between the lowest nonzero rate and the next nonzero rate clearly indicates that the folding process is single-exponential and the overall folding rate is 4.03 × 10³ s−1. How can the two rate-limiting steps result in a single-exponential kinetics?
The formation of the first rate-limiting stack (
 through U → I1 or
  through U → I2) is extremely slow and is the bottleneck for the overall folding process. The rate is slow because in cluster U, the most populated state (= the fully unfold state) is slow-folding (through direct folding), with the extremely small rate kdirect (see Eq. 2), while the fast-folding conformations (i.e., stacked conformations) occupy <1% of total population in U.
With the first rate-limiting stack formed, the pathway conformations in cluster I1 and I2 would further fold through the formation of the second rate-limiting stack with rate
 for
for  or
or  for
for  Both
Both  and
and  are much faster than the rate for the formation of the first stack. Therefore, the overall folding is rate-limited by the formation of the first stacks and the resultant folding kinetics is single-exponential with a rate of
  Equation 4 gives
  and
and  so kf = 4.47 × 10³ s−1, which is very close to the result from the rigorous eigenvalue 4.03 × 10³ s−1. In Fig. 4 b, we show the dominant pathways predicted from the kinetic partitioning factor
  (see Eq. 5) in the kinetic cluster analysis. As temperature is increased, the slow-folding (fully unfolded) state in U is stabilized, causing a decrease in the folding rate.
FIGURE 6.
The intercluster transition rates (s−1) at T = 40°C for the four kinetic clusters shown in Fig. 4 b for the wild-type sequence shown in Fig. 4 a.
What causes the drastically different folding kinetics for the loop mutation? The mutation causes the stabilization of the (nonpathway) misfolded conformations in cluster U. For example, at T = 30°C, the loop mutation causes the nonpathway conformation population in U to increase from 44.3% (for the wild-type) to 91.7%. Such a dramatic change is due to the formation of stable non-native structures (see Fig. 5 b) formed by the basepairing between a G in the loop and a C in the stem. Stabilizing the nonpathway conformations effectively destabilizes the pathway conformations and causes a decrease in the folding rate. Higher T would destabilize this misfolded state (population drops from 91.7% to 70% as T increases from 30°C to 40°C) and effectively stabilizes the pathway conformations in cluster U and causes a faster folding.
Is this misfolded state a kinetic trap that prevents the pre-equilibration process? No. In fact, it is the result of the pre-equilibration of cluster U. The emergence of the transient intermediate is due to its low free energy relative to all the other states in cluster U. Because its free energy is high relative to the states in N, the intermediate exists only transiently and would disappear when the chain folds into cluster N and the system relaxes to the final equilibrium state.
Stem-sequence dependence
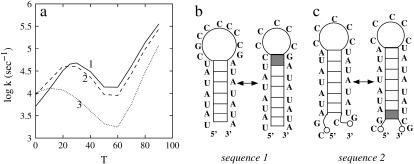
In this section, we study three sequences that have the same loop size and the same stem length, but different stem sequences: sequences 1, 2, and 3, which are shown in Fig. 7, b and c, and Fig. 4 a (wild-type), respectively. The three stem sequences differ by the different positions of two consecutive GC basepairs that form a stable (G, C, G, C) base stack as a clamp in the helix. Specifically, sequences 1, 2, and 3 have the GC clamp near the hairpin loop, at the tail of the stem, and in the middle of the stem, respectively. Sequences 1 and 2 contain one rate-limiting stack, and sequence 3 contains two rate-limiting stacks; see Fig. 7, b and c, and Fig. 4 a, respectively. Plotted in Fig. 7 a are the temperature-dependence of the rates. From the figure, we make the following two observations:
Sequence 1 (with the GC clamp close to the loop) folds faster than sequence 2 (with the GC clamp close to the stem tail). They both have only one rate-limiting stack, so their conformations can both be classified into two clusters U and N (scenario 2 in Table 1), corresponding to conformations with and without the rate-limiting stack formed, respectively. To be specific, we use T = 30°C for illustration. At T = 30°C, the most populated pathway conformation in cluster U, except the fully unfolded state, which is extremely slow-folding, is shown in Fig. 7, b and c, for sequences 1 and 2, respectively. They are the dominant folding pathways with f(path) = 91.8% and 84.9%, respectively. The folding rates along these dominant pathways are
 for sequence 2 and
  for sequence 1, where ΔS* is the entropy change for the formation of the rate-limiting stack and ΔΔSloop is the entropy change due to the change of the loop size from length 7 to 5 in Fig. 7 b. ΔΔSloop is negative. So kseq1 > kseq2, i.e., sequence 1 folds faster than sequence 2.
As the GC clamp moves to the middle, the folding slows down. Sequence 3 has two rate-limiting stacks. As we discussed in the previous section, the folding is limited by the formation of the first rate-limiting stack. The corresponding dominant pathways for sequences 1 and 2 and for sequence 3 are shown in Fig. 7, b and c, and Fig. 4 b, respectively. The dominant pathway conformations in cluster U in Fig. 7, b and c (for sequences 1 and 2), contain continuous stable stacks. However, such highly stacked pathway conformations are not possible for sequence 3 because the otherwise continuous base stacks would be disrupted by the (to-be-formed) rate-limiting stacks in the middle of the stem. As a result, the dominant pathway conformations for sequences 1 and 2 are more stable and the resultant folding rates are larger.
FIGURE 7.
(a) The temperature (T in °C) dependence of the relaxation rate for the three sequences with the GC pair at different positions in the stem. The folding processes are rate-limited by the formation of the rate-limiting stack (solid stack). Panels b and c show the dominant folding pathways for sequences 1 and 2, respectively.
Non-native structure-assisted RNA hairpin folding
For RNA hairpins, the formation of certain misfolded states can assist instead of delay the hairpin-folding process. We use hairpin-forming sequence AUAUCGAGAUCACCCUCUCGAUAU to illustrate this. There are 1021 states for the sequence. The thermal denaturation for this sequence occurs at melting temperature Tm = 68°C (computed from the statistical thermodynamics model (20)). We focus on the kinetics at T = 40°C < Tm.
To understand the microscopic folding pathways, we use the kinetic-cluster analysis. For this sequence, there are three slow-forming native base stacks (with large ΔS),
 |
(7) |
and two slow-disruption non-native rate-limiting stacks (with large ΔH),
 |
(8) |
According to the rate-limiting stacks, we classify the conformational ensemble into 12 clusters:
 |
 |
and
 |
Here Ii = the states with  formed and Iij = the states with both
  and
and  formed. The eigenvalues of the 12-state kinetic cluster system are (0, 1.13, 2.38, 3.93, 5.93, 10.4, …) × 104 s−1. The eigenvalue spectrum of the 12-state system agrees well with that of the original 1021-state system: (0, 1.09, 2.31, 3.80, 5.72, 10.2, …) × 104 s−1. This validates our kinetic cluster analysis based on the 12-cluster system.
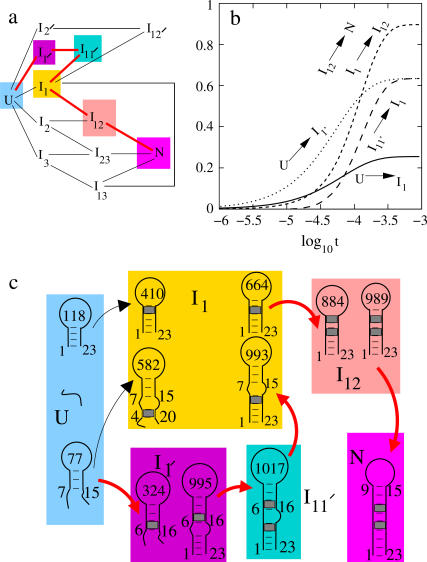
As we discussed for the folding with two (multiple) rate-limiting stacks, the formation of the first rate-limiting native stack is the bottleneck for the overall folding. From the kinetic connectivity diagram in Fig. 8 a, there exist two types of pathways for the formation of the first rate-limiting native stack (s1, s2, or s3):
 |
and
 |
So the total folding rate can be calculated as a sum of these (parallel) pathways:
 |
(9) |
In the above equation,  can be directly computed from Eq. 4. For
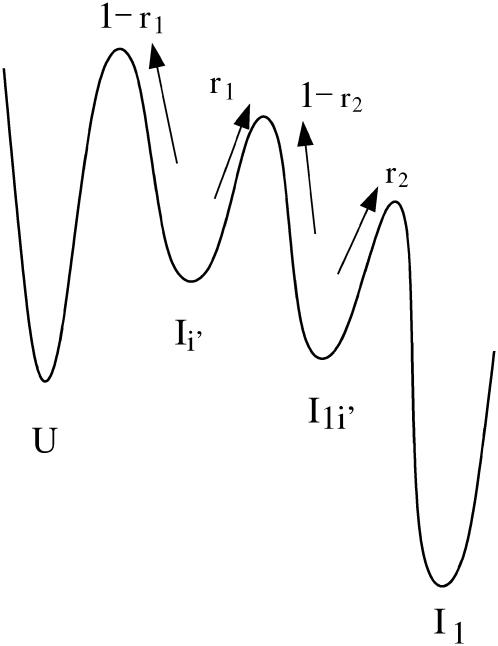
  considering the rebound from the two intermediate states I′i and I1i′, we have (24)
 |
(10) |
where
 |
and
 |
account for the rebound effect (see Fig. 9). Combining the above results, we have kf = 1.15 × 10⁴ s−1. This kf result, which is based purely on the intercluster pathway analysis, agrees very well with the first non-zero rate (1.11 × 10⁴ s−1) solved from the exact master equation for the original complete conformations ensemble.
FIGURE 8.
(a) The kinetic connectivity of the 12-cluster system (the red lines show the main folding pathway). (b) The net fluxes for the intercluster transitions. The net flux curve for I12 → N nearly coincides with the curve for I1 → I12. This means that in the folding process, nearly all the chain conformations entering cluster I12 from I1 would fold into the native cluster N. (c) The main pathways (in red) for the folding at T = 40°C.
FIGURE 9.
For the transition U → Ii′ → I1i′ → I1, some of the population will rebound back from the intermediates Ii′ and I1i′. The value r1 is the probability from U → Ii′, and 1 – r1 is the probability of rebound back from the intermediate from Ii′. The value r2 is the rebound effect for the intermediate from I′1i.
Which pathway dominates the folding process, on-pathway or off-pathway? Because
 |
and
 |
only ∼22.8% population in cluster U folds through the on-pathway route U → I1 and 68% folds through the off-pathway route U → I1′. Therefore, the folding is dominated by the off-pathway process.
To further characterize the populational statistics, we plot in Fig. 8 b the net populational fluxes along pathways U → I1′, I11′ → I1, I1 → I12, and I12 → N. The populational flux PI→J is the (accumulated) probability for the molecule to fold through I → J during time period 0 → t. The populational flux from cluster I to cluster J is defined as (24):
 |
where Pi(t) is the population of the states in cluster i. The results in Fig. 8 b show that  and that
  and
and  quickly rise in the folding process, which confirms that the dominant pathway is the off-pathway route through the formation and disruption of the non-native base stack
  (U → I1′ → I11′ → I1 → I12 → N). How does the formation of the non-native stack
  in I1′ facilitate the folding process?
From the unfolded state U, the formation of the non-native base stack  is much faster than the direct formation of the native base stack
  In the unfolded cluster U, except the fully unfolded state, which has negligible direct folding rate, the most stable pathway conformation is state 77 (see Fig. 8 c), which occupies 1.32% of the total population of U.
The dominant pathway for the formation of the native  is through 77 → 582. This pathway involves the closure of an internal loop, and thus has a slow rate of due to the entropic loss (ΔSintloop) for the formation of the internal loop closed by basepairs (4,20) and (7,15) in state 582 (see Fig. 8 c):
  = 4.16 × 10² s−1. Here
  is the entropy parameter for the formation of stack
On the other hand, the dominant pathway for the formation of the non-native  is through 77 → 324. Since this pathway does not involve the closing of additional loops, it has a much faster rate
  = 6.92 × 10⁵ s−1.
So most of the population in U would quickly fold along the off-pathway route 77 → 324 to form the non-native rate-limiting stack 
Once the non-native base stack  is formed in state 324 in cluster I1′, the pathway conformations in I1′ can be quickly stabilized through the elongation of the helix stem (e.g., 324 → 995 in Fig. 8 c). These stabilized (non-native) pathway conformations would cause fast transitions from I1′. In addition, the stable non-native structures in I1′ can serve as scaffolds to lower the entropic barrier for the further formation of the native rate-limiting stack
  This would accelerate the folding process. For example, transition 995 → 1017 is accompanied by an entropic change ΔΔSintloop < 0 for the decrease in the internal loop size. As a result,
  is much faster than both the direct on-pathway folding rate k77→324 = 4.16 × 10² s−1 and the off-pathway rate k77→324 = 6.92 × 10⁵ s−1.
CONCLUSIONS
Although DNA and RNA hairpins are both stabilized by base-stacking interactions and both have loop formation as a slow step in the folding process, they can have very different folding kinetics. Unlike RNA hairpins, DNAs do not have large separations in the (ΔHstack, ΔSstack) parameters for different base stacks. As a result, for most DNA sequences, hairpins fold through the formation of the stable loop (scenario 1) instead of the slow-folding native base stack (scenario 2).
Furthermore, the cluster model can explain the ion concentration-dependence of the folding and unfolding rates. Following Santalucia (25), we note that the enthalpy ΔHstack for a base stack is nearly independent of [Na+], while the entropy is ΔSstack for a base-stack decrease for higher [Na+] (25).
If the hairpin folding is rate-limited by the formation of a slow-forming base stack, the folding rate  would increase as [Na+] is increased, while the unfolding rate
  does not change with the ion concentration. These ion-dependences of kf and ku agree with the experimental results for RNA duplex association and dissociation kinetics (26).
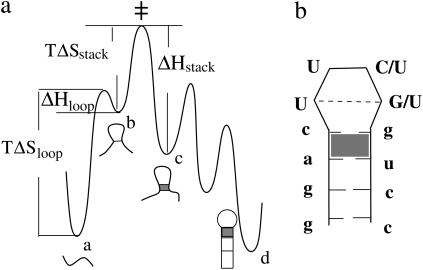
If the hairpin folding is rate-limited by the loop formation (see Fig. 10 a), as the ion concentration is increased, the folding rate  would increase due to the decrease in the entropy. The unfolding rate is given by
  where [c] is the fractional population of state c in Fig. 10 a. Higher ion-concentration stabilizes structures with longer helix stems, e.g., state d (rather than state c) in Fig. 10 a, causing a smaller [c] for state c, which has only one stack. As a result, ku decreases as [Na+] is increased. Moreover, the temperature-dependence of ku is dominated by the
  factor, so the apparent activation barrier of the unfolding does not change with the ion concentration (ΔHstack is assumed to be [Na+]-independent). This is in agreement with the experimental finding (12).
FIGURE 10.
A schematic free energy landscape for hairpin folding and the native structure for ggacUUCGgucc (with tetraloop stabilization) or ggacUUUUgucc (without tetraloop stabilization).
The kinetic-cluster approach allows us to study the kinetic rates, rate-limiting steps, and the pathways for biologically significant RNA hairpins. In this study, we explore the sequence-dependent complex folding and unfolding kinetics for RNA hairpins. The overall hairpin folding process can be rate-limited by the formation of the loop, the formation of the rate-limiting native base stack, and the breaking of the stable non-native base stack. The competition between these different processes leads to the great wealth of different RNA hairpin-folding behavior. The detailed folding kinetics is sequence-specific. Our study reveals several intriguing features for RNA hairpin-folding kinetics (for T > Tr):
The unfolding rate is nearly independent of the loop-length n, and the folding rate decreases for larger loops and scales as n−1.8.
For sequences with a rate-limiting native base stack, the high-temperature unfolding rate is relatively independent of the stem length. The folding rate increases for longer stem length due to the increased stability of the nativelike states. However, the folding rate would decrease if the stem is too long because of the formation of stable misfolded states.
The folding and unfolding kinetics can be dependent on the loop sequence. The basepairs between the loop region and the helical stem region can lead to stable misfolded kinetic intermediates and slow down the folding process. Especially, it is highly possible for the G (C) residues in the loop to pair with C (G) residues in the stem to form a stable non-native (G, C, G, C) stack.
The nucleotide sequence in the stem region is important for the folding/unfolding kinetics. For example, for a stem with GC pairs inserted in a series of AU pairs, the rate is larger for sequences with the GC basepairs close to the hairpin loop than for sequences with the GC pairs at the tail of the stem, and the rate decreases as the GC pairs move to the middle of the stem.
Folding can be assisted by the misfolded states because some stable misfolded states can be fast-folding by forming a scaffold structure to lower the entropic barrier for the formation of the native basepairs.
These stem/loop length and sequence-dependence of the folding kinetics may be a paradigm for more complete and complex analysis of RNA folding kinetics. Moreover, the general length and sequence dependence can provide useful guidance for molecular design for folding rate, pathways, and cooperativity.
In this study, the effect of the specific loops such as the GNRA and UUCG tetraloops are not considered. These tetraloops can have excess stability due to the intraloop base stacking and hydrogen bonding (27–30). As shown below, it is possible to obtain a rough estimate for the kinetic effects by treating the tetraloop as a stable state (state b in Fig. 10 a) on the free energy landscape. To simplify the analysis, we use a rather crude energy landscape to represent the actual free energy landscape. Considering the rebound effect from the intermediate state b, we can estimate the forward folding rate kf (24):
 |
(11) |
With the loop entropy ΔSloop and enthalpy ΔHloop for the tetraloop and the stacking entropy ΔSstack for the (a, c, g, u) stack (see the shaded stack in Fig. 10 b), our rate constant model gives  The excess tetraloop stabilization parameter can be determined as ΔSexcess = ΔSloop –
  and ΔHexcess = ΔHloop, where
  is the entropy of the loop without the tetraloop stabilization.
To directly connect the theory to the experiment, we consider the YNMG RNA hairpins whose folding and unfolding rates have been measured by Proctor et al. (4). We specifically compare the folding rates for the following two sequences: ggacUUCGgucc (with tetraloop stabilization) and ggacUUUUgucc (without tetraloop stabilization). To extract the ΔSloop and ΔHloop for the experiment, we subtract the stem parameters from the experimentally measured hairpin parameters (4). Here the stem parameters are calculated from the Turner rule (19) with the salt corrections (with experimental condition of 10 mM Na+) (25).
For the UUCG tetraloop, we found that ΔSexcess = 25 eu and ΔHexcess = 12 kcal/mol. Proctor et al. (4) measured that  = 6.1 × 10⁴ s−1 at T = 65°C. Our theory (with Eq. 11) gives
  = 8.91 × 10⁴ s−1, which is close to the experimental result. The unfolding rate can be estimated from the hairpin stability ΔG(exp) = – 0.79 kcal/mol as
  which gives
  = 1.6 × 10⁴ s−1 and ku(model) = 2.3 × 10⁴ s−1, respectively.
For the UUUU loop, there is no unusual tetraloop stabilization interaction. By assuming ΔHexcess and ΔSexcess to be zero in the above equations (i.e., ΔHloop = 0 and ΔSloop =  ), we found that
  at T = 65°C, which is close to the experimental result
  The experimental and theoretical unfolding rates are
  and
and  respectively.
Consistent with the experimental finding, the theory predicts the acceleration in the folding process and the deceleration in the unfolding process due to the tetraloop stabilization. Physically, folding is accelerated because the excess intraloop stacking and basepairing can stabilize the transition state for the folding (see ‡ in Fig. 10 a) to lower the free energy barrier of folding. The unfolding is decelerated because the intraloop stacking and basepairing in the folded state can cause a higher (enthalpic) barrier for the disruption of the tetraloop.
Acknowledgments
We are grateful to Drs. Anjum Ansari and Herve Isambert for useful discussions.
This research was supported by the National Institutes of Health (NIH/NIGMS) through grant GM No. 063732 (to S.-J. C).
References
- 1.Hall, K. B., and J. Williams. 2004. Dynamics of the IRE RNA hairpin loop probed by 2-aminopurine fluorescence and stochastic dynamics simulations. RNA. 10:34–47. [DOI] [PMC free article] [PubMed] [Google Scholar]
- 2.Jean, J. M., and K. B. Hall. 2001. 2-Aminopurine fluorescence quenching and lifetimes: role of base stacking. Proc. Natl. Acad. Sci. USA. 98:37–41. [DOI] [PMC free article] [PubMed] [Google Scholar]
- 3.Hall, K. B., and C. G. Tang. 1998. C-13 relaxation and dynamics of the purine bases in the iron responsive element RNA hairpin. Biochemistry. 37:9323–9332. [DOI] [PubMed] [Google Scholar]
- 4.Proctor, D. J., H. Ma, E. Kierzek, R. Kierzek, M. Gruebele, and P. C. Bevilacqua. 2004. Folding thermodynamics and kinetics of YNMG RNA Hairpins: specific incorporation of 8-bromoguanosine leads to stabilization by enhancement of the folding rate. Biochemistry. 43:14004–14014. [DOI] [PubMed] [Google Scholar]
- 5.Liphardt, J., B. Onoa, S. B. Smith, I. J. Tinoco, and C. Bustamante. 2001. Reversible unfolding of single RNA molecules by mechanical force. Science. 292:733–737. [DOI] [PubMed] [Google Scholar]
- 6.Zhang, W. B., and S. J. Chen. 2002. RNA hairpin folding kinetics. Proc. Natl. Acad. Sci. USA. 99:1931–1936. [DOI] [PMC free article] [PubMed] [Google Scholar]
- 7.Zhang, W. B., and S. J. Chen. 2003. Master equation approach to finding the rate-limiting steps in biopolymer folding. J. Chem. Phys. 118:3413–3420. [DOI] [PMC free article] [PubMed] [Google Scholar]
- 8.Sorin, E. J., M. A. Engelhardt, D. Herschlag, and V. S. Pande. 2002. RNA simulations: probing hairpin unfolding and the dynamics of a GNRA tetraloop. J. Mol. Biol. 317:493–506. [DOI] [PubMed] [Google Scholar]
- 9.Sorin, E. J., Y. M. Rhee, B. J. Nakatani, and V. S. Pande. 2003. Insights into nucleic acid conformational dynamics from massively parallel stochastic simulations. Biophys. J. 85:790–803. [DOI] [PMC free article] [PubMed] [Google Scholar]
- 10.Sorin, E. J., B. J. Nakatani, Y. M. Rhee, G. Jayachandran, V. Vishal, and V. S. Pande. 2004. Does native state topology determine the RNA folding mechanism? J. Mol. Biol. 337:789–797. [DOI] [PubMed] [Google Scholar]
- 11.Cocco, S., J. F. Marko, and R. Monasson. 2003. Slow nucleic acid unzipping kinetics from sequence-defined barriers. Eur. Phys. J. E. 10:153–161. [DOI] [PubMed] [Google Scholar]
- 12.Bonnet, G., O. Krichevsky, and A. Libchaber. 1998. Kinetics of conformational fluctuations in DNA hairpin-loops. Proc. Natl. Acad. Sci. USA. 95:8602–8606. [DOI] [PMC free article] [PubMed] [Google Scholar]
- 13.Ansari, A., S. V. Kunznetsov, and Y. Shen. 2001. Configurational diffusion down a folding funnel describes the dynamics of DNA hairpins. Proc. Natl. Acad. Sci. USA. 98:7771–7776. [DOI] [PMC free article] [PubMed] [Google Scholar]
- 14.Kuznetsov, S. V., Y. Shen, A. S. Benight, and A. Ansari. 2001. A semiflexible polymer model applied to loop formation in DNA hairpins. Biophys. J. 81:2864–2875. [DOI] [PMC free article] [PubMed] [Google Scholar]
- 15.Wallace, M. I., L. Ying, S. Balasubramanian, and D. Klenerman. 2001. Non-Arrhenius kinetics for the loop closure of a DNA hairpin. Proc. Natl. Acad. Sci. USA. 98:5584–5589. [DOI] [PMC free article] [PubMed] [Google Scholar]
- 16.Wallace, M. I., L. Ying, S. Balasubramanian, and D. Klenerman. 2000. FRET fluctuation spectroscopy: exploring the conformational dynamics of DNA hairpin loop. J. Phys. Chem. B. 104:11551–11555. [Google Scholar]
- 17.Goddard, N. L., G. Bonnet, O. Krichevsky, and A. Libchaber. 2000. Sequence-dependent rigidity of single-stranded DNA. Phys. Rev. Lett. 85:2400–2403. [DOI] [PubMed] [Google Scholar]
- 18.Shen, Y., S. V. Kunznetsov, and A. Ansari. 2001. Loop dependence of the dynamics of DNA hairpins. J. Phys. Chem. B. 105:12202–12211. [Google Scholar]
- 19.Serra, M. J., and D. H. Turner. 1995. Predicting thermodynamic properties of RNA. Methods Enzymol. 259:242–261. [DOI] [PubMed] [Google Scholar]
- 20.Chen, S. J., and K. A. Dill. 2000. RNA folding energy landscapes. Proc. Natl. Acad. Sci. USA. 97:646–651. [DOI] [PMC free article] [PubMed] [Google Scholar]
- 21.Hilbers, C. W., C. A. Haasnoot, S. H. de Bruin, J. J. Joordens, G. A. van der Marel, and J. H. van Boom. 1985. Hairpin formation in synthetic oligonucleotide. Biochimie. 67:685–695. [DOI] [PubMed] [Google Scholar]
- 22.Haasnoot, C. A., C. W. Hilbers, G. A. van der Marel, J. H. van Boom, U. C. Singh, N. Pattabiraman, and P. A. Kollman. 1986. On loop folding in nucleic acid hairpin-type structures. J. Biomol. Struct. Dyn. 3:843–857. [DOI] [PubMed] [Google Scholar]
- 23.Groebe, D. R., and O. C. Uhlenbeck. 1988. Characterization of RNA hairpin loop stability. Nucleic Acids Res. 16:11725–11735. [DOI] [PMC free article] [PubMed] [Google Scholar]
- 24.Zhang, W. B., and S. J. Chen. 2003. Analyzing the biopolymer folding rates and pathways using kinetic cluster method. J. Chem. Phys. 119:8716–8729. [DOI] [PMC free article] [PubMed] [Google Scholar]
- 25.SantaLucia, J. J. 1998. A unified view of polymer, dumbbell, and oligonucleotide DNA nearest-neighbor thermodynamics. Proc. Natl. Acad. Sci. USA. 95:1460–1465. [DOI] [PMC free article] [PubMed] [Google Scholar]
- 26.Porschke, D., O. C. Uhlenbeck, and F. H. Martin. 1973. Thermodynamics and kinetics of the helix-coil transitions of oligomers containing GC pairs. Biopolymers. 12:1313–1335. [Google Scholar]
- 27.Varani, G. 1995. Exceptionally stable nucleic acid hairpins. Annu. Rev. Biophys. Biomol. Struct. 24:379–404. [DOI] [PubMed] [Google Scholar]
- 28.Pley, H. W., K. M. Flaherty, and D. B. McKay. 1994. Three-dimensional structure of a hammerhead ribozyme. Nature. 372:68–74. [DOI] [PubMed] [Google Scholar]
- 29.Correll, C. C., and K. Swinger. 2003. Common and distinctive features of GNRA tetraloops based on a GUAA tetraloop structure at 1.4 resolution. RNA. 9:355–363. [DOI] [PMC free article] [PubMed] [Google Scholar]
- 30.Jager, J. A., D. H. Turner, and M. Zuker. 1989. Improved predictions of secondary structures for RNA. Proc. Natl. Acad. Sci. USA. 86:7706–7710. [DOI] [PMC free article] [PubMed] [Google Scholar]


