Abstract
Effects of the number of actin-bound S1 and of axial tension on x-ray patterns from tetanized, intact skeletal muscle fibers were investigated. The muscle relaxant, BDM, reduced tetanic M3 meridional x-ray reflection intensity (IM3), M3 spacing (dM3), and the equatorial I11/I10 ratio in a manner consistent with a reduction in the fraction of S1 bound to actin rather than by generation of low-force S1-actin isomers. At complete force suppression, IM3 was 78% of its relaxed value. BDM distorted dynamic IM3 responses to sinusoidal length oscillations in a manner consistent with an increased cross-bridge contribution to total sarcomere compliance, rather than a changed S1 lever orientation in BDM. When the number of actin-bound S1 was varied by altering myofilament overlap, tetanic IM3 at low overlap was similar to that in high [BDM] (79% of relaxed IM3). Tetanic dM3 dependence on active tension in overlap experiments differed from that observed with BDM. At high BDM, tetanic dM3 approached its relaxed value (14.34 nm), whereas tetanic dM3 at low overlap was 14.50 nm, close to its value at full overlap (14.56 nm). This difference in tetanic dM3 behavior was explicable by a nonlinear thick filament compliance which is extended by both active and passive tension.
INTRODUCTION
In actomyosin contractile systems, mechanical work is generated by cyclic attachment and detachment of the molecular motor, myosin, to actin filaments, accompanied by ATP hydrolysis (1,2). In the actin-bound state, the lever arm of the subfragment 1 (S1) myosin moiety is thought to tilt (the power stroke), generating 2–4 pN of force (3–6). The lifetime of the actomyosin complex, as measured in optical trap motility assays, is a small fraction of the ATPase cycle time (6). This view is supported by fluorescence polarization studies, where fluorescent probes on the S1 lever arm during a release-induced, synchronized power stroke report ∼12% of available S1 being actin-bound (7,8). The presence of a large, detached S1 population is a serious complication in interpretation of structural data from intact motile systems.
The highly organized ultrastructure of skeletal muscle gives rise to a characteristic x-ray diffraction pattern (1,9–11), and time-resolved x-ray diffraction has become an important, noninvasive tool in the investigation of contraction in vivo. S1 interaction with actin affects both the intensity of the M3 meridional x-ray reflection (IM3; (12,13)) and also its spacing (dM3, which corresponds to the axial period of S1 projections from the myosin filaments), which increases by ∼1.5% upon activation (11). Both IM3 and dM3 are proposed to be sensitive to the degree of S1 binding to actin.
Muscle length changes imposed in the relaxed state have no effect on IM3, but during tetani they cause large IM3 responses, strong evidence that IM3 is sensitive to the strain imposed on actin-bound S1. The effects of the free S1 population on tetanic IM3 and dM3 can be examined by varying the fraction of S1 bound to actin. Increasing muscle fiber length reduces filament overlap and hence lowers S1 binding to actin (14), but it also changes the diffracting mass of muscle in the x-ray beam and may introduce additional disordering of the axial unit cell. In addition, at long sarcomere lengths, sarcomere inhomogeneity develops upon activation, leading to tension creep and a breakdown of the direct relationship between the S1 binding to actin and force. Here we use BDM to vary the fraction of actin-bound S1 in intact muscle fibers while maintaining full filament overlap, and we distinguish effects on IM3 and dM3 due to S1 binding to actin, and the effects of the accompanying variation of axial force.
METHODS
Preparation
Bundles of 5–10 intact muscle fibers from the tibialis anterior muscles of Rana temporaria were mounted horizontally in a temperature-controlled chamber. Kapton x-ray windows (12-μm thickness) were placed within 200 μm of either side of the bundle to minimize the x-ray path through water. A diode laser beam was used to obtain real-time sarcomere length measurements by laser diffraction. Opposite ends of the preparation were attached to a capacitance force transducer (0.8 mV mg−1, 40–50 kHz resonance frequency) and a fast moving coil motor to permit force measurements and control of bundle length. Sarcomere length was adjusted to 2.2 μm in the relaxed state, and monitored throughout the experiments. The bundle was stimulated to contract by a pulsed electric field, which produced fused tetani of 400-ms duration. Temperature was maintained at 7°C.
X-ray measurements
Measurements were conducted at the SAXS beamline of Elettra (Trieste, Italy) and the A2 beamline of DORIS (Hamburg, Germany) using synchrotron radiation (λ 0.15 nm, width 3 mm, height 0.5 mm). Exposure to radiation was controlled by a fast shutter system so as to limit x-ray exposure to periods of data collection. X-ray patterns were recorded on a two-dimensional CCD x-ray detector (XDI, Photonic Science, Oxford, UK (Elettra) and marCCD 165, Marresearch, Norderstedt, Germany (DORIS)). Patterns were processed to subtract dark current, divided by the counting efficiency, and corrected for spatial distortion. For measurement of meridional intensities, the two-dimensional pattern was projected onto the meridional axis between limits of ±1/63.0 nm−1 for the radial reciprocal space coordinate; for the equatorial pattern, the projection limits were ±1/110.0 nm−1 along the axial reciprocal space axis. The width of M3 was measured by projection of the reflection between 1/13.55 nm−1 and 1/15.70 nm−1 along the meridian onto the equator.
Correction of reflection intensities
One-dimensional patterns obtained by projection were fitted to a polynomial expression for background intensity, with superimposed Gaussian functions representing reflections (15,16) using an algorithm of the Levenberg-Marquardt method (17). Integrated intensities (I10, I11, and IM3), reflection width, and spacing were obtained from the best fit to the one-dimensional pattern. Before fitting, the one-dimensional spectra were corrected for beam intensity, bundle movement, activation-induced disordering and, in the case of sarcomere length experiments, changes in preparation mass exposed to the beam. Since virtually all the radiation in the spectrum arises from preparation scattering, the correction for movement, sarcomere length, and fluctuations in x-ray intensity can be performed by normalizing the total number of counts in the pattern for all spectra to the counts in an initial, relaxed spectrum at a sarcomere length of 2.2 μm. Activation caused considerable broadening of M3 along its radial coordinate (18) without a corresponding change in the width of the equatorial pattern. Such an effect occurs when the individual filaments in a parallel array are axial-displaced from alignment with their neighbors (19). This misalignment causes IM3 to become distributed over a disk in reciprocal space orthogonal to the meridian, of which the x-ray sphere of reflection samples only a slice. Since broadening of this disk is symmetrical in all directions orthogonal to the meridian, total intensity can be estimated by multiplying the integrated IM3 by the increase in width of M3 along its radial coordinate (12).
Dynamic IM3 signals during length oscillations
A train of 250 sinusoidal length oscillations at 1 kHz was imposed per tetanus on fiber bundles, and IM3 signals (counted on a delay line, one-dimensional x-ray detector over 49 μs intervals) were summed for each oscillation period to define the shape of the IM3 signals with 20 points. A series of 10–40 such tetani were elicited for each experimental condition, and the summed IM3 signals from each tetanus averaged over the series. IM3 signals in response to imposed changes in fiber length are thought to arise from angular displacement of the S1 lever arm domain as a result of both the synchronized power stroke resulting from the change in load (active tilting) and also from passive tilting due to an elasticity in the position of the lever tip. Experimental IM3 signals were fitted to simulated IM3 changes obtained using a molecular model of S1. We calculated the displacement of the lever arm domain throughout the observed sinusoidal changes in force by assuming that 50% of the applied length change was absorbed by filament compliance, then we calculated the accompanying changes in IM3 as the squared modulus of the Fourier transform of 50 S1s with that lever displacement on either side of the M-line. The fitting procedure selected the best isometric orientation of the lever to match the experimental IM3 signal for the measured amplitude of sarcomere length changes, using an algorithm of the Levenberg-Marquardt method (17). The length change required to shift the lever from its isometric position to the point at which IM3 is maximal (Δy) was then determined. S1 structure was simulated from the α-carbon chain of chicken gizzard S1 (5), taking the lever arm domain to begin at residue 711. The orientation of the actin-bound motor domain was matched to that proposed by Rayment et al. (5). An ordered, free S1 was assumed to be associated with each actin-bound S1 to obtain the highest IM3 sensitivity to length changes (20) and in agreement with studies of the effects of x-ray scattering from opposite halves of the thick filament (21), which are best explained with the inclusion of such a free S1 component. A more detailed description of the simulation procedure is given elsewhere (16,20,22).
Protocol
The vertical and horizontal positions of the bundle in the x-ray beam were optimized using a beam attenuated by 70%, so as to minimize x-ray exposure during setting up. During the experiment, x-ray patterns were captured using an unattenuated beam and an exposure period of between 70 and 300 ms, selected to avoid detector saturation. Addition of the muscle relaxant 2,3-butanedione monoxime (BDM; Sigma, Poole, UK) in the concentration range 1–8 mM was followed by a few test contractions without x-ray exposure until steady-state tetanic tension was attained. Because of the delayed rise in tension in the presence of BDM, the period of x-ray exposure was delayed until tetanic force had plateaued. BDM effects on contraction were completely reversible. For overlap experiments, force from stretched fibers gradually increased during a tetanus (force creep). The tetanic force for a particular sarcomere length was therefore taken as the force reached by extrapolation of the tension creep back to the point of onset of stimulation (23). All values quoted in the text are given mean ± standard error.
RESULTS
Effects of a reduced fraction of force-generating S1-actin isomers during contraction on the equatorial x-ray reflections
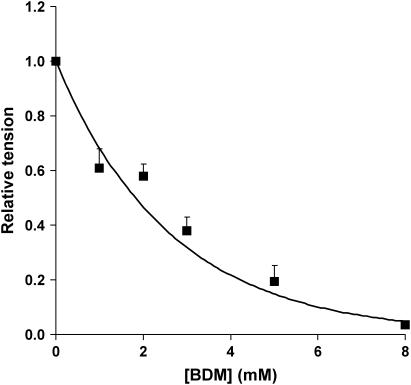
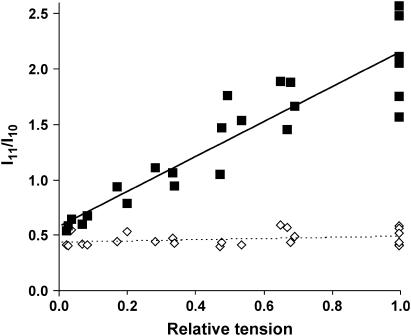
The principal in vitro biochemical effects of BDM on the myosin II ATPase are slowing of inorganic phosphate release and an increased equilibrium constant for the phosphate cleavage step (24). These promote accumulation of the weakly-binding S1.ADP.Pi state of myosin, a pre-power stroke S1 isomer. We first examined how accumulation of this state in BDM influenced the equatorial x-ray pattern, which depends on the radial mass distribution within the myofilament lattice and is sensitive to the fraction of S1 bound to actin. In the concentration range 0–8 mM, BDM suppressed the amplitude of tetanic tension from Po (isometric tetanic tension at full overlap in unmodified Ringer's solution) to 0.036 ± 0.013 Po at the highest BDM concentration used and also reduced its rate of rise. The effect of various concentrations of BDM on tetanic tension (PBDM) is shown in Fig. 1. Fig. 2 shows the dependency of the intensity ratio (I11/I10) of the two strongest equatorial reflections on PBDM. Tetanic I11/I10 declined linearly with decreasing PBDM, whereas the relaxed ratio (plotted at the corresponding PBDM obtained upon activation) showed no sensitivity to BDM. The extrapolation of the dependence of tetanic I11/I10 upon force to zero tension in Fig. 2 coincides with the relaxed ratio. These observations strongly suggest that the principal in vivo action of BDM is to increase the fraction of free S1 during tetani rather than to promote occupancy of a strongly binding but low-force S1-actin state. This result supports recent findings showing that BDM alters the number of attached cross-bridges without changing their properties (25). In this concentration range, BDM can therefore be used to vary the fraction of actin-bound S1 in intact cells analogously to the use of [Ca2+] to vary S1 binding to actin in skinned muscle fibers.
FIGURE 1.
Dependence of isometric tetanic tension on BDM concentration for 10 fiber bundles used in these experiments. Tension has been normalized to the amplitude of a control tetanus in unmodified Ringer's solution at 2.2-μm sarcomere length.
FIGURE 2.
Dependence of the equatorial intensity ratio of the 10 and 11 reflections from tetanic isometric tension at sarcomere length 2.2 μm. Tetanic tension was varied by adjusting [BDM] in the range 1–8 mM and plotted on the abscissa normalized to tetanic tension in unmodified Ringer's solution (PBDM/Po). Ratios are plotted for both tetanized (▪) and for the relaxed (◊) states. The lines are best fits of a linear regression of I11/I10 upon PBDM.
Effects on IM3 of a reduced fraction of force-generating S1-actin isomers during contraction
We next examined the effects of reduced binding of S1 to actin on tetanic IM3 using BDM. After application of the intensity corrections outlined under Methods, the mean tetanic IM3 in Ringer's solution increased by 1.71 ± 0.02-fold with respect to its relaxed value.
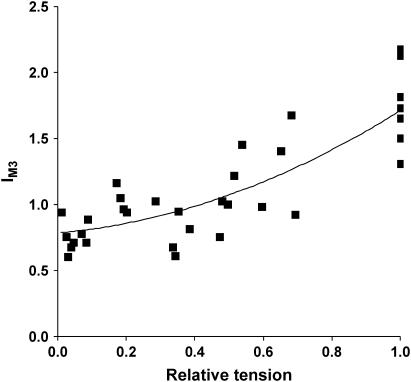
To estimate IM3 at zero tetanic force, we fitted the regression of IM3 upon PBDM/Po to a quadratic relationship and evaluated the intercept at zero tetanic tension. The best fit to this regression of IM3 upon PBDM/Po (Fig. 3) gave a relative IM3 of 0.78 ± 0.01 (±95% confidence interval) at zero tetanic tension, whereas the mean tetanic IM3 at 8 mM [BDM], the highest concentration used, was 0.76 ± 0.04 of relaxed IM3, indicating that tetanic IM3 at high [BDM] became smaller than relaxed IM3, possibly due to a sensitivity of detached S1 structure to activation. Relaxed IM3 were identical in the presence or absence of BDM, showing that IM3 is insensitive to any increased occupancy of the S1.ADP.Pi state induced by BDM (24,26) in the concentration range we examined.
FIGURE 3.
Dependence of tetanic IM3 on relative tetanic tension at 2.2-μm sarcomere length. Tetanic tension was varied by changing [BDM]. IM3 was normalized to the intensity of the relaxed pattern, which showed no sensitivity to BDM. The line is a best fit of a quadratic regression of IM3 upon PBDM.
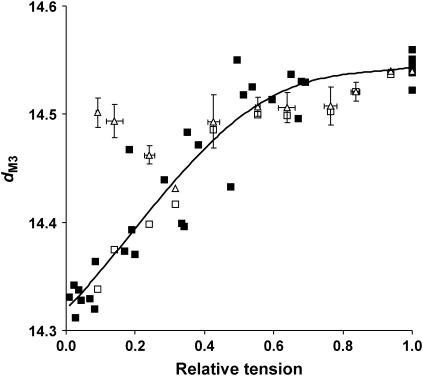
It is known that activation increases dM3 by ∼1.5% at full overlap and full activation (11,27). We examined the change in dM3 at different levels of tetanic tension, varied by adjusting [BDM]. The dM3 dependence on force was a curved relationship (Fig. 4, solid squares), falling from 14.54 ± 0.01 nm in unmodified Ringer's solution to 14.34 ± 0.01 nm at 8 mM BDM (corresponding to the relaxed spacing), the largest changes in dM3 occurring in the low-force range. Activated M3 width, measured perpendicularly to the meridian axis, increased with isometric tension in a similar manner to dM3.
FIGURE 4.
(Solid squares) M3 spacing (dM3) in BDM plotted against active tension (PBDM/Po); (open triangles) dM3 plotted against active tension at different sarcomere lengths (Poverlap/Po). For overlap data, both dM3 and Poverlap/Po have been class-averaged to reduce scatter. Error bars are the standard errors for each class. The dependence of dM3 on PBDM/Po was fitted to a fourth-order polynomial (y = 0.5445x4 − 1.1758x3 + 0.5527x2 + 0.3019x + 14.32), which is plotted as the continuous line. (Open squares) The dM3 dependence on Poverlap/Po at different sarcomere lengths corrected for passive tension by subtraction of the passive component of the total change in dM3.
The fraction of actin-bound S1 affects dynamic changes in IM3 accompanying sinusoidal oscillations
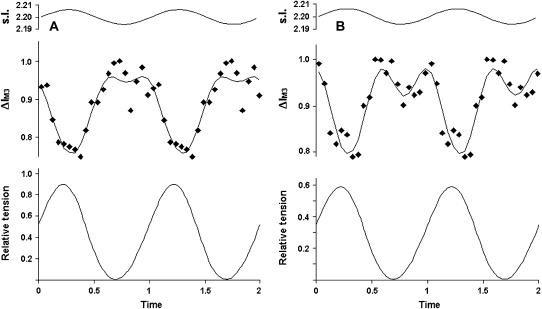
It has been shown previously that 1-kHz sinusoidal length oscillations applied to tetanized muscle fibers produce a quasi-sinusoidal IM3 signal (16,20). This signal was in phase opposition to force oscillations, and was distorted about the point of maximum shortening if the oscillation amplitude was sufficiently large (16,20). The distortion took the form of a secondary minimum in the IM3 signal between two peaks of maximum intensity (IM3 max). Conditions that increase the force per cross-bridge also increase the depth of this secondary minimum (22), and the total fiber shortening required to reach IM3 max; so, conversely, if BDM reduced the force per bridge, the depth of the secondary minimum should decrease and the total fiber shortening required to reach IM3 max should increase. We tested this hypothesis using 2–3 mM BDM, concentrations that reduced force by ∼50% but still gave measurable IM3 signals. Contrary to the predicted decrease in the depth of the secondary minimum, we obtained instead a more pronounced secondary minimum, and a reduction in the amount of total fiber shortening required to reach IM3 max (Fig. 5).
FIGURE 5.
IM3 changes during 1-kHz sinusoidal fiber length oscillations in unmodified Ringer's solution (A) and in BDM (2 mM) Ringer (B). Upper traces, sarcomere length; middle traces, IM3 intensity (♦, expressed relatively to IM3 max); lower traces, forces (relative to control tetanic tension). Tetanic tension in presence of 2 mM BDM (B) was reduced to 0.65 Po. IM3 is shown over two periods of oscillation to display its waveform more clearly. The continuous lines through the IM3 data points show the best fit of a simulation of the IM3 signal obtained from the molecular structure of S1. The depth of the secondary minimum close to the point of minimum tension is increased in the presence of BDM, as is the separation between the double peaks in intensity that surround it.
Effects on IM3 of reduced filament overlap
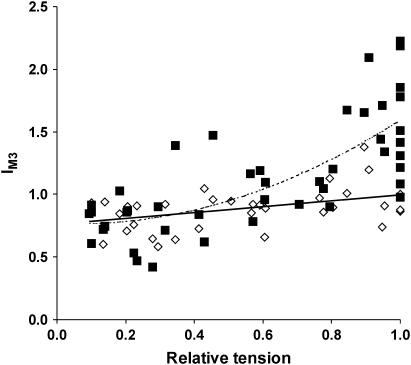
We examined whether changing the number of S1 bound to actin by varying filament overlap mirrored the effects of variation in [BDM] on IM3 and dM3, so as to distinguish between BDM-specific changes in these parameters and changes resulting from a alterations in the number of actin-bound S1. At long sarcomere lengths, IM3 broadened along the radial axis in both the relaxed and activated states by up to 3–4-fold. Tetanic IM3 (normalized to relaxed IM3 at full overlap) fell from 1.69 ± 0.15 at full overlap to less than unity at the longest sarcomere lengths. Tetanic IM3 dependence on force at various degrees of filament overlap (Poverlap) was fitted to a quadratic regression (Fig. 6), and the extrapolated IM3 at zero Poverlap relative to the initial, relaxed IM3 was 0.79 ± 0.01 (±95% confidence interval). Fig. 6 also shows a roughly linear fall in the corresponding values of relaxed IM3 (plotted at the corresponding Poverlap obtained upon activation).
FIGURE 6.
Relative IM3 (as a fraction of relaxed IM3 at full overlap) against relative tetanic tension obtained upon activation at different sarcomere lengths for activated (▪) and relaxed (◊) fiber bundles. Tension has been normalized to an initial control contraction at full overlap (Poverlap/Po). The dashed line is a fitted quadratic regression of tetanic IM3 upon Poverlap; the continuous line is a fitted linear regression of relaxed IM3 upon the Poverlap obtained upon activation.
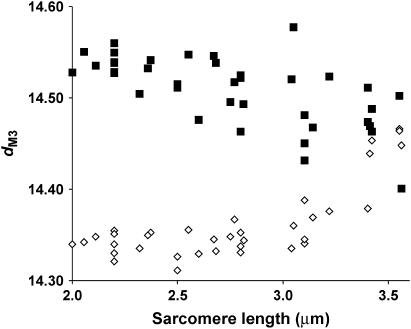
Tetanic dM3 is plotted against sarcomere length in Fig. 7 (solid squares). Unlike the BDM data (Fig. 4), where dM3 fell in a nonlinear manner toward 14.34 nm as the fraction of cycling cross-bridges decreased, when cross-bridges attachment was reduced by decreasing filament overlap (i.e., at longer sarcomere lengths), dM3 declined less. The mean spacing at full overlap was 14.56 ± 0.01 nm. A linear regression of tetanic dM3 upon sarcomere length gave dM3 as 14.47 nm at 3.6 μm.
FIGURE 7.
M3 spacing (dM3) plotted as a function of sarcomere length in the relaxed state (◊) and at isometric tetanic tension (▪).
dM3 increases with passive tension
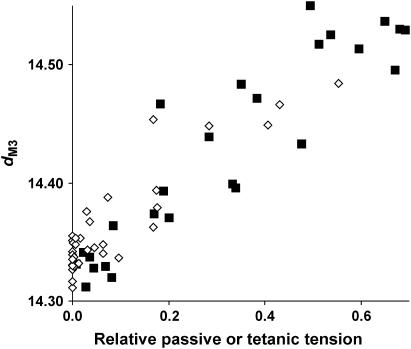
The difference between dM3 values at low active tension (i.e., low fractional attachment of S1 to actin) in BDM and at long sarcomere lengths might be caused by the effects of passive tension present in the sarcomere length experiments, so we examined the relation between relaxed dM3 and sarcomere length (Fig. 7; open diamonds). Spacing increases at longer sarcomere lengths, corresponding to sarcomere lengths at which fiber passive tension becomes appreciable. This suggests an explanation for the behavior of tetanic dM3 in our overlap experiments; as sarcomere length increases and tetanic tension falls, passive tension rises, causing relaxed dM3 to increase. This passive tension increase compensates for the fall in tetanic tension, causing tetanic dM3 to decline much less than in BDM at the same active tension. If the change in tetanic dM3 with PBDM were also an elastic rather than an activation-related change in thick filament structure, its dependence on tetanic tension should closely resemble the dependence of relaxed dM3 on passive tension in these overlap experiments. This comparison is shown in Fig. 8. The dM3 is plotted at various PBDM, whereas values of relaxed dM3 at different degrees of myofilament overlap are plotted as a function of passive tension. It can be seen that the two plots display the predicted similarity. To see whether the behavior of tetanic dM3 in our overlap experiments could also be explained by thick filament compliance, we corrected the total spacing change for the component caused by passive tension. Fig. 4 shows the uncorrected tetanic dM3 at different sarcomere lengths plotted against active tension development (Poverlap/Po; open triangles). At forces greater than 0.4 Po, the dM3 values from both BDM and overlap experiments coincide, but below 0.4 Po, these points clearly differ, even though the same number of cycling bridges are active for the same active tensions. Below 0.4 Po, thick filament compliance is approximately linear, so tetanic dM3 can be corrected for the spacing change due to passive tension simply by subtraction of the passive spacing change from the total tetanic dM3. The results of this correction are plotted as open squares in Fig. 4, and it can be seen that they lie on the same curve as the dependence of dM3 on PBDM/Po. This indicates that the dM3 changes in our overlap experiments can also be accounted for by the total force acting on a nonlinear thick filament compliance, but are poorly accounted for by a filament backbone structural change dependent on the number of cycling cross-bridges.
FIGURE 8.
Comparison of relaxed dM3 plotted against passive tension (⋄, expressed relative to tetanic tension at full overlap) at different sarcomere lengths and tetanic dM3 in the presence of BDM (▪) plotted at the corresponding active tension (expressed relative to tetanic tension in unmodified Ringer). Note that the two relations are superimposable. Note also that the data cover a force-range only up to 0.6 Po (where the slope of the plots is approximately constant), because this was the highest level of passive tension reached in the range of sarcomere lengths examined. Extension beyond this range of sarcomere lengths resulted in irreversible deterioration of the x-ray pattern.
Effects of variation of filament overlap on other reflections
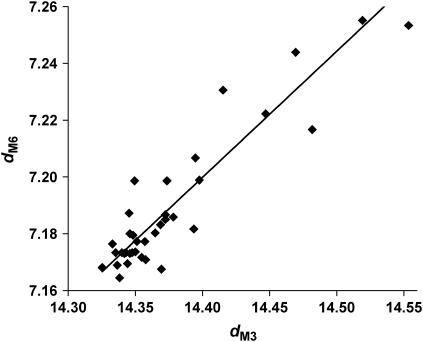
M3 is thought to arise mainly from x-ray scattering by S1 because of the high sensitivity of tetanic IM3 to changes in fiber length. Changes in M3 therefore principally indicate alterations in the axial period and structure of S1. On the other hand, M6 (which has a spacing dM6 = dM3/2) is insensitive to such length changes, and is thought to arise mainly from scattering by the thick filament backbone. As a result, it should be much less sensitive both to changes in S1 structure and to variation in interference effects between opposite halves of the thick filament that these changes in S1 structure induce in M3, and should instead indicate real changes in thick filament length. We measured dM6 while varying passive tension in the same range as that shown for dM3 in Fig. 7, and found that dM6 dependence on passive tension closely resembles that of dM3 (Fig. 9), indicating that dM3 changes with passive tension do represent alterations in thick filament length and not a cross-bridge-related effect.
FIGURE 9.
The value dM6 (nm) versus dM3 in relaxed bundles at varying sarcomere lengths for passive tension in the range 0–0.55 Po.
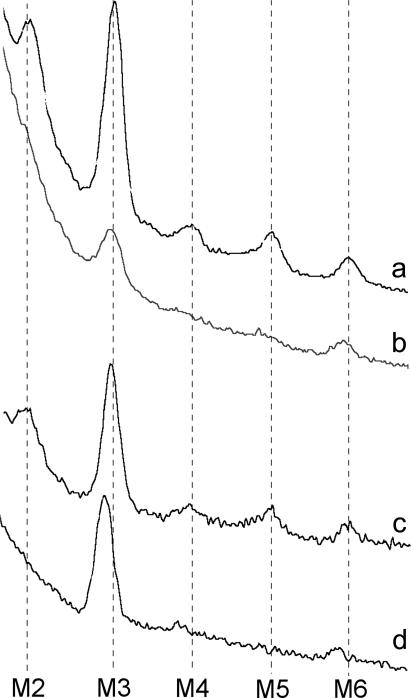
The M2, M4, and M5 reflections, which are prominent in the relaxed x-ray pattern, should be absent for a perfect helical arrangement of S1 about the thick filament backbone (28). During tetani, these forbidden reflections weaken considerably. When passive tension was increased by stretching, the forbidden reflections also weakened without a corresponding reduction in IM6 (Fig. 10). Their disappearance indicates an increased degree of order in the axial period of the S1 crowns along the thick filament, whereas the accompanying reflection broadening perpendicular to the meridian shows a disordering of axial alignment of S1 crowns on neighboring thick filaments (19,28). Disappearance of the forbidden reflections during tetani may therefore be explicable as an increased ordering of the S1 period by axial force development, perhaps by the extension of thick filament compliance, rather than as a direct effect of activation or as a change in S1 structure.
FIGURE 10.
Meridional spectra of (a) a relaxed bundle at 2.2 μm sarcomere length; (b) the same relaxed bundle after stretch to 3.4 μm, bearing 0.22 Po passive tension; (c) relaxed bundle at sarcomere length 2.2 μm; and (d) the same bundle at the plateau of an isometric tetanus. Exposure duration 10 s. The marked reduction of M3 in b, relative to the unstretched state in a, is due to the large degree of reflection broadening observed at long sarcomere lengths (2.8-fold) compared to that in activation at full overlap (1.7-fold), the absence of the increase in IM3 of ∼1.7-fold upon activation that strengthens the reflection in d, and the reduction of scattering mass in the beam due to the stretch.
DISCUSSION
The fraction of S1 bound to actin during isometric tetani (S1bound) is a crucial, but disputed, parameter in modeling contraction. Stiffness measurements suggest fractional binding of S1 to be 43% (29), but fluorescence polarization studies indicate only 10% attachment of labeled bridges during isometric contraction (8), and motility studies at physiological [ATP] show an attached state lifetime of only a few percent of the actomyosin ATPase turnover time (6). Uncertainty about the number of actin-bound S1 means that probes sensitive to structural changes in S1 during the power stroke might also carry signals from an unknown population of free S1, which would complicate quantitative evaluation of these data.
We varied S1bound using BDM, a specific inhibitor of the myosin II ATPase. At concentrations below 8 mM in frog muscle, BDM affects neither calcium binding to troponin (30), nor does it modify calcium release from the sarcoplasmic reticulum (31,32). In vitro studies show that stabilization of the S1.ADP.Pi state is its principal effect (24,26). In vivo, the action of BDM is disputed. BDM has been reported to increase the stiffness-to-tension ratio (33,34) of activated fibers, consistent with accumulation of low-force cross-bridges rather than with a change in actin-bound S1. But Bagni et al. (25) showed that the mechanical characteristics of fibers in BDM were best accounted for by a fall in the fraction of S1 bound to actin rather than formation of a low-force cross-bridge state. Variation of tension by [Ca2+] alters the fraction of S1 bound to actin and affects both I10 and I11, yielding a roughly linear relation between force and I11/I10 (35,36). Previous x-ray studies found that BDM caused a departure from this linear relation, increasing I11/I10 at submaximal isometric tensions in both intact (30) and skinned (37) fibers. Such an effect is also seen on formation of low-force, weakly binding cross-bridges at low ionic strength (38). However, in both of these previous studies only the effect of a single BDM concentration was examined, in one case outside the range of concentrations used here (37). The departure from a linear dependence of I11/I10 on force was then inferred from comparison with control I11/I10 at similar levels of tension development obtained either from other fibers (37) or from other studies (30). Here we show that the relation between I11/I10 and PBDM in intact cells is linear throughout (Fig. 2), indicating that BDM (in the range 1–8 mM) primarily acts, like [Ca2+], to reduce fractional S1 binding to actin rather than to promote low-force attached cross-bridge states. Furthermore, since tetanic I11/I10 at complete force suppression and relaxed I11/I10 were identical, the radial mass projection of detached bridges in both the relaxed state and in 8 mM BDM are indistinguishable at the resolution of the 10 and 11 equatorial reflections. Likewise, BDM had no discernable effect on relaxed IM3 or dM3. The rise in the stiffness/tension ratio in 1–8 mM BDM is then explicable as the effect of significant myofilament compliance (39,40) rather than as the formation of low-force S1-actin isomers, in agreement with recent mechanical findings (25). We conclude that BDM in this concentration range provides a method to vary S1 binding to actin in activated, intact muscle cells in a similar fashion to the use of [Ca2+] in skinned fibers.
Although we cannot determine S1bound from fitting tetanic IM3 to relative tetanic tension, we can estimate the maximum possible contribution of free S1 to IM3. Extrapolation of the tetanic IM3 regression upon PBDM to zero tension (Fig. 3) gave a relative IM3 of 0.78 compared to the initial, relaxed IM3 in Ringer's solution, whereas tetanic IM3 at Po was 1.71 of relaxed IM3. If detached S1s present during control tetani scatter x-rays with the same power as in those at high [BDM], it is unlikely that they could contribute more than 0.78/1.71 = 46% of tetanic IM3 in the absence of BDM (assuming S1bound is very small and constructive interference between free and bound S1s), and proportionally less if S1bound were greater.
Tetanic IM3 signals are quasi-sinusoidal during 1-kHz length oscillations. A secondary IM3 minimum is present at the point of maximum shortening (16), whose depth increases when the force per cross-bridge is raised by temperature elevation (22). This effect is accompanied by a decrease in the release amplitude needed to reach IM3 max, attributable to an increased power-stroke tilting of the myosin lever arm, which reduces the displacement of the lever from its position at IM3 max (Δy). In principal, the elevated stiffness/tension ratio in BDM (33,34) could be accounted for by a reduced force per cross-bridge, since stiffness is a measure of cross-bridge formation, so a shift in the lever arm away from IM3 max (i.e., an increase in Δy) and a decrease in secondary minimum depth might be expected. But BDM increased the secondary minimum depth, as shown in Fig. 5. This apparent paradox is explicable by the effect of BDM on fractional binding of S1 to actin; the reduced number of attached cross-bridges increases the cross-bridge contribution to total sarcomere compliance, and so a greater fraction of any sarcomere length change applied externally is taken up by cross-bridge elasticity, reducing the fraction absorbed by filament compliance. This would produce a greater S1 lever displacement and increase the IM3 signal distortion. To test this, we simulated the effects of lever arm movement during oscillations on IM3 using the molecular structure of S1 (20), adjusting cross-bridge compliance in inverse proportion to the tetanic tension in BDM (i.e., maintaining a constant S1 stiffness/tension ratio), to estimate Δy. As a result, when tension falls with increasing [BDM], a larger fraction of the imposed length change is taken up by elastic displacement of the S1 lever arm, and a smaller fraction by filament compliance. Our simulations showed an increase of Δy in BDM by a statistically insignificant amount (0.13 ± 0.16 nm). When the simulations were performed assuming an S1 stiffness/tension ratio increase in BDM (i.e., a reduced force per cross-bridge), simulations showed a reduction in Δy, an effect inconsistent with reduced force per cross-bridge in the tilting lever model of the power stroke. We therefore conclude that 1–8 mM BDM does not significantly affect Δy, and the pronounced secondary IM3 minimum in BDM is explicable by an increased S1 contribution to total compliance (25), causing it to absorb a greater fraction of the imposed sarcomere length change, and not by a decrease in the force per cross-bridge during contraction. This result also shows that IM3 primarily detects S1 structure. A rise in cross-bridge compliance amplifies the lever arm movement, and therefore also the components of IM3 resulting from structural changes in S1 during oscillations. At the same time, it reduces the fraction of the imposed length changes absorbed by filament compliance and therefore suppresses components from the filament backbone. Were IM3 signals to arise from compliant structures in the thick filament backbone, then their structural changes during length oscillations would be reduced, and the IM3 signals arising from those structural changes would be smaller, hence the secondary minimum in the IM3 signal would be diminished.
We also varied S1bound by reducing myofilament overlap. In this case, the extrapolated intercept of relative IM3 versus force was 0.79. Under control conditions, isometric contraction increases IM3 to ∼1.7-fold the relaxed intensity, so detached bridges' contribution to tetanic IM3 would be unlikely to exceed 0.79/1.7 = 46% (if S1bound were close to zero during activation) and proportionally less if S1bound were larger, even assuming the most favorable constructive interference between detached and attached components of the reflection, in agreement with our conclusions from our BDM experiments.
M3 undergoes considerable broadening, even in the relaxed state, at long sarcomere lengths, so a large intensity correction is required to obtain IM3. In addition, the reflection becomes much weaker, and is subject to the effects of sarcomere inhomogeneity, as evidenced by tension creep at long sarcomere lengths. This phenomenon causes tetanic force to be dictated by a population of shortened sarcomeres, whereas IM3 is composed of intensity contributions of both these sarcomeres and those of other, stretched sarcomeres, which bear the developed tension through the extension of their passive compliance and have a lower overlap and hence fewer cross-bridges. These factors could lead to errors in our determination of the relation between force and IM3 in overlap experiments. But among these potential sources of error, none apply to our experiments in BDM; reflection broadening during activation was virtually eliminated as [BDM] increased, the number of sarcomeres in the x-ray beam did not change, and sarcomere inhomogeneities did not develop, as indicated by the quality of the laser diffraction pattern during stimulation.
M3 is largely generated by S1 projections from the thick filament, and is split into two subpeaks at slightly different meridional spacings by interference across the M-line. During contraction, the position of these subpeaks' maxima and also the ratio of their intensities are dependent on this interference across the M-line, so it could be argued that activation and cross-bridge formation might change dM3 through this interference effect. But relaxed dM3 is smaller than the tetanic spacing of either of these subpeaks, so a real increase in dM3 must accompany activation. Furthermore, at long sarcomere lengths, relaxed dM3 increases to approach its tetanic value. This increase in relaxed dM3 cannot be due to activation or to cross-bridge formation effects on interference across the M-line. Instead it is most simply explained by extension of thick filament compliance by active tension or by passive tension transmitted via titin connections to the Z-line. This is confirmed by the dependence of dM6 on passive tension. M6 is thought to arise from the thick filament backbone and is insensitive to S1 structural changes, yet dM6 shows a similar dependence on passive tension to that of dM3 (Fig. 9), suggesting that dM3 indeed reports a real change in thick filament length with axial tension. If the tetanic dM3 dependence on [BDM] also indicates extension of thick filament compliance, then the difference between relaxed and tetanic dM3 in BDM would agree with the relaxed dM3 changes caused by passive tension and shown in Fig. 7. Fig. 8 shows that this is indeed the case; both active and passive tensions alter M3 spacing in the same way. The dependence of dM3 on Poverlap differs from its dependence on PBDM (Fig. 4), showing that it is neither a function of the number of attached cross-bridges nor of active force generation alone. But when dM3 in overlap experiments is corrected for the presence of passive tension, dM3 dependence on Poverlap and on PBDM are almost exactly the same. This shows that the nonlinear filament compliance observed in our BDM experiments is also present in our overlap data, but in this case is extended by both passive and active tension.
The presence of such large compliance in the thick filament (12 nm/hour per second per Po) is inconsistent with purely mechanical measurements of sarcomere stiffness (29,41,42). In addition, for slow stretches or releases, which varied force by 0.5 Po, it has been shown that dM3 changes are only equivalent to an ∼0.2% spacing increase when scaled up to isometric tension (39,40), compared to the ∼1.5% spacing increase upon activation, and are even smaller (0.1%) when spacing is measured during a fast step release (39). In addition, dM3 decreases at constant force during isotonic shortening (43), which is inconsistent with pure elastic behavior. However, we show here that thick filament stiffness is not Hookean, so scaling dM3 changes to isometric tension is not justified. The smaller compliance in response to slow stretches or releases would be explicable by the high filament stiffness at axial forces >0.5 Po. Furthermore, if thick filament compliance were damped, this would also account for the changes in dM3 during isotonic shortening (43), for the reduced spacing changes for a step release (39), and for the very much smaller total compliance in pure mechanical studies of stiffness.
Previous studies have suggested additional effects on dM3 beside those of filament compliance. At zero overlap, dM3 changes accompany the IM3 increase resulting from a rise in temperature in rabbit psoas muscle (44), from using ATP analogs (44), or from inducement of the rigor state (27), suggesting a spacing dependence on myosin isomer. In rabbit, detached S1 ordering increases when its active site is occupied by M.ADP.Pi, a state favored at higher temperature and by certain ATP analogs. The accompanying change in dM3 was explained as a consequence of different interference effects across the M-line for S1 (M.ATP state) and for the filament backbone (M.ADP.Pi state). But this temperature-induced order-disorder transition is absent in intact frog muscle (22), so is unlikely to influence the results presented here. In addition, these studies allowed up to 4 h for the decay of passive tension, so dM3 was measured in a force range at which thick filament compliance is large, and small changes in axial force could produce appreciable effects on dM3. Nevertheless, while axial force accounts well for the spacing changes we report here, we cannot exclude the possibility that other factors might also affect dM3 under other conditions.
Increasing thick filament extension by passive tension was also associated with the disappearance of the forbidden meridional reflections (Fig. 10). If thick filament compliance were associated with disordered axial periodicity along the filament backbone at low axial tension, passive tension might suppress these reflections by increasing axial order. Fig. 10 shows that these reflections are similarly suppressed during tetani, so extension of thick filament compliance by tetanic tension might account for the disappearance of the forbidden reflections upon activation.
Acknowledgments
The authors gratefully acknowledge support by the European Community Research Infrastructure Action under the FP6 “Structuring the European Research Area” program (through the Integrated Infrastructure Initiative “Integrating Activity on Synchrotron and Free Electron Laser Science”) and Università di Firenze and Ente Cassa di Risparmio di Firenze (No. 2003-1772).
References
- 1.Huxley, H. E. 1957. The double array of filaments in cross-striated muscle. J. Biophys. Biochem. Cytol. 3:631–648. [DOI] [PMC free article] [PubMed] [Google Scholar]
- 2.Huxley, A. F. 1974. Muscular contraction. J. Physiol. 243:1–43. [PMC free article] [PubMed] [Google Scholar]
- 3.Huxley, H. E., and M. Kress. 1985. Cross-bridge behaviour during muscle contraction. J. Muscle Res. Cell Motil. 6:153–161. [DOI] [PubMed] [Google Scholar]
- 4.Tokunaga, M., K. Sutoh, C. Toyoshima, and T. Wakabayashi. 1987. Localisation of the ATPase site of myosin determined by three-dimensional electron microscopy. Nature. 329:635–638. [DOI] [PubMed] [Google Scholar]
- 5.Rayment, I., H. M. Holden, M. Whittaker, C. B. Yohn, M. Lorenz, K. C. Holmes, and R. A. Milligan. 1993. Structure of the actin-myosin complex and its implications for muscle contraction. Science. 261:58–65. [DOI] [PubMed] [Google Scholar]
- 6.Molloy, J. E., J. E. Burns, J. Kendrick-Jones, R. T. Tregear, and D. C. S. White. 1995. Movement and force produced by a single myosin head. Nature. 378:209–212. [DOI] [PubMed] [Google Scholar]
- 7.Hopkins, S. C., C. Sabido-David, J. E. T. Corrie, M. Irving, and Y. E. Goldman. 1998. Fluorescence polarization transients from rhodamine isomers on the myosin regulatory light chain in skeletal muscle fibers. Biophys. J. 74:3093–3110. [DOI] [PMC free article] [PubMed] [Google Scholar]
- 8.Corrie, J. E. T., B. D. Brandmeier, R. E. Ferguson, D. R. Trentham, J. Kendrick-Jones, S. C. Hopkins, U. A. van der Heide, Y. E. Goldman, C. Sabido-David, R. E. Dale, S. Criddle, and M. Irving. 1999. Dynamic measurement of myosin light-chain-domain tilt and twist in muscle contraction. Nature. 400:425–430. [DOI] [PubMed] [Google Scholar]
- 9.Hanson, J., and H. E. Huxley. 1953. The structural basis of the cross-striations in muscle. Nature. 172:530–532. [DOI] [PubMed] [Google Scholar]
- 10.Huxley, H. E. 1953. X-ray analysis and the problem of muscle. Proc. Royal Soc. B141:59–66. [DOI] [PubMed]
- 11.Huxley, H. E., and W. Brown. 1967. The low-angle x-ray diagram of vertebrate striated muscle and its behaviour during contraction and rigor. J. Mol. Biol. 30:383–434. [DOI] [PubMed] [Google Scholar]
- 12.Huxley, H. E., R. M. Simmons, A. R. Faruqi, M. Kress, J. Bordas, and M. H. Koch. 1983. Changes in the x-ray reflections from contracting muscle during rapid mechanical transients and their structural implications. J. Mol. Biol. 169:469–506. [DOI] [PubMed] [Google Scholar]
- 13.Irving, M., V. Lombardi, G. Piazzesi, and M. Ferenczi. 1992. Myosin head movements are synchronous with the elementary force generating process in muscle. Nature. 357:156–158. [DOI] [PubMed] [Google Scholar]
- 14.Linari, M., G. Piazzesi, I. Dobbie, N. Koubassova, M. Reconditi, T. Narayanan, O. Diat, M. Irving, and V. Lombardi. 2000. Interference fine structure and sarcomere length dependence of the axial x-ray pattern from active single muscle fibers. Proc. Natl. Acad. Sci. USA. 97:7226–7231. [DOI] [PMC free article] [PubMed] [Google Scholar]
- 15.Yu, L. C., A. C. Steven, G. R. S. Naylor, R. C. Gamble, and R. J. Podolsky. 1985. Distribution of mass in relaxed frog skeletal muscle and its redistribution upon activation. Biophys. J. 47:311–321. [DOI] [PMC free article] [PubMed] [Google Scholar]
- 16.Bagni, M. A., B. Colombini, H. Amenitsch, S. Bernstorff, C. C. Ashley, G. Rapp, and P. J. Griffiths. 2001. Frequency-dependent distortion of meridional intensity changes during sinusoidal length oscillations of activated skeletal muscle. Biophys. J. 80:2809–2822. [DOI] [PMC free article] [PubMed] [Google Scholar]
- 17.Press, W. H., B. P. Flannery, S. A. Teukolsky, and W. T. Vetterling. 1990. Numerical Recipes: The Art of Scientific Computing. Cambridge University Press, Cambridge, UK.
- 18.Huxley, H. E., A. R. Faruqi, M. Kress, J. Bordas, and M. H. Koch. 1982. Time-resolved x-ray diffraction studies of the myosin layer-line reflections during muscle contraction. J. Mol. Biol. 158:637–684. [DOI] [PubMed] [Google Scholar]
- 19.Vainshtein, B. K. 1966. Diffraction of X-Rays by Chain Molecules. Elsevier, Amsterdam. 274–291.
- 20.Griffiths, P. J., M. A. Bagni, B. Colombini, H. Amenitsch, S. Bernstorff, C. C. Ashley, and G. Cecchi. 2005. Myosin lever disposition during length oscillations when power stroke tilting is reduced. Am. J. Physiol. 289:C177–C186. [DOI] [PubMed] [Google Scholar]
- 21.Piazzesi, G., M. Reconditi, M. Linari, L. Lucii, Y.-B. Sun, T. Narayanan, P. Boesecke, V. Lombardi, and M. Irving. 2002. Mechanism of force generation by myosin heads in skeletal muscle. Nature. 415:659–662. [DOI] [PubMed] [Google Scholar]
- 22.Griffiths, P. J., M. A. Bagni, B. Colombini, H. Amenitsch, S. Bernstorff, C. C. Ashley, and G. Cecchi. 2002. Changes in myosin S1 orientation and force induced by a temperature increase. Proc. Natl. Acad. Sci. USA. 99:5384–5389. [DOI] [PMC free article] [PubMed] [Google Scholar]
- 23.Gordon, A. M., A. F. Huxley, and F. J. Julian. 1966. The variation in isometric tension with sarcomere length in vertebrate muscle fibers. J. Physiol. 184:170–192. [DOI] [PMC free article] [PubMed] [Google Scholar]
- 24.Hermann, C., J. Wray, F. Travers, and T. Barman. 1992. Effects of 2,3-butanedione monoxime on myosin and myofibrillar ATPase. An example of an uncompetitive inhibitor. Biochemistry. 31:12227–12232. [DOI] [PubMed] [Google Scholar]
- 25.Bagni, M. A., G. Cecchi, and B. Colombini. 2005. Crossbridge properties investigated by fast ramp stretching of activated frog muscle fibers. J. Physiol. 565:261–268. [DOI] [PMC free article] [PubMed] [Google Scholar]
- 26.McKillop, D. F. A., N. S. Fortune, K. W. Ranatunga, and M. A. Geeves. 1994. The influence of 2,3-butanedione 2-monoxime (BDM) on the interaction between actin and myosin in solution and in skinned muscle fibers. J. Muscle Res. Cell Motil. 15:309–318. [DOI] [PubMed] [Google Scholar]
- 27.Haselgrove, J. C. 1975. X-ray evidence for conformational changes in the myosin filaments of vertebrate skeletal muscle. J. Mol. Biol. 92:113–143. [DOI] [PubMed] [Google Scholar]
- 28.Martin-Fernandez, M. L., J. Bordas, G. Diakun, J. Harries, J. Lowy, G. R. Mant, A. Svensson, and E. Towns-Andrews. 1994. Time-resolved x-ray diffraction studies of myosin head movements in live frog sartorius muscle during isometric and isotonic contractions. J. Muscle Res. Cell Motil. 15:319–348. [DOI] [PubMed] [Google Scholar]
- 29.Linari, M., I. Dobbie, M. Reconditi, N. Koubassova, M. Irving, G. Piazzesi, and V. Lombardi. 1998. The stiffness of skeletal muscle in isometric contraction and rigor: the fraction of myosin heads bound to actin. Biophys. J. 74:2459–2473. [DOI] [PMC free article] [PubMed] [Google Scholar]
- 30.Yagi, N., S. Takemori, M. Watanabe, K. Horiuti, and Y. Amemiya. 1992. Effects of 2,3-butanedione monoxime on contraction of frog skeletal muscles, an x-ray diffraction study. J. Muscle Res. Cell Motil. 13:153–160. [DOI] [PubMed] [Google Scholar]
- 31.Horiuti, K., H. Higuchi, Y. Umazume, M. Konishi, O. Okazaki, and S. Kurihara. 1988. Mechanism of 2,3-butanedione 2-monoxime on contraction of frog skeletal muscle fibers. J. Muscle Res. Cell Motil. 9:156–164. [DOI] [PubMed] [Google Scholar]
- 32.Sun, Y. B., P. Lou, and K. A. P. Edman. 2001. 2,3-Butanedione monoxime increases speed of relaxation in single muscle fibers. Acta Physiol. Scand. 172:53–61. [DOI] [PubMed] [Google Scholar]
- 33.Bagni, M. A., G. Cecchi, F. Colomo, and P. Garzella. 1992. Effects of 2,3-butanedione monoxime on the cross-bridge kinetics in frog single muscle fibers. J. Muscle Res. Cell Motil. 13:516–522. [DOI] [PubMed] [Google Scholar]
- 34.Seow, C. Y., S. G. Shroff, and L. E. Ford. 1997. Detachment of low-force bridges contributes to the rapid tension transients of skinned rabbit skeletal muscle fibers. J. Physiol. 501:149–164. [DOI] [PMC free article] [PubMed] [Google Scholar]
- 35.Yu, L. C., J. E. Hartt, and R. J. Podolsky. 1979. Equatorial x-ray intensities and isometric force levels in frog sartorius muscle. J. Mol. Biol. 132:53–67. [DOI] [PubMed] [Google Scholar]
- 36.Brenner, B., and L. C. Yu. 1985. Equatorial x-ray diffraction from single skinned rabbit psoas fibers at various degrees of activation. Biophys. J. 48:829–834. [DOI] [PMC free article] [PubMed] [Google Scholar]
- 37.Hoskins, B. K., C. C. Ashley, R. Pelc, G. Rapp, and P. J. Griffiths. 1999. Time-resolved equatorial x-ray diffraction studies of skinned muscle fibers during stretch and release. J. Mol. Biol. 290:77–97. [DOI] [PubMed] [Google Scholar]
- 38.Xu, S. G., M. Kress, and H. E. Huxley. 1987. X-ray diffraction studies of the structural state of crossbridges in skinned frog sartorius muscle at low ionic strength. J. Muscle Res. Cell Motil. 8:39–54. [DOI] [PubMed] [Google Scholar]
- 39.Huxley, H. E., A. Stewart, H. Sosa, and T. Irving. 1994. X-ray diffraction measurements of the extensibility of actin and myosin filaments in contracting muscle. Biophys. J. 67:2411–2421. [DOI] [PMC free article] [PubMed] [Google Scholar]
- 40.Wakabayashi, K., Y. Sugimoto, H. Tanaka, Y. Ueno, Y. Takezawa, and Y. Amemiya. 1994. X-ray diffraction evidence for the extensibility of actin and myosin filaments during muscle contraction. Biophys. J. 67:2422–2435. [DOI] [PMC free article] [PubMed] [Google Scholar]
- 41.Ford, L. E., A. F. Huxley, and R. M. Simmons. 1981. The relation between stiffness and filament overlap in stimulated frog muscle fibers. J. Physiol. 311:219–249. [DOI] [PMC free article] [PubMed] [Google Scholar]
- 42.Bagni, M. A., G. Cecchi, B. Colombini, and F. Colomo. 1998. Myofilament compliance and sarcomere tension-stiffness relation during the tetanus rise in frog muscle fibers. Adv. Exp. Med. Biol. 453:383–391. [DOI] [PubMed] [Google Scholar]
- 43.Piazzesi, G., M. Reconditi, I. Dobbie, M. Linari, P. Boesecke, O. Diat, M. Irving, and V. Lombardi. 1999. Changes in conformation of myosin heads during the development of isometric contraction and rapid shortening in single frog muscle fibers. J. Physiol. 512:305–312. [DOI] [PMC free article] [PubMed] [Google Scholar]
- 44.Xu, S., J. Gu, T. Rhodes, B. Belknap, G. Rosenbaum, G. Offer, H. White, and L. C. Yu. 1999. The M.ADP.Pi state is required to helical order in the thick filaments of skeletal muscle. Biophys. J. 77:2665–2676. [DOI] [PMC free article] [PubMed] [Google Scholar]


