

Abstract
Polynucleotide adsorption to negatively charged surfaces via divalent ions is extensively used in the study of biological systems. We analyze here the adsorption mechanism via a self-consistent mean-field model that includes the pH effect on the surface-charge density and the interactions between divalent ions and surface groups. The adsorption is driven by the cooperative effect of divalent metal ion condensation along polynucleotides and their reaction with the surface groups. Although the apparent reaction constants are enhanced by the presence of polynucleotides, the difference between reaction constants of different divalent ions at the ideal condition explains why not all divalent cations mediate DNA adsorption onto anionic surfaces. Calculated divalent salt concentration and pH value variations on polynucleotide adsorption are consistent with atomic force microscope results. Here we use long-period x-ray standing waves to study the adsorption of mercurated-polyuridylic acid in a ZnCl2 aqueous solution onto a negatively charged hydroxyl-terminated silica surface. These in situ x-ray measurements, which simultaneously reveal the Hg and Zn distribution profiles along the surface normal direction, are in good agreement with our model. The model also provides the effects of polyelectrolyte line-charge density and monovalent salt on adsorption.
INTRODUCTION
For over a decade biomimetic images of surface-stabilized DNA or RNA have been collected by atomic force microscope (AFM) in air or in aqueous solutions (1,2). Important AFM studies include DNA condensation for gene therapy, single-molecule mechanics, and DNA-protein interaction (3–7). This technique requires DNA or RNA to adsorb onto a substrate. Surprisingly, one of the commonly used substrates for AFM imaging of DNA or RNA is negatively charged mica (8,9). It was found that DNA could tightly bind to mica with suitable solution concentrations of Ni2+, Co2+, or Zn2+ ions. However, certain other divalent metal ions such as Mg2+, Ca2+, Cd2+, or Hg2+ cannot bind DNA to mica tightly or cannot bind DNA at all (9). Hansma et al. provided a reasonable explanation for these observations (9). Namely the divalent metal ions react with the hydroxyl groups in the “cavities” of mica surface. The ions with large ionic radii cannot fit into the mica cavities and therefore cannot bind DNA to mica. However, narrow ionic strength conditions are often required for adsorption, suggesting a more complex mechanism.
The mechanism of polyelectrolyte adsorption onto an oppositely charged surface is straightforward. The release of surface counterions and/or the condensed counterions of polyelectrolytes decreases the total free energy (10–12). However, when polyelectrolytes adsorb onto a like-charged surface, more counterions need to be attracted onto the surface to neutralize the charge. The loss of the counterion translational entropy is free-energy unfavorable. Therefore the ion-mediated adsorption has to involve strong correlations and/or specific interactions. An understanding of this mechanism will aid in tuning the adsorption of DNA or RNA by adjusting salt concentration, pH value, or other parameters. Such an understanding will also help clarify the interactions of RNA-membrane, protein-protein, DNA-protein, and other biological systems that involve the electrostatic, specific, and short-range interactions.
Possible scenarios to explain the mechanisms of DNA adsorption onto negatively charged surfaces include correlations among condensed ions along the DNA and/or the surface, ignored by the Poisson-Boltzmann approach, which accounts only for long-range correlations. However, modified approaches, including integral equations, have been used to carefully include short-range correlations among all charged elements, and these correlations have been shown to induce surface-charge inversion under certain conditions (13); equivalent approaches can also be used to include correlations among multivalent ions, charged chains, and co-ions to determine the conditions for charge inversion of linear polyelectrolytes (14). One could naively assume that the correlations lead to charge inversion of the DNA or of the surface leading to attractions. The adsorption of DNA onto mica has also been explained by correlations between divalent counterions, which nearly neutralized the charge of both the DNA and the mica (15). However, these possible mechanisms are not convincing. First of all, Mg2+ condensation along DNA has been shown by small-angle x-ray scattering to be in excellent agreement with a nonlinear Poisson-Boltzmann prediction (16). That is to say, the correlations between divalent counterions are not large enough to overcharge DNA, and there are no specific short-range interactions among Mg2+ and DNA (17). Nevertheless, Mg2+ can weakly bind DNA to mica (18). Moreover, neither of these suggestions explains why not all the divalent metal ions can bind DNA to a negatively charged surface. Since the radii of different hydrated divalent metal ions are similar, the correlation effects should be similar. Furthermore, these correlation-mediated mechanisms cannot explain why DNA is not precipitated in a bulk solution of divalent ions (19). Ion bridging between the anionic surface groups and chain monomers via divalent ions could explain the counterion-mediated adsorption if the surface is weakly charged and the divalent metallic ions have specific interactions with both of the polynucleotides and the surface such that the short-range interactions are strong enough to overcome the electrostatic repulsion between the surface and like-charged polyelectrolytes (20). However, not all the divalent metal ions that mediate DNA adsorption have specific short-range interactions with DNA (18), and DNA can move freely on mica under certain conditions (9). Therefore, ion bridging, which requires divalent ions to react with both the surface and the polynucleotides, is not necessary for adsorption.
To understand the mechanism of polynucleotide adsorption, we need to know both the polynucleotide and divalent metal ion distributions. For this, we use the in situ long-period x-ray standing wave (XSW) technique (21–23) to measure mercury-labeled polyuridylic acid(5′) potassium salt (Hg-poly(U)) adsorption to a negatively charged hydroxylated silica surface in a ZnCl2 aqueous solution. Compared with AFM, the advantages of the XSW measurement are that it can provide quantitative element-specific distribution profiles, ρ(z), perpendicular to the surface that have a range in height, z, that extends from the adsorption surface out through the micron-thick bulk solution layer. Poly(U) is used because every uracil base in poly(U) can be completely mercurated (24) and to avoid complications arising from the native conformation of RNA. Mercuration makes the study of poly(U) adsorption become available through x-ray fluorescence (XRF) signals from the Hg atoms induced by the XSW. Zinc is chosen because of the very weak chemical interaction between Zn2+ and poly(U) (17) and because it also has a detectable XRF signal. Instead of mica, an amorphous silica surface is employed so that we can compare our theory and experiment easily and do not need to include the complex structure of mica in our model. Experimental methods and results are described in Materials and Methods.
In Theoretical Model and Discussion, we outline a mean-field theoretical model, including the effect of pH on the surface-charge density and the interactions between divalent ions and surface groups in the presence of polynucleotides. When the polynucleotides with their condensed divalent counterions approach the like-charged surface, the divalent counterion local concentration increases, promoting the reaction of the ions with the surface groups (Fig. 1). This process decreases the total free energy and cooperatively leads to polynucleotide adsorption. Although we do not include the divalent ion correlation, which is weaker than the effect of the interaction of the divalent ions with the surface, we believe this correlation can enhance polynucleotide adsorption. The results of the theoretical model are in good agreement with our experimental results. We also qualitatively compare the theory with the known AFM experimental results and provide predictions for general polyelectrolyte adsorption to like-charged surfaces.
FIGURE 1.

Scheme for M2+ mediated adsorption of a negatively charged polynucleotide to a negatively charged hydroxylated SiOx surface.
EXPERIMENTAL PROCEDURE
Materials and methods
Hg-poly(U) preparation
Polyuridylic acid(5′) potassium salt (2380–2900 units) was obtained from Sigma Chemical Co. (St. Louis, MO). Poly(U) was labeled with mercury following the method of Dale, et al. (24). After extensive dialysis, we insured that all the Hg atoms in the solution were covalently bonded to poly(U). Compared to the ultraviolet spectra of poly(U), the maximum absorption peak of Hg-poly(U) showed a 5-nm red shift, which is a sign of full mercuration (24). Elemental analysis using an inductively coupled plasma spectrometer (ICP) also confirmed that there was a one-to-one ratio of uracil to Hg atoms.
Sample preparation
The adsorption surface was the silica surface that formed on top of a Si/Mo multilayer x-ray mirror that was grown by sputter deposition on a 10 × 25-mm Si substrate that was 0.4-mm thick. The Si/Mo multilayer had 60 layer pairs, a periodicity of d = 3.7 nm and a relative Mo thickness of tMo/d = 0.46. The top Si layer forms a 1-nm-thick SiO2 layer. The SiO2 surface was hydroxylated (5 silanol groups/nm2) by a treatment (25) that used a 5 wt % NaOH solution. For the in situ x-ray measurements, the sample was held inside a reflection-geometry liquid-solid interface cell with a 7-μm-thick Kapton film x-ray window (Fig. 2). Before Hg-poly(U) adsorption, the substrate surface was flushed three times by injecting 30 ml of ZnCl2 solution with a nominal concentration of 50 μM. Subsequently, a 0.50-ml solution of ZnCl2 and Hg-Poly(U) with nominal concentrations of 50 μM each was injected into the cell and then withdrawn after 20 min, leaving a thin liquid layer (5-μm thick) trapped between the substrate and Kapton film.
FIGURE 2.

Photograph of liquid-solid interface cell. The Kapton film is sealed against the substrate holder by an annular aluminum ring with the Si/Mo x-ray mirror substrate in the center. The grazing angle incident beam direction is along the length of the sample. The three valves are used for injecting and withdrawing aqueous solutions. The solid-state x-ray fluorescence detector collects x-rays that are emitted from the sample surface through a small window aperture in a Pb cap that covers the detector.
In situ XSW measurements
The XSW experiments were carried out at undulator station 5ID-C of the Advanced Photon Source, Argonne National Laboratory. The detailed experimental setup, data collection method, and procedure for XSW measurements have been described previously (21–23). The synchrotron radiation was tuned to 12.40 keV by a Si(111) monochromator. The incident beam size was 20-μm high by 1-mm wide. Using an integrated system that includes an x-ray diffractometer and energy dispersive XRF spectrometer, XRF spectra from the sample surface were collected at each angular step of a specular reflectivity scan through the first-order Bragg peak of the multilayer mirror. Scanning in angle θ through this peak causes the XSW to shift inward by one-half of a d-spacing, which in turn causes the XRF yield from each atom to modulate with a characteristic phase that is directly related to the displacement height z of the atom above the surface.
EXPERIMENTAL RESULTS
Fig. 3 shows the XSW results for the ZnCl2 mediated Hg-poly(U) adsorption onto a hydroxyl-terminated substrate. The angle θ dependence of the measured reflectivity (squares) closely matches the theory-predicted curve (solid black line) (26) that models the electron-density profile of the multilayer including the Mo, Si, water, and Kapton layers and their respective interfaces. The angle θ dependence of the measured Zn Kα XRF yield (circles) is modeled by a simple step-function (Fig. 4) for the Zn atomic distribution profile, ρ(z). The three free parameters determined by the fit of the modeled yield, Y(θ) = ∫ρ(z)I(θ,z)dz, to the data are: the fraction (fS) of Zn atoms that reside in the condensed layer, the thickness (t) of the condensed layer, and the mean height 〈z〉 of the condensed layer above the silica surface. The remaining fraction (1 − fS) of Zn atoms are partitioned into the dilute and much thicker bulk layer with thickness tW = 5.5 μm as measured by x-ray reflectivity analysis. The same type of step-function model was applied to the angle θ dependence of the Hg Lα XRF yield data to determine the same set of free parameters for the Hg atomic distribution profile. These XSW findings are listed in Table 1 along with the values of the XRF-determined Zn and Hg total-depth integrated atomic densities, nT. These XRF-measured nT values are based on side-by-side comparison measurements with a calibrated sample and the calculated XRF emission rate ratio (27) of 1.69 for the Hg Lα (at 9.98 keV) to the Zn Kα (at 8.63 keV). The x-ray transmission factors for the water and Kapton layers were also included in the calculation of the E-field intensity, I(θ,z). Also listed in Table 1 are the x-ray measured surface condensed-layer atomic densities (nS = fs nT) and bulk layer concentrations (ρB). Note that these concentrations are reasonably close to the expected nominal 50-μM concentration of the original solution.
FIGURE 3.

The XSW experimental data and theoretical fit (solid lines) of first-order Bragg reflectivity peak (squares) and x-ray fluorescence yields (Zn Kα, circles; Hg Lα, diamonds). The dashed line shows the yield for the case of no adsorption on the surface.
FIGURE 4.

The step-function-like distribution profiles for the Zn and Hg atomic density as a function of height z above the silica surface. These were used to generate the modeled Zn and Hg XRF yield curves shown in Fig. 3. The model includes a very thin condensed layer at the liquid/solid interface followed by a very dilute bulk-solution layer with thickness tw = 5.5 μm. The values determined for the models are listed in Table 1.
TABLE 1.
X-ray-determined values for Zn and Hg atomic distribution profiles shown in Fig. 4
| Atom | nT atoms/nm2 | nS atoms/nm2 | t nm | 〈z〉 nm | fS | ρBμM | tWμm |
|---|---|---|---|---|---|---|---|
| Zn | 0.14 | 0.031 | 0.4 | 0.2 | 0.22 | 33 | – |
| Hg | 0.13 | 0.016 | 0.7 | 0.5 | 0.12 | 37 | 5.5 |
nT, total depth-integrated atomic density from XRF; nS, surface condensed layer atomic density from XSW and XRF; t, thickness of condensed layer from XSW; 〈z〉, mean height of condensed layer from XSW; fS, fraction of atoms in condensed layer from XSW; ρB, concentration of atoms in bulk layer from ICP, XRF, and XSW; tW, thickness of bulk water layer from x-ray reflectivity.
For reasons of comparison, the XRF yield curve that would have been observed for the case of no surface condensation (i.e., fS = 0) is shown as a dashed line in Fig. 3. The observed deviations of the data from this line indicate that a condensed layer of Zn and a separate condensed layer of Hg-poly(U) occur under these conditions. Correspondingly, the thickness t of the condensed layer is 0.4 nm for Zn and 0.7 nm for Hg. The measured yield curves in Fig. 3 for the Zn and the Hg are distinctively different and lead to the two distinctively different atomic density profile curves depicted in Fig. 4, with the condensed layer of Zn atoms narrower and closer to the silica surface and the Hg layer thicker and displaced outward.
THEORETICAL MODEL AND DISCUSSION
Polynucleotide adsorption to like-charged surfaces in divalent salt solutions is widely used in biological studies. The revelation of the density profiles of both the divalent ions and the polynucleotides provides a unique opportunity to develop and test a divalent-ion-mediated adsorption model. We propose here a self-consistent theoretical model incorporating our XSW experimental results to explain the adsorption mechanism and factors affecting the adsorption.
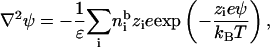
We first describe the reactions that lead to the formation of charges on the surface. In our experiment, silanol groups on the top of silica surfaces dissociate in aqueous solutions and make the surfaces negatively charged via the reaction
 |
(1) |
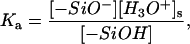
The above reaction has a dissociation constant Ka, and the pKa = −logKa value is 7.2 (28). The surface-charge density or the reaction balance is not simply determined by Ka. The local environment, such as the local electrostatic potential and short-range interactions when applicable, modifies the reaction balance. The modifications are included in our model. We take into account another reaction that occurs in the presence of divalent salts. The divalent metal ions react with silanol groups and create positive charges via
 |
(2) |
The association constant K in Eq. 2 varies with different kinds of metal ions. The available pK = −logK values range from 8.1 for Mg2+ to 5.1 for Pb2+ (29). Although in the bulk solution divalent metal ions may bind to two silanol groups, this is unlikely on a surface due to surface structural confinement (28) and therefore is excluded from our model. Some divalent metal ions strongly interact with the surface and may invert the surface charge at high salt concentration. However, as shown here, surface-charge inversion does not occur at low divalent salt concentration and is not necessary for polynucleotide adsorption. A silica surface in a solution with low divalent salt concentration is highly neutralized by the condensed reacted and unreacted metal ions, but still negatively charged. The balance of reaction in Eq. 2 is not only determined by K. It is also modified by the electrostatic potential, which is a function of the local ionic concentrations.
A well-known model for metal ion adsorption to negatively charged surfaces is the site-binding model, which resolves the Poisson-Boltzmann equation by including surface-group ionization and the reaction of metal ions with surface groups (30). Although a site-binding model is successful in explaining the ion surface condensation, it cannot resolve complicated systems such as the problem of polynucleotide adsorption to a like-charged surface. To analyze divalent-ion-mediated adsorption of polynucleotides, we first develop a simple two-state model for divalent metal ion (M2+) adsorption to an anionic surface from a MCl2 solution. As discussed below, this model is equivalent to a site-binding model. We then extend this model to include polynucleotides (or other polyelectrolytes) in the system. We self-consistently find the surface density of adsorbed polyelectrolytes and metal ions, the degree of surface ionization, and the fraction of reacted surface groups with the metal ions.
Model
Metal ion adsorption on silica surface
In this section we construct the free energy using a two-state model where the ions can be either on the surface or in the bulk solution. Minimizing the free energy of this model is equivalent to equilibrating the chemical potentials of components in the bulk solution and on the surface. In the section of theoretical results, we compare our results with the site-binding model for ion adsorption from a MCl2 solution. Our method is not only convenient to calculate polynucleotide adsorption by including ion condensation along polynucleotides, but also convenient for including possible correlation effects that are too complex to be incorporated by modifying the Poisson-Boltzmann equation directly. In the calculations, the free energy is in units of kBT and includes the following terms:
 |
(3) |
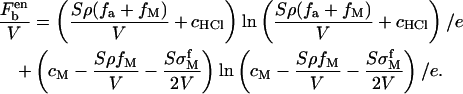
The first term is the free energy change due to the silanol group dissociation and is given by
 |
(4) |
where S is the surface area, ρ is the silanol group density on the surface, and fa is the fraction of dissociated silanol groups. Then Sρfa is the total number of dissociated silanol groups.
The second term in Eq. 3 results from the chemical interaction between divalent metal ions and silanol groups,
 |
(5) |
The fraction of silanol groups reacted with M2+ is denoted by fM. The total number of −SiOM+ on the surface is SρfM.
The entropic contribution of the reactions to the free energy is given by
 |
(6) |
Eq. 6 is obtained without including lateral correlations among the ions, which are negligible for divalent metal ion adsorption. Besides the reacted divalent metal ions, there are still some divalent metal ions condensed on the surface through electrostatic attractions. Their entropic contribution to the total free energy is represented as
 |
(7) |
The charge density of this freely moved divalent metal ion layer is  Here h is the layer thickness which, according to our experimental data, is ∼0.5–1 nm. The amount of adsorbed monovalent ions on a silica surface can be neglected unless the monovalent salt concentration is comparable to or larger than the divalent salt concentration. Therefore we neglect the amount of condensed hydrogen ions. The fraction of condensed monovalent metal ion is included when there is a large amount of monovalent salt in our systems.
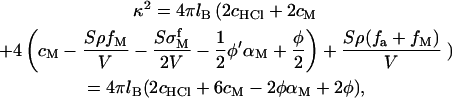
The fifth term in Eq. 3 is the electrostatic energy
 |
(8) |
where  is the electrostatic potential of a homogeneously charged surface and equal to
  (z = 0) (31). The Bjerrum length is
 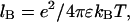 where e is the elementary charge and ɛ is the solvent permittivity. Its value is 0.714 nm for water at room temperature. The inverse Debye screening length, κ, is given by
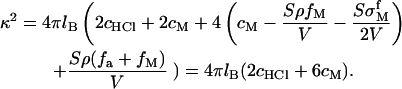 |
(9) |
The divalent salt concentration in the bulk solution is cM. The concentration of HCl (cHCl) is used to adjust the pH value of the system and NaOH also can be employed to get a basic solution with high pH value. The bulk solution volume is V which is assumed to be infinitely large in our calculation. Then 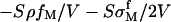 is the concentration change due to metal ion adsorption and
 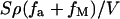 is the H+ concentration change from the chemical reactions. When the volume is very large, these two terms are negligible. In Eq. 8, we use the electrostatic potential at z = 0 because κh is much less than 1 in the range of our considered salt concentration.
For the free energy of the solution, the entropic contributions from negatively charged ions are not taken into account since their concentrations are constant in solutions. The contribution from positively charged ions is
 |
(10) |
The Helmholtz electrostatic energy between ions is approximated by (32)
 |
(11) |
where a is the size of the ions. This term is important only if the Debye screening length is close to Bjerrum length. Finally the surface density of the adsorbed metal ions can be obtained by minimizing the free energy.
Polynucleotide adsorption onto negatively charged surfaces through divalent metal ions
In the system discussed here, the polynucleotides are in a MCl2 solution. For simplicity we describe the model when M2+ ions are the only metal ions in solution. When the monovalent metal ions are also in solution, the total free energy needs to include the terms of monovalent metal ions. These terms have the same form as those of divalent ions except that the monovalent ions do not chemically react with surface groups and the valence of 2 is replaced by 1.
The free energy of the system is also given by Eq. 3. The first four terms have the same expression as Eqs. 4–7. For polynucleotide adsorption,  is overestimated without including correlation effects when the distance between adsorbed polynucleotides is large. Obviously, under this condition, the area closer to the polynucleotide has a larger local fM and the entropy overestimation can result in a higher calculated surface density of adsorbed polynucleotide. However, this simple estimation provides a correct trend and the results become more trustable with the increase of the polynucleotide surface density.
The electrostatic energy on the surface is formulated as
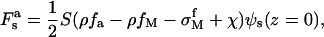 |
(12) |
 |
(13) |
where χ is the charge density coming from the adsorbed polynucleotides. Nearly all the phosphate groups along the polynucleotide are ionized unless the solution pH is near or lower than 2, which is not a common condition in biology. In our model, we assume that all the phosphate groups are ionized. Therefore χ is also the adsorbed nucleotide density on the surface. The surface electrostatic potential is  A surface potential is used here because the adsorbed polynucleotide layer is flat, as shown experimentally in Fig. 3. In the bulk solution, some of the divalent metal ions are condensed along the polynucleotide chains to decrease the electrostatic energy. We denote by αM the fraction of nucleotides with condensed counterions. That is to say, the effective charge of every nucleotide is 1 − αM. The nucleotide concentration in the solution is φ and becomes φ′, which is
  after polynucleotide adsorption. The third term in Eq. 13 is the divalent metal ion concentration in the bulk solution after adsorption.
The free energy of the solution is shown in our previous work (12) and is given by
 |
(14) |
where N is the number of nucleotides per polynucleotide chain and φ′/N is the concentration of polynucleotide chains. The terms in the last pair of square brackets are the translational entropic contribution of condensed divalent counterions along the chain to the free energy, the intrachain electrostatic energy, and the translational entropy of chains in the bulk, respectively. The meanings of other symbols are: r, the radius of the chains; b, the distance between neighboring charge groups; and a, the size of divalent metal ions. When we calculate the intrachain electrostatic energy, the chain is assumed to be a rod. The conformation of the polynucleotide chain is not simply a rod when N is large even if the chain is highly stretched due to electrostatic interaction and chain stiffness. Fortunately, rigorous calculation only showed a slightly larger αM compared with that of rod conformation (33,34). Although DNA has weak chemical interactions with some divalent metal ions (17), we do not consider the binding between nucleotide and metal ions. These chemical interactions reduce the effective charge of DNA and the unreacted condensed divalent metal ions along DNA, which have opposite effects on DNA adsorption to an anionic surface.
Theoretical results and comparison with experimental results
Comparison with XSW experimental result and site-binding model for simple divalent salt solutions
We first discuss metal ion (M) adsorption from an aqueous MCl2 salt solution in the absence of polynucleotide. The density of divalent metal ions adsorbed to the negatively charged surfaces ns is highly dependent on the interaction strength between the metal ions and the surface groups. With our model we find that ns for the adsorbed metal ions on the surface in a simple MCl2 solution rises with an increase in association constant K as shown in Fig. 5; the divalent metal ion surface densities include both the reacted and unreacted condensed divalent metal ions. The values of the salt concentration and surface properties in the calculations are the same as in the experiments described in Materials and Methods. For Zn2+ we expect pK to be slightly greater than the value 5.5 found for Cu2+ (28,29). The calculated result for a solution with a pH slightly lower than 7 matches the value of ns = 0.037/nm2 observed in separate XSW experiments (35). Pure ZnCl2 solution is a weak acid solution due to the formation of Zn(OH)2. The calculated effective surface charges are still negative and are not shown in Fig. 5. Since the exact pK value of Zn is unknown, to guide the eye we use a short solid line to mark the XSW experiment result for the total Zn surface density (ns = 0.037/nm2) in Fig. 5.
FIGURE 5.

The calculated variation of condensed divalent metal ion on the silica surface as a function of the association constant of the reaction in Eq. 2 using the following experimental parameters: [ZnCl2] = 17 μM; hydrated ion radius, 0.45 nm; zinc layer thickness, 1 nm; pKa = 7.2, and silanol group surface density, 5/nm2. The short solid line marks the XSW experimental result, Zn surface density 0.037/nm2.
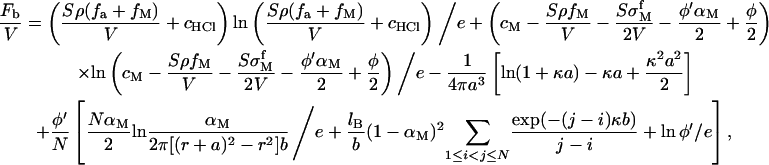
As for the calculation of the site-binding model, we use the Poisson-Boltzmann equation
 |
(15) |
where  is the bulk concentration of one species of ions and zi is its valence. The following equations are also used in the calculation:
 |
(16) |
 |
(17) |
 |
(18) |
where [−SiO−] = ρfa, [−SiOM+] = ρfM and [−SiOH] = ρ(1 − fa − fM). The surface concentrations of the hydrated hydrogen ions, [H3O+]s =  and of the divalent metal ions, [M2+]s=
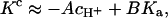
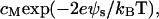 which clearly reveal the effect of electrostatic potential on the reaction balance. The apparent reaction constant of K is
  Since the polynucleotide charge is negative, the apparent reaction constant is enhanced when polynucleotides approach the surface. Although the site-binding model has a succinct expression, it involves nonlinear differential equations that cannot be resolved for complicated systems. The total surface density of the adsorbed ions is the sum of the reacted metal ions and the ions in the diffuse layer within h to the surface. As shown in Fig. 5, the results of both models are very close.
Factors affecting polynucleotide adsorption and comparison with experimental results
The x-ray technique reveals the polynucleotide and divalent ion distributions simultaneously, providing an opportunity for direct comparison with theory. We use the experimental solution concentrations as parameters in our calculation and show the results in Fig. 6. The calculated polynucleotide and metal ion surface densities at pH 6.7 (Fig. 6, without NaCl) are in good agreement with experimental values, 0.031/nm2 for zinc and 0.016/nm2 for mercury. The XSW experimental results of Zn and Hg surface densities are marked in Fig. 6 by short parallel solid and dashed lines, respectively.
FIGURE 6.

Effect of monovalent salt on the nucleotide and divalent metal ion surface density. For the solution without monovalent salt, we use the following parameters from our XSW experiment: pH = 6.7; hydrated ion radius, 0.45 nm; zinc layer thickness, 0.4 nm; pKa = 7.2; silanol group surface density, 5/nm2; poly(U) concentration, 33 μM (in term of nucleotide concentration); divalent salt concentration, 37 μM; distance between neighboring charges, 0.45 nm; diameter of poly(U), 1 nm; and number of nucleotides per chain, 2500. The short solid and dashed lines mark the XSW experimental results for Zn surface density (0.031/nm2) and Hg surface density (0.016/nm2), respectively. The solution with NaCl has the same parameters as the experiment except that the concentration of monovalent salt is 150 μM.
It was pointed out by Pastré et al. (15) in their correlation model that monovalent cations compete for the mica surface and DNA with divalent cations and inhibit the DNA adsorption onto mica. We self-consistently calculate the effect of monovalent cations on the polynucleotide and divalent metal ion surface densities. In the calculation, we assume that there is no chemical reaction between monovalent cations and the surface charge groups. The only interaction making monovalent cations condense along the polynucleotides or the surface is the electrostatic interaction in our model. It is shown in Fig. 6 that both the polynucleotide and metal ion surface densities decrease after the addition of monovalent salt. Although monovalent salt restrains polynucleotide adsorption, a large amount of monovalent salt is essential to protect double-stranded DNA from denaturing.
The results in Fig. 6 also demonstrate that the reaction strength between divalent ions and surface groups greatly affects the polynucleotide adsorption. This explains why not all divalent metal ions can mediate polynucleotide adsorption onto negatively charged surfaces. We discuss this further at the end of this section.
For polyelectrolyte adsorption to oppositely charged surfaces, the surface density of adsorbed chains decreases with increasing salt concentration when the correlations between adsorbed polyelectrolytes are insignificant. The reduction is due to the screened electrostatic attraction and the lessening of entropy gain by release or partial release of the surface and polyelectrolyte condensed counterions (12). On the contrary, divalent metal ions are indispensable to annihilate the charge on a surface when polynucleotides adsorb onto a negatively charged surface. At high divalent salt concentration, the translational entropy loss upon divalent metal ion surface chemical condensation is trivial. Therefore, polynucleotide surface density increases with the divalent salt concentration, as shown in Fig. 7. The XSW experimental value for polynucleotide surface density, 0.016/nm2, is marked in Fig. 7 by a black circle.
FIGURE 7.

The calculated variation of the nucleotide and metal ion surface coverage on the silica surface as a function of divalent salt concentration using the following poly(U) solution parameters: pH = 6.7; hydrated ion radius, 0.45 nm; zinc layer thickness, 0.4 nm; pKa = 7.2; pK = 5.8; silanol group surface density, 5/nm2; poly(U) concentration, 33 μM (in terms of nucleotide concentration); distance between neighboring charges is 0.45 nm; diameter of poly(U), 1 nm; and number of nucleotides per chain, 2500. The black circle marks the XSW experimental result, Hg surface density 0.016/nm2, for divalent salt concentration 37 μM.
Our model predicts that the surface densities of reacted divalent ions rise nearly linearly with the adsorbed polynucleotides, and that the unreacted divalent metal ions in the condensed layer rise only slightly (Fig. 7). When the highly neutralized DNA or polynucleotide approaches a charged surface, the local divalent metal ion concentration increases and more divalent ions react with the surface groups. This reaction and the cooperative effect are the driving forces for polynucleotide adsorption.
There are many experimental results on divalent-metallic-ion-mediated DNA adsorption to mica. Although more complex ionic solutions and surface (mica) are used in those experiments, we expect that the basic trends observed in the experiments can be compared with the trends predicted by our model. In particular, Hansma et al. extensively studied the effects of divalent salt concentration (9) and solution pH (36) on DNA adsorption to mica using AFM. They showed that the DNA surface density on mica increases with Ni(II), Co(II), and Zn(II) divalent salt concentrations (9), in agreement with our theoretical prediction in Fig. 7. However, they also found that DNA surface density decreases when the divalent salt concentrations are higher than the order of 1 mM. One possible reason for DNA or polynucleotide desorption from a negatively charged surface at high divalent salt concentration is the saturation of available space for further M2+ to react with the surface groups. A similar explanation has been suggested by Hansma et al. (9). However, in their studies one cannot determine the surface density of divalent ions to estimate this effect. In another series of XSW experiments (Zhang, K., H. Cheng, J. A. Libera, M. Olvera de la Cruz, and M. J. Bedzyk, unpublished), we found that the Hg-poly(U) surface density was strongly reduced when the Zn surface coverage was increased to 0.7/nm2. Unfortunately, we also found Zn(OH)2 precipitation in our system at high ZnCl2 solution. Further XSW experiments with well controlled solutions need to be done before we make the conclusion that surface saturation is the reason for polynucleotide desorption.
For theoretical calculations, one must be exceedingly cautious at high divalent and/or monovalent salt concentrations, because molecular electrolytes are highly complex due to the association or clustering of the salt ions (37). This association phenomenon, known as Bjerrum association, is very relevant to the understanding of polynucleotides in aqueous solutions with large concentrations of multivalent salts (14). Further work including modification at high salt concentrations needs to be done to clarify DNA desorption at high divalent salt concentrations. Therefore, though our model can be extended to more general systems of polyelectrolytes and like-charged surfaces by varying the calculation parameters, major modifications arising at high divalent salt solutions need to be included. These modifications, such as ion association and steric repulsion on a surface, are expected to have major effects on adsorption.
Another possible reason for desorption of polynucleotide at high divalent salt concentrations is that at very high divalent ion concentrations the solution pH decreases due to the formation of metal hydroxide. Our model shows that the pH value has a significant effect on polynucleotide adsorption. It was reported that more DNA adsorb onto mica at higher pH values unless most of the zinc ions react with OH− and precipitate (36). We find in our model that the polynucleotide surface density increases with pH value under certain conditions, as shown in Fig. 8 A. However, it is also possible for the surface density to decrease with a rising pH value, as shown in Fig. 8 B. The main differences between calculation parameters in Fig. 8, A and B, are in the monovalent salt concentration and the polyelectrolyte line-charge density. We use the line-charge densities of double-stranded DNA equal to 0.17 e/nm in Fig. 8 A and of poly(U) equal to 0.45 e/nm in Fig. 8 B. Our calculation results can be understood with the following explanation. Both −SiO− and −SiOM+ increase when the pH rises. More polynucleotides adsorb onto the surface only if −SiOM+ has a larger increase. The result of the competition not only depends on K and Ka but also relies on the line-charge density and salt concentration.
FIGURE 8.

Effect of solution pH value on polynucleotide adsorption for parameters representing double-stranded DNA in A and poly(U) in B. In A, the distance between neighboring charges is 0.17 nm, the rod diameter is 2 nm, the number of base pairs per chain is 500, and the monovalent salt concentration is 10 mM. In B, the distance between neighboring charges is 0.45 nm, the rod diameter is 1 nm, the number of nucleotide per chain is 1000, and the monovalent salt concentration is 1 mM. In both A and B, the polynucleotide concentration is 25 μM (in terms of the nucleotide concentration), the divalent salt concentration is 0.1 mM, the pK = 5.7, the hydrated ionic radius is 0.45 nm, the zinc layer thickness is 1 nm, pKa = 7.2, and the silanol group surface density is 5/nm2.
We analyze the effect of polyelectrolyte line-charge density on polyelectrolyte adsorption to like-charged surfaces and illustrate the importance of the line-charge density on adsorption in Fig. 9. Although, the diameter of a single stranded polyelectrolyte is around 1nm and that of double stranded DNA is 2 nm, we assume the diameters of all polyelectrolyte rods are 1 nm, so that we can focus on the effect of polyelectrolyte line-charge density (1/b). When a polyelectrolyte adsorbs onto a like charged surface, more counterions condense onto the surface. This process decreases the translational entropy of counterions. However, if the polyelectrolyte charge is already highly neutralized by counterions in the bulk solution, the compensation of translational entropy loss is slight. And then the polyelectrolyte is easier to adsorb. It is widely known that with the increase of polyelectrolyte line-charge density, more counterions condense along the chain and the effective polyelectrolyte charge decreases (38). Therefore the polyelectrolyte surface density rises with the line-charge density, 1/b.
FIGURE 9.

Effect of polyelectrolyte line-charge density (1/b) on adsorption calculated using the same parameters as in Fig. 7 except that the divalent salt concentration is fixed at 37 μM. Two pK values, 5.6 and 5.8, are used in the calculation. The black circle marks the XSW experimental result, Hg surface density 0.016/nm2.
It is known that only some kinds of divalent metal ions can mediate DNA adsorption to mica. Is there a simple rule for divalent-cation-mediated polyanion adsorption to anionic surfaces? The first prerequisite is that the divalent ions do not precipitate the polyanion in solutions. With our model we find that for a given polyanion solution and salt concentration, there is a critical K value
 |
(19) |
where A and B are fixed and larger than zero, below which no polyelectrolyte adsorption to like-charged surfaces occurs. This result is obtained by assuming that the variation of the pH from 6 to 8 does not change the screening length, which is dominated by the salt concentration, and that the polyelectrolyte charge is pH-independent in this pH range. That is, the chemical potentials of the polyelectrolytes in the bulk or on the surface are constant and, consequently, ψs is a constant included in A and B. Notice that −cH+/Ka is the ability to produce negative charges on the surface, and K/Ka is the association constant of the reaction creating positive charges on the surface via −SiO− + M2+ ⇔ SiOM+ (SiOH can be replaced by other surface groups). Therefore, our model suggests that it is easier to adsorb strongly charged polyanions to an anionic surface if the surface groups are hard to ionize and if they interact more strongly with the divalent metal ions. The ability to form negative or positive charges involves the effective surface electrostatic potential in A and B, which are determined by the charge density of the polyelectrolyte and salt concentration.
CONCLUSION
We formulate a self-consistent theoretical model that clarifies the mechanism of polynucleotide adsorption onto negatively charged surfaces in divalent salt solutions. When polynucleotides approach the surface, their electrostatic potentials induce the increase of surface divalent ion concentration, which promotes the reaction of divalent ions with the surface and results in polynucleotide adsorption. The effects of association constant of the reaction of metal ions with surface groups, monovalent salt, divalent salt concentration, the solution pH value, and the polyelectrolyte line-charge density on the adsorption are well described by our model. However, our model is not suitable for very high divalent salt concentrations because the Debye-Hückel model breaks down and the clustering of the divalent ions and co-ions around the polynucleotides in the solution modify the polynucleotide surface density.
To test our theory, the long-period x-ray standing wave technique was employed to study the adsorption of mercurated-polyuridylic acid (Hg-poly(U)) in a ZnCl2 aqueous solution onto a hydroxyl-terminated silica surface. We showed that the in situ x-ray measurements could simultaneously reveal the individually distinct Hg and Zn distribution profiles along the surface normal direction. This unique type of quantitative information should lead to more applications of this method in studying biological systems. The theoretical results are in good agreement with our XSW experiment. Our theory also explains most of the known AFM experimental results.
The only interaction between the divalent metal ions and polynucleotides in our model is electrostatic. However, some metal ions do have chemical interactions with polynucleotides. These interactions may have different effects on the polynucleotide adsorption due to the decrease of condensed unreacted divalent ions along polynucleotides and the effective polynucleotide charge.
Lateral short range ionic correlations between adsorbed chains and nonreacting divalent metal ions are not included in our model. These effects may become important under certain conditions. For example, diffusive counterion mediated attractions (39), such as those arising when hydrated divalent cations are sandwiched among negatively charged macroions, could be responsible (15) or contribute to the adsorption of polynucleotide to negatively charged surfaces if the adsorption layer is sufficiently dense and the reaction of the divalent ions with the surface is weak. When DNA adsorbs to positively charged surfaces, it is known that DNA does precipitate via certain divalent ions (40), leading to a large increase of charge densities at which lateral ionic correlations are significant. However, as shown here, the density of the adsorbed polynucleotide and divalent ions are too low to induce considerable short-range ionic correlations. Our model, which incorporates self-consistently the changes in the apparent reaction constant due to the presence of the polynucleotides, explains well the low-density adsorption shown in our XSW experiment. An important effect on the degree of adsorption is the image charge resulting from the permittivity difference between the aqueous solution and the substrate (41), which was not considered here but is expected to decrease the surface density of adsorbed polynucleotides since the permittivity of a substrate is much lower than that of water, leading to an image charge effect of the same sign as the polynucleotide.
Charged macromolecules influence the balance of the reaction of small ions with groups that are weakly charged (i.e., charge strongly depends on pH value). We find that this equilibrium-state regulation affects the interaction between a weakly charged surface or other macroions and polyelectrolytes. This idea may be applied to many biological systems, particularly protein-membrane interaction (42) and DNA or small interfering RNA deliveries, which involve interactions with negatively charged cell membranes. The mobility of charged lipids (43) and proteins in cell membranes, however, adds complexity to the calculation of the interaction between a cell membrane and DNA or RNA.
Acknowledgments
We gratefully acknowledge helpful discussions with P. Fenter and A. Mondragon and technical assistance from Z. Zhang, D. T. Keane, and A. A. Escuadro.
This work was supported by the National Institutes of Health (GM62109-02), National Science Foundation under contract EEC-0118025 to the Nanoscale Science and Engineering Center at Northwestern University, the Institute for BioNanotechnology in Medicine, and Baxter Healthcare Corp. The x-ray measurements were performed at Argonne National Laboratory's Advanced Photon Source, funded by the Department of Energy (W-31-109-Eng-38) using the DuPont-Northwestern-Dow Collaborative Access Team (DND-CAT) facilities supported in part by the State of Illinois (IBHE HECA NWU 96). This work made use of the Northwestern University Central Facilities supported by the Materials Research Science and Engineering Center program of the National Science Foundation (DMR-0076097).
References
- 1.Hansma, H. G., J. Vesenka, C. Siegerist, G. Kelderman, H. Morret, R. L. Sinsheimer, C. Busamante, V. Elings, and P. K. Hansma. 1992. Reproducible imaging and dissection of plasmid DNA under liquid with the atomic force microscope. Science. 256:1180–1184. [DOI] [PubMed] [Google Scholar]
- 2.Lyubchenko, Y. L., L. S. Shlyakhtenko, R. E. Harrington, P. I. Oden, and S. M. Linday. 1993. Atomic force microscopy of long DNA: imaging in air and under water. Proc. Natl. Acad. Sci. USA. 90:2137–2140. [DOI] [PMC free article] [PubMed] [Google Scholar]
- 3.Yaneva, M., T. Kowalewski, and M. R. Lieber. 1997. Interaction of DNA-dependent protein kinase with DNA and with Ku: biochemical and atomic-force microscopy studies. EMBO J. 16:5098–5112. [DOI] [PMC free article] [PubMed] [Google Scholar]
- 4.Kasas, S., N. H. Thomson, B. L. Smith, H. G. Hansma, X. S. Zhu, M. Guthold, C. Bustamante, E. T. Kool, M. Kashlev, and P. K. Hansma. 1997. Escherichia coli RNA polymerase activity observed using atomic force microscopy. Biochemistry. 36:461–468. [DOI] [PubMed] [Google Scholar]
- 5.Allison, D. P., P. S. Kerper, M. J. Doktycz, J. A. Spain, P. Modrich, F. W. Larimer, T. Thundat, and R. J. Warmack. 1996. Direct atomic force microscope imaging of EcoRI endonuclease site specifically bound to plasmid DNA molecules. Proc. Natl. Acad. Sci. USA. 93:8826–8829. [DOI] [PMC free article] [PubMed] [Google Scholar]
- 6.van Noort, S. J. T., K. O. van der Werf, A. P. M. Eker, C. Wyman, B. G. de Grooth, N. F. van Hulst, and J. Greve. 1998. Direct visualization of dynamic protein-DNA interactions with a dedicated atomic force microscope. Biophys. J. 74:2840–2849. [DOI] [PMC free article] [PubMed] [Google Scholar]
- 7.Hansma, H. G. 2001. Surface biology of DNA by atomic force microscopy. Annu. Rev. Phys. Chem. 52:71–92. [DOI] [PubMed] [Google Scholar]
- 8.Bustamante, C., and C. Rivetti. 1996. Visualizing protein-nucleic acid interactions on a large scale with the scanning force microscope. Annu. Rev. Biophys. Biomol. Struct. 25:395–429. [DOI] [PubMed] [Google Scholar]
- 9.Hansma, H. G., and D. E. Laney. 1996. DNA binding to mica correlates with cationic radius: assay by atomic force microscopy. Biophys. J. 70:1933–1939. [DOI] [PMC free article] [PubMed] [Google Scholar]
- 10.Park, S. Y., R. F. Bruinsma, and W. M. Gelbart. 1999. Spontaneous overcharging of macro-ion complexes. Europhys. Lett. 46:454–460. [Google Scholar]
- 11.Sens, P., and J.-F. Joanny. 2000. Counterion release and electrostatic adsorption. Phys. Rev. Lett. 84:4862–4865. [DOI] [PubMed] [Google Scholar]
- 12.Cheng, H., and M. Olvera de la Cruz. 2003. Adsorption of rod-like polyelectrolytes onto weakly charged surfaces. J. Chem. Phys. 119:12635–12644. [Google Scholar]
- 13.Kekicheff, P., S. Marcelja, T. J. Senden, and V. E. Shubin. 1993. Charge reversal seen in electrical double layer interaction of surfaces immersed in 2:1 calcium electrolyte. J. Chem. Phys. 99:6098–6113. [Google Scholar]
- 14.Solis, F. J. 2002. Phase diagram of dilute polyelectrolytes: collapse and redissolution by association of counterions and co-ions. J. Chem. Phys. 117:9009–9015. [Google Scholar]
- 15.Pastre, D., O. Pietrement, P. Fusil, F. Landousy, J. Jeusset, M. O. David, C. Hamon, E. Le Cam, and A. Zozime. 2003. Adsorption of DNA to mica mediated by divalent counterions: a theoretical and experimental study. Biophys. J. 85:2507–2518. [DOI] [PMC free article] [PubMed] [Google Scholar]
- 16.Das, R., T. T. Mills, L. W. Kwok, G. S. Maskel, I. S. Millett, S. Doniach, K. D. Finkelstein, D. Herschlag, and L. Pollack. 2003. Counterion distribution around DNA probed by solution X-ray scattering. Phys. Rev. Lett. 90:188103. [DOI] [PubMed] [Google Scholar]
- 17.Izatt, R. M., J. J. Christensen, and J. H. Rytting. 1971. Sites and thermodynamic quantities associated with proton and metal ion interaction with ribonucleic acid, deoxyribonucleic acid, and their constituent bases, nucleosides, and nucleotides. Chem. Rev. 71:439–481. [DOI] [PubMed] [Google Scholar]
- 18.Bustamante, C., M. Guthold, X. S. Zhu, and G. L. Yang. 1999. Facilitated target location on DNA by individual Escherichia coli RNA polymerase molecules observed with the scanning force microscope operating in liquid. J. Biol. Chem. 274:16665–16668. [DOI] [PubMed] [Google Scholar]
- 19.Messina, R., C. Holm, and K. Kremer. 2002. Like-charge colloid-polyelectrolyte complexation. J. Chem. Phys. 117:2947–2960. [Google Scholar]
- 20.Dobrynin, A. V., and M. Rubinstein. 2003. Effect of short-range interactions on polyelectrolyte adsorption at charged surfaces. J. Phys. Chem. B. 107:8260–8269. [Google Scholar]
- 21.Bedzyk, M. J., G. M. Bommarito, M. Caffrey, and T. L. Penner. 1990. Diffuse-double layer at a membrane-aqueous interface measured with x-ray standing waves. Science. 248:52–56. [DOI] [PubMed] [Google Scholar]
- 22.Bedzyk, M. J., D. H. Bilderback, G. M. Bommarito, M. Caffrey, and J. S. Schildkraut. 1988. X-ray standing waves: a molecular yardstick for biological membranes. Science. 241:1788–1791. [DOI] [PubMed] [Google Scholar]
- 23.Libera, J. A., R. W. Gurney, C. Schwartz, H. Jin, T. L. Lee, S. T. Nguyen, J. T. Hupp, and M. J. Bedzyk. 2005. Comparative x-ray standing wave analysis of metal-phosphonate multilayer films of dodecane and porphyrin molecular square. J. Phys. Chem. B. 109:1441–1450. [DOI] [PubMed] [Google Scholar]
- 24.Dale, R. M. K., E. Martin, D. C. Livingston, and D. C. Ward. 1975. Direct covalent mercuration of nucleotides and polynucleotides. Biochemistry. 14:2447–2457. [DOI] [PubMed] [Google Scholar]
- 25.Zhuravlev, L. T. 1987. Concentration of hydroxyl-groups on the surface of amorphous silicas. Langmuir. 3:316–318. [Google Scholar]
- 26.Parratt, L. G. 1954. Surface studies of solids by total reflection of x-rays. Phys. Rev. 95:359–369. [Google Scholar]
- 27.Puri, S., B. Chand, D. Mehta, M. L. Garg, N. Singh, and P. N. Trehan. 1995. K and L shell X-ray fluorescence cross sections. Atom. Data Nucl. Data. 61:289–311. [Google Scholar]
- 28.Iler, R. K. 1979. The Chemistry of Silica: Solubility, Polymerization, Colloid and Surface Properties, and Biochemistry. Wiley, New York.
- 29.Stumm, W., H. Hohl, and F. Dalang. 1976. Interaction of metal ions with hydrous oxide surfaces. Croat. Chem. Acta. 48:491–504. [Google Scholar]
- 30.Yates, D. E., S. Levine, and T. W. Healy. 1973. Site-binding model of the electrical double layer at the oxide/water interface. J. Chem. Soc. Faraday Trans. 1:1807–1818. [Google Scholar]
- 31.Netz, R. R., and J.-F. Joanny. 1999. Adsorption of semiflexible polyelectrolytes on charged planar surfaces: charge compensation, charge reversal, and multilayer formation. Macromolecules. 32:9013–9025. [Google Scholar]
- 32.McQuarrie, D. A. 2000. Statistical Mechanics. University Science Books, Sausalito CA.
- 33.González-Mozuelos, P., and M. Olvera de la Cruz. 1995. Ion condensation in salt-free dilute polyelectrolyte solutions. J. Chem. Phys. 103:3145–3157. [Google Scholar]
- 34.Muthukumar, M. 2004. Theory of counter-ion condensation on flexible polyelectrolytes: adsorption mechanism. J. Chem. Phys. 120:9343–9350. [DOI] [PubMed] [Google Scholar]
- 35.Libera, J. A., H. Cheng, M. Olvera de la Cruz, and M. J. Bedzyk. 2005. Direct observation of cations and polynucleotides explains polyion adsorption to like-charged surfaces. J. Phys. Chem. B. 109:23001–23007. [DOI] [PubMed] [Google Scholar]
- 36.Thomson, N. H., S. Kasas, B. Smith, H. G. Hansma, and P. K. Hansma. 1996. Reversible binding of DNA to Mica for AFM imaging. Langmuir. 12:5905–5908. [Google Scholar]
- 37.González-Mozuelos, P., and M. Olvera de la Cruz. 2003. Association in electrolyte solution: rigid rod polyelectrolytes in multivalent salts. J. Chem. Phys. 118:4684–4691. [Google Scholar]
- 38.Manning, G. S. 1969. Limiting laws and counterion condensation in polyelectrolyte solutions I. Colligative properties. J. Chem. Phys. 51:924–933. [Google Scholar]
- 39.Rouzina, I., and V. A. Bloomfield. 1996. Macroion attraction due to electrostatic correlation between screening counterions. 1. Mobile surface-adsorbed ions and diffuse ion cloud. J. Phys. Chem. 100:9977–9989. [Google Scholar]
- 40.Koltover, I., K. Wagner, and C. R. Safinya. 2000. DNA condensation in two dimensions. Proc. Natl. Acad. Sci. USA. 97:14046–14051. [DOI] [PMC free article] [PubMed] [Google Scholar]
- 41.Netz, R. R. 2004. Water and ions at interfaces. Curr. Opin. Colloid Interface Sci. 9:192–197. [Google Scholar]
- 42.Feng, F., and I. Szleifer. 2001. Kinetics and thermodynamics of protein adsorption: A generalized molecular theoretical approach. Biophys. J. 80:2568–2589. [DOI] [PMC free article] [PubMed] [Google Scholar]
- 43.Fleck, C., R. R. Netz, and H. H. von Grünberg. 2002. Poisson-Boltzmann theory for membranes with mobile charged lipids and the pH-dependent interaction of a DNA molecule with a membrane. Biophys. J. 82:76–92. [DOI] [PMC free article] [PubMed] [Google Scholar]