Abstract
With the increase in the number of large, 3D, high-resolution nucleic acid structures, particularly of the 30S and 50S ribosomal subunits and the intact bacterial ribosome, advancements in the visualization of nucleic acid structural features are essential. Large molecular structures are complicated and detailed, and one goal of visualization software is to allow the user to simplify the display of some features and accent others. We describe an extension to the UCSF Chimera molecular visualization system for the purpose of displaying and highlighting nucleic acid characteristics, including a new representation of sugar pucker, several options for abstraction of base geometries that emphasize stacking and base pairing, and an adaptation of the ribbon backbone to accommodate the nucleic acid backbone. Molecules are displayed and manipulated interactively, allowing the user to change the representations as desired for small molecules, proteins and nucleic acids. This software is available as part of the UCSF Chimera molecular visualization system and thus is integrated with a suite of existing tools for molecular graphics.
INTRODUCTION
There has been an enormous increase in the size and number of deposited structures of nucleic acids in recent years, including high-resolution X-ray crystal structures of two riboswitches (1,2), two ribonuclease P structures (3,4), several ribozymes (5,6) and structures of multiple macromolecular-assemblages that include nucleic acids, such as the 30S (7) and 50S (8,9) ribosomal subunits, as well as the intact ribosome (10), and the nucleosome core particle (11,12). This growth is reflected in the increase of nucleic acid structures available from the Nucleic Acid Database (NDB) (13) and structure-related databases, such as the Structural Classification of RNA (SCOR) database (14), a classification of 3D structural motifs, with larger structures having many more motifs than smaller structures. SCOR doubled in the number of structures characterized between 2002 and 2004, and simultaneously increased by nearly 20-fold in the number of structural features characterized, from 423 internal and hairpin loops in version 1.1 to 8270 in version 2.0.3 (15).
The viewing of macromolecular structures is improved by the use of tools that highlight, or if needed, abstract the details, of molecular features. And while many visualization tools exist and representations are standardized for protein structures, these tools are often inadequate for the structural features of nucleic acids. It is a challenge of visualization methods to display and emphasize key concepts and features without overwhelming the viewer and while maintaining the accuracy of the data. For proteins, abstractions exist such as stylized ribbon representations of alpha helices and beta sheets accenting the different secondary structures and displaying the direction of the chain, and for displaying the backbone and side chains (16); however, these methods fall short for nucleic acids, where the structural features are quite different from proteins.
Here, we present a new tool for nucleic acid visualization that highlights the features of nucleic acids. We present a new representation to emphasize sugar pucker, a modification to the backbone ribbon for the nucleic acid backbone, and several options for displaying bases and their interactions, emphasizing base pairing and base stacking.
MATERIALS AND METHODS
UCSF Chimera (17) (henceforth referred to as ‘Chimera’) is a molecular graphics program designed to maximize interactive visualization and collaboration, that also allows users to easily write additional tools to extend its capabilities. Chimera is available free of charge to academic and non-profit users and is available on a wide array of platforms, including Microsoft Windows, Apple OS X and Linux. The nucleic acid visualization features presented here are an extension to the basic Chimera visualization system, and are currently available within the Chimera package and available from the Chimera web site (http://www.cgl.ucsf.edu/chimera/).
The new features available in the Nucleotides extension are discussed below, and examples of the features can be seen in Figures 2–7 and in the image gallery on the Chimera web site. All features are easily accessible via a menu interface within Chimera, as shown in Figure 1.
Figure 1.
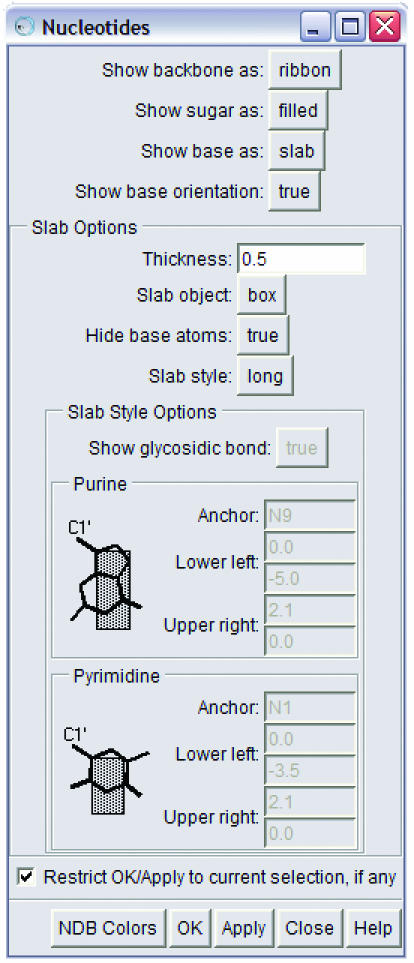
The Nucleotides menu for the nucleic acid visualization tool, showing the many options for the display of the backbone, sugars and bases. Chimera has separate menus for controlling the parameters used for coloring and for drawing ribbons. See http://www.cgl.ucsf.edu/chimera/docs/ContributedSoftware/nucleotides/nucleotides.html for a detailed description.
Representations of sugars
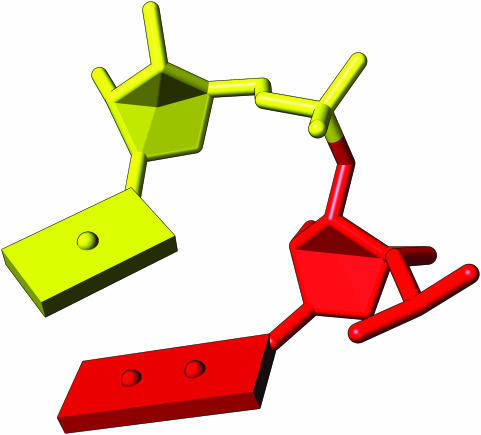
The furanose ring found in nucleic acids generally takes either the envelope form, with four atoms in a plane, or the twist form, with three atoms in a plane and two adjacent atoms on either side of that plane (18). We have created a new representation to emphasize the plane and twist forms of the ring. This representation is unique to the Chimera Nucleotides extension.
In order to elucidate sugar pucker, we fill the furanose ring by drawing either two or four planes. For the envelope form, a single atom is out of the plane, so we draw two planes: one defined by the four atoms in-plane, and a triangle that extends to the outlying atom. For the twist form, we emphasize the location of the twist by drawing one plane defined by the three atoms in-plane together with a fourth point located towards the twist of the ring and combine this with three triangles connecting the other atoms (Figure 2). The decision of when to consider atoms coplanar and thus which form to use when drawing a sugar is driven by geometric considerations only; in the future we plan to add an option so that the user can adjust the threshold for controlling this behavior. (Source code for the representation of sugars is available in the Supplementary Data.)
Figure 2.
Sugar pucker, in the envelope form (red) and twist form (yellow). The envelope form is highlighted using two planes, while the twist form is accented by the drawing of four planes, achieved by the introduction of a non-atom vertex.
Another abstraction of the sugar is as a tube that connects the base to the backbone (atoms or ribbon). The tube is drawn from the C4′ atom of the sugar to the N1 atom of the base for pyrimidines or N9 for purines. If the user chooses to display the glycosidic bond, then the tube terminates at the sugar C1′. Thus, the simplified connection of base to backbone can either by shown as a single cylinder (as in the G–C pairs in Figure 4) or as two cylinders broken at the C1′ (as in Figures 3 and 5).
Figure 3.
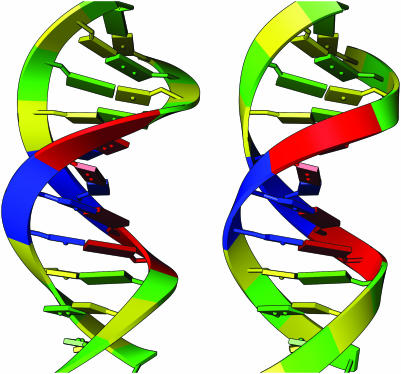
Backbone ribbon representations of B-form DNA (PDB identifier 1bna) (27). In the image on the left, the ribbon is drawn with the C1′ atom, located in the sugar, as the orientation atom and the plane of the ribbon along the sugar. The image on the right shows the new nucleic acid ribbon representation, with the ribbon axis rotated by 90°.
Figure 5.
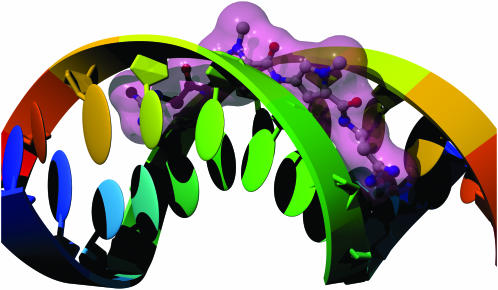
Netropsin bound to double-stranded DNA (28) (PDB identifier 6bna). Each strand of the DNA is colored with the ‘rainbow’ option, with the base colors changing over a range from blue to red from the 5′ to the 3′ end, respectively. The DNA is shown with the backbone represented as a smooth ribbon, the sugars drawn as elliptical tubes and the bases as ellipsoids. Netropsin is colored by element and shown in the ball-and-stick representation, with a transparent pink molecular surface.
Backbone ribbon
In order to more accurately represent the backbone of the nucleic acid, we modified the ribbon representation that is used for proteins. For proteins, we draw a ribbon with the backbone oxygen as the orientation atom, and the backbone alpha carbon as the guide atom, with the resulting ribbon perpendicular to the side chain. For nucleic acids, we choose C1′ as the orientation atom and C5′ as the guide atom, both located in the sugar. Similar to the method first described by Carson and Bugg (19), our ribbon representations are based on B-splines (20) with the coordinates of the guide atoms used as spline control points and the orientation atom used to determine the plane of the ribbon. But with the default approach used for proteins, the resulting ribbon was parallel to the base rather than perpendicular. We created a new option for ribbon representations for nucleic acids such that the ribbon axis is rotated by 90°, and the resulting backbone ribbon is perpendicular to the bases (Figure 3). The original representation of the ribbon remains available as the ‘classic ribbon’ option in the Nucleotides menu. Additional options to the ribbon, such as changing the cross-section of the ribbon, are available as a standard option within Chimera's Ribbon Style Editor menu and the color of the backbone ribbon is customizable by the user.
Bases
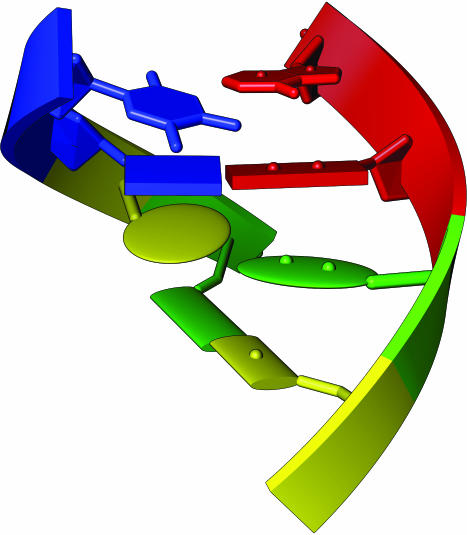
Base stacking is a key structural feature and is important for the stabilization of nucleic acids (18). Visual emphasis of this feature was one of the motivating factors for building the Nucleotides extension to Chimera. Four representations of bases are available: filled, box slab (or box), elliptical tube slab and ellipsoid slab. Examples are shown in Figure 4. In order to display the orientation of the base, each base is drawn with a rounded protuberance (a dot) at the center of each ring on the positive face [as described in Olson et al. (21)] of the base. The positive face of the base is defined by a coordinate frame such that, in an idealized right-handed A-form or B-form helix, the X-axis points toward the major groove, the Y-axis is parallel to a C1′–C1′ vector within paired bases, and the Z-axis points along the 5′–3′ direction. In the case of A- or B-form helices, dots appear on the 5′ side of the bases.
Figure 4.
Base representations, including, from top to bottom, filled rings, boxes, ellipsoids and elliptical tubes.
The filled base option simply fills the rings of the pyrimidines and purines. By selecting this option, the user preserves the purine versus pyrimidine identity of the base, but also emphasizes the position of the base by simply making the rings much more visible.
The slab options are designed to emphasize base pairing and stacking. With bases displayed in the box formation the ‘spiral stair case’ quality of a helix is much more prominent than with the filled or atom/bond representation (as shown in Figure 4). Several options for the position and size of the slab with respect to the base are available, as well as a custom setting, and these settings are easily obtained by the user through a simple interface. The default setting for the slab option draws the slab as a box, with the purine box anchored at the base N9 and the pyrimidine box anchored at the base N1. The default slab covers most of the base, and extends slightly beyond the base rings to emphasize base pairing. The user can also adjust the thickness of the box.
Additional representations of bases are displayed in Figure 4. These include the platter-like ellipsoid and the elliptical tube, which is elliptical in cross-section, along the axis of the π-orbitals of the base, but with the rings abstracted as squares or rectangles, much like the slab representation.
In addition to multiple representation of the bases, the Nucleotides extension also offers a quick way to color bases by the NDB convention (22) by selecting the ‘NDB Colors’ button, with yellow for C, red for A, green for G, cyan for U, and blue for T. Bases may also be colored using the Rainbow tool, varying in color from blue at the 5′ end to red at the 3′ end of a chain, and may be colored in numerous other ways, all standard within Chimera, including by atom, by residue and by chain. The backbone ribbon color can differ from the color of the base.
RESULTS
Several examples of our new representations of nucleic acids can be seen in Figures 5–7, for both DNA and RNA molecules and their complexes. (Refer to the figure captions for explanatory details.) The representations described here are easily created from menu- and command-line options within Chimera and the representations are drawn on-demand, quickly and interactively, and publication-quality figures can be generated from the interactive sessions.
Figure 7.
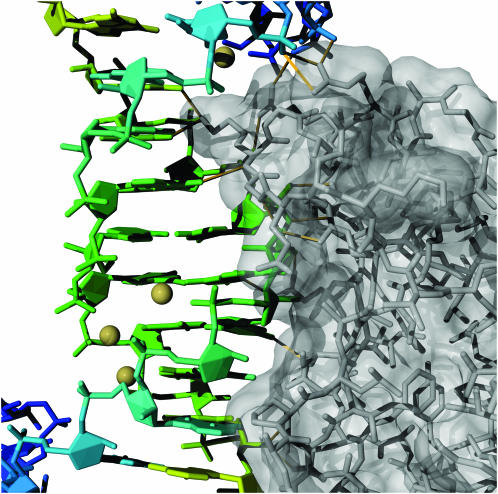
The Escherichia coli L25 ribosomal protein with 5S ribosomal RNA fragment (29) (PDB identifier 1dfu). Atomic interactions are highlighted between the RNA and the protein by filling the base and sugar rings and leaving the nucleic acid backbone fully represented. The protein is drawn in the stick representation, and the bound metal ions are in yellow. Hydrogen bonds between the RNA and protein were calculated by Chimera and are drawn in yellow.
DISCUSSION
This report describes a new set of tools for nucleic acid visualization that are packaged as extensions to the UCSF Chimera molecular visualization suite. The original goals of the extensions were to emphasize base stacking, rearrange the ribbon and attempt to create and extend the kinds of representations often seen in textbooks (23). The new representations for nucleic acids include filled bases, alternate representations of bases as slabs and ellipsoids, a modified ribbon backbone and a new representation of sugar geometry. While other approaches provide beautiful representations, e.g. the ribbon representations of nucleic acids available in the Ribbons (24) and DRAWNA (25) programs, and are integrated into existing, interactive software packages, such as the nuccyl extension (http://www.biosci.ki.se/groups/ljo/software/nuccyl.html) to PyMol (http://pymol.sourceforge.net/), our tools are unique in their representations of sugar pucker, base sidedness and ease of changing between alternative conventions. As part of UCSF Chimera, the Nucleotides extension is integrated with a mature, well-supported software suite and can easily be used in conjunction with Chimera's chemical knowledge (e.g. hydrogen bonding and atom typing) and multi-scale models (26) for large molecules (i.e. ribosomes, viruses, nucleosome core).
SUPPLEMENTARY DATA
Supplementary Data are available at NAR Online.
Supplementary Material
Figure 6.
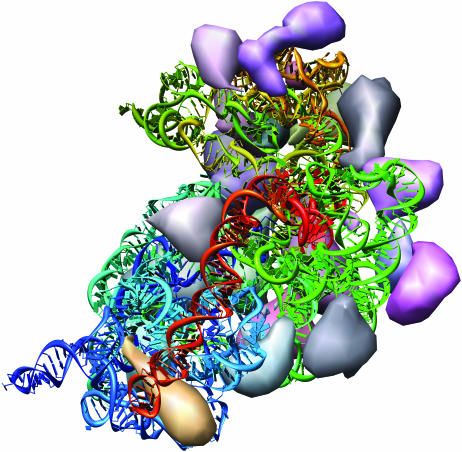
The Thermus thermophilus 30S ribosomal subunit (7) (PDB identifier 1j5e). Drawn with the Nucleotides extension and Chimera's MultiScale extension (26), the single-stranded RNA chain is colored with the rainbow option, and the proteins are shown as low-resolution surfaces. From this perspective, the helices appear to be formed from local interactions within the RNA, e.g. red bases pairing with other red bases and green bases pairing with other green bases. Tertiary interactions between the differently colored helices are highlighted as the different colored helices are brought together. Distinct from the other figures, the ribbon representation of the 16S ribosomal RNA has a rounded cross-section, and thus its smooth edges make the orientation of the ribbon less visible.
Acknowledgments
This work has been supported by NIH grants P41 RR001081 (to TE Ferrin) and R01 GM066199 (to SR Holbrook). The authors thank Nikolai B. Ulyanov for numerous helpful discussions, and Steven E. Brenner and Stephen R. Holbrook for their encouragement. Funding to pay the Open Access publication charges for this article was provided by NIH grant P41 RR001081.
Conflict of interest statement. None declared.
REFERENCES
- 1.Batey R.T., Gilbert S.D., Montange R.K. Structure of a natural guanine-responsive riboswitch complexed with the metabolite hypoxanthine. Nature. 2004;432:411–415. doi: 10.1038/nature03037. [DOI] [PubMed] [Google Scholar]
- 2.Serganov A., Yuan Y.R., Pikovskaya O., Polonskaia A., Malinina L., Phan A.T., Hobartner C., Micura R., Breaker R.R., Patel D.J. Structural basis for discriminative regulation of gene expression by adenine- and guanine-sensing mRNAs. Chem. Biol. 2004;11:1729–1741. doi: 10.1016/j.chembiol.2004.11.018. [DOI] [PMC free article] [PubMed] [Google Scholar]
- 3.Krasilnikov A.S., Yang X., Pan T., Mondragon A. Crystal structure of the specificity domain of ribonuclease P. Nature. 2003;421:760–764. doi: 10.1038/nature01386. [DOI] [PubMed] [Google Scholar]
- 4.Krasilnikov A.S., Xiao Y., Pan T., Mondragon A. Basis for structural diversity in homologous RNAs. Science. 2004;306:104–107. doi: 10.1126/science.1101489. [DOI] [PubMed] [Google Scholar]
- 5.Adams P.L., Stahley M.R., Kosek A.B., Wang J., Strobel S.A. Crystal structure of a self-splicing group I intron with both exons. Nature. 2004;430:45–50. doi: 10.1038/nature02642. [DOI] [PubMed] [Google Scholar]
- 6.Golden B.L., Kim H., Chase E. Crystal structure of a phage Twort group I ribozyme-product complex. Nature Struct. Mol. Biol. 2005;12:82–89. doi: 10.1038/nsmb868. [DOI] [PubMed] [Google Scholar]
- 7.Wimberly B.T., Brodersen D.E., Clemons W.M., Jr, Morgan-Warren R.J., Carter A.P., Vonrhein C., Hartsch T., Ramakrishnan V. Structure of the 30S ribosomal subunit. Nature. 2000;407:327–339. doi: 10.1038/35030006. [DOI] [PubMed] [Google Scholar]
- 8.Ban N., Nissen P., Hansen J., Moore P.B., Steitz T.A. The complete atomic structure of the large ribosomal subunit at 2.4 A resolution. Science. 2000;289:905–920. doi: 10.1126/science.289.5481.905. [DOI] [PubMed] [Google Scholar]
- 9.Harms J., Schluenzen F., Zarivach R., Bashan A., Gat S., Agmon I., Bartels H., Franceschi F., Yonath A. High resolution structure of the large ribosomal subunit from a mesophilic eubacterium. Cell. 2001;107:679–688. doi: 10.1016/s0092-8674(01)00546-3. [DOI] [PubMed] [Google Scholar]
- 10.Schuwirth B.S., Borovinskaya M.A., Hau C.W., Zhang W., Vila-Sanjurjo A., Holton J.M., Cate J.H. Structures of the bacterial ribosome at 3.5 A resolution. Science. 2005;310:827–834. doi: 10.1126/science.1117230. [DOI] [PubMed] [Google Scholar]
- 11.Luger K., Mader A.W., Richmond R.K., Sargent D.F., Richmond T.J. Crystal structure of the nucleosome core particle at 2.8 A resolution. Nature. 1997;389:251–260. doi: 10.1038/38444. [DOI] [PubMed] [Google Scholar]
- 12.Edayathumangalam R.S., Weyermann P., Gottesfeld J.M., Dervan P.B., Luger K. Molecular recognition of the nucleosomal ‘supergroove’. Proc. Natl Acad. Sci. USA. 2004;101:6864–6869. doi: 10.1073/pnas.0401743101. [DOI] [PMC free article] [PubMed] [Google Scholar]
- 13.Holbrook S.R. RNA structure: the long and the short of it. Curr. Opin. Struct. Biol. 2005;15:302–308. doi: 10.1016/j.sbi.2005.04.005. [DOI] [PMC free article] [PubMed] [Google Scholar]
- 14.Klosterman P.S., Tamura M., Holbrook S.R., Brenner S.E. SCOR: a Structural Classification of RNA database. Nucleic Acids Res. 2002;30:392–394. doi: 10.1093/nar/30.1.392. [DOI] [PMC free article] [PubMed] [Google Scholar]
- 15.Tamura M., Hendrix D.K., Klosterman P.S., Schimmelman N.R., Brenner S.E., Holbrook S.R. SCOR: Structural Classification of RNA, version 2.0. Nucleic Acids Res. 2004;32:D182–D184. doi: 10.1093/nar/gkh080. [DOI] [PMC free article] [PubMed] [Google Scholar]
- 16.Richardson J.S. The anatomy and taxonomy of protein structure. Adv. Protein Chem. 1981;34:167–339. doi: 10.1016/s0065-3233(08)60520-3. [DOI] [PubMed] [Google Scholar]
- 17.Pettersen E.F., Goddard T.D., Huang C.C., Couch G.S., Greenblatt D.M., Meng E.C., Ferrin T.E. UCSF Chimera—a visualization system for exploratory research and analysis. J. Comput. Chem. 2004;25:1605–1612. doi: 10.1002/jcc.20084. [DOI] [PubMed] [Google Scholar]
- 18.Saenger W. Principles of Nucleic Acid Structure. New York, NY: Springer-Verlag; 1983. [Google Scholar]
- 19.Carson M., Bugg C.E. Algorithm for ribbon models of proteins. J. Mol. Graph. 1986;4:121–122. [Google Scholar]
- 20.Foley J.D., van Dam A., Feiner S.K., Hughes J.F. Computer Graphics: Principles and Practice, 2nd edn. Reading, MA: Addison-Wesley; 1990. [Google Scholar]
- 21.Olson W.K., Bansal M., Burley S.K., Dickerson R.E., Gerstein M., Harvey S.C., Heinemann U., Lu X.J., Neidle S., Shakked Z., et al. A standard reference frame for the description of nucleic acid base-pair geometry. J. Mol. Biol. 2001;313:229–237. doi: 10.1006/jmbi.2001.4987. [DOI] [PubMed] [Google Scholar]
- 22.Lu X.J., Olson W.K. 3DNA: a software package for the analysis, rebuilding and visualization of three-dimensional nucleic acid structures. Nucleic Acids Res. 2003;31:5108–5121. doi: 10.1093/nar/gkg680. [DOI] [PMC free article] [PubMed] [Google Scholar]
- 23.Branden C.-I., Tooze J. Introduction to Protein Structure, 1st edn. Garland Publishing, Inc; 1991. [Google Scholar]
- 24.Carson M. Ribbons. In: Carter C.W. Jr, Sweet R.M., editors. Methods in Enzymology, Macromolecular Crystallography Part B. Vol. 277. Academic Press; 1997. pp. 493–502. [Google Scholar]
- 25.Massire C., Gaspin C., Westhof E. DRAWNA: a program for drawing schematic views of nucleic acids. J. Mol. Graph. 1994;12:201–206. doi: 10.1016/0263-7855(94)80088-x. 196. [DOI] [PubMed] [Google Scholar]
- 26.Goddard T.D., Huang C.C., Ferrin T.E. Software extensions to UCSF Chimera for interactive visualization of large molecular assemblies. Structure. 2005;13:473–482. doi: 10.1016/j.str.2005.01.006. [DOI] [PubMed] [Google Scholar]
- 27.Drew H.R., Wing R.M., Takano T., Broka C., Tanaka S., Itakura K., Dickerson R.E. Structure of a B-DNA dodecamer: conformation and dynamics. Proc. Natl Acad. Sci. USA. 1981;78:2179–2183. doi: 10.1073/pnas.78.4.2179. [DOI] [PMC free article] [PubMed] [Google Scholar]
- 28.Kopka M.L., Yoon C., Goodsell D., Pjura P., Dickerson R.E. Binding of an antitumor drug to DNA, Netropsin and C-G-C-G-A-A-T-T-BrC-G-C-G. J. Mol. Biol. 1985;183:553–563. doi: 10.1016/0022-2836(85)90171-8. [DOI] [PubMed] [Google Scholar]
- 29.Lu M., Steitz T.A. Structure of Escherichia coli ribosomal protein L25 complexed with a 5S rRNA fragment at 1.8-A resolution. Proc. Natl Acad. Sci. USA. 2000;97:2023–2028. doi: 10.1073/pnas.97.5.2023. [DOI] [PMC free article] [PubMed] [Google Scholar]
Associated Data
This section collects any data citations, data availability statements, or supplementary materials included in this article.


