

Abstract
We recently developed a sensitive method using biotin-N-maleimide (biotin-NM) as a probe to positively identify oxidized mitochondrial proteins. In this study, biotin-NM was used to identify oxidized cytosolic proteins in alcohol-fed mouse livers. Alcohol treatment for 6 weeks elevated the levels of CYP2E1 and nitrotyrosine, a marker of oxidative stress. Markedly increased levels of oxidized proteins were detected in alcohol-fed mouse livers compared to pair-fed controls. The biotin-NM-labeled oxidized proteins from alcohol-exposed mouse livers were subsequently purified with streptavidin-agarose and resolved on 2-DE. More than 90 silver-stained protein spots that displayed differential intensities on 2-D gels were identified by mass spectrometry. Peptide sequence analysis revealed that many enzymes or proteins involved in stress response, chaperone activity, intermediary metabolism, and antioxidant defense systems such as peroxiredoxin were oxidized after alcohol treatment. Smaller fragments of many proteins were repeatedly detected only in alcohol-fed mice, indicating that many oxidized proteins after alcohol exposure were degraded. Immunoblot results showed that the level of oxidized peroxiredoxin (inactivated) was markedly increased in the alcohol-exposed mouse livers and ethanol-sensitive hepatoma cells compared to the corresponding controls. Our results may explain the underlying mechanism for cellular dysfunction and increased susceptibility to other toxic agents following alcohol-mediated oxidative stress.
Keywords: Alcoholism, CYP2E1, Oxidative stress, Protein Oxidation, Protein Degradation, Peroxiredoxin
Abbreviations: Biotin-NM, biotin-N-maleimide; GAPDH, glyceraldehyde-3-phosphate dehydrogenase; GRP78, glucose regulated protein 78 kDa; FTHF-DH, formyltetrahydrofolate dehydrogenase; HRP, horse radish peroxidase; HSP, heat shock protein; iNOS, inducible nitric oxide synthase; MAb, monoclonal antibody; MAT: methionine S-adenosyltransferase; NEM, N-ethylmaleimide; PDI, protein disulfide isomerase; Prx, peroxiredoxin; Prx- SO3, oxidized-Prx; SAHH,S-adenosyl homocysteine hydrolase
1 Introduction
It is well established that heavy alcohol consumption for extended periods of time negatively affects physiological functions of many cells and may ultimately lead to various organ damage if not properly treated or managed [1-5]. The adverse effects and damage caused by alcohol alone or in combination with other factors can be partly attributed to reactive oxygen and nitrogen species (ROS/RNS) produced during and after alcohol exposure, because the severity of some damage can be alleviated by simultaneous treatment with various antioxidants especially at the early stages. The molecular mechanisms contributing to alcohol-mediated tissue damage has been investigated using several animal models including rodents [6] as well as cultured cells such as E47 HepG2 human hepatoma cells transduced with ethanol-induced CYP2E1 [7] and WIF-B hybrid cells [8]. Chronic alcohol exposure is known to induce various proteins/genes such as ethanol-inducible cytochrome P4502E1 (CYP2E1) [9,10], stress-related heat shock proteins [11], and inducible nitric oxide synthase (iNOS) [12 and our unpublished observations]. Alcohol is also known to directly inhibit the mitochondrial function especially at the levels of complex I and III [13], leading to greater production of ROS. Furthermore, ROS could be produced by xanthine oxidase [14] and NADPH oxidase [15,16] activated after alcohol treatment. For instance, CYP2E1 catalyzes the metabolisms of various small molecule substrates such as alcohol, acetone, benzene, pyridine, acetaminophen, nitrosamine derivatives, etc. [17,18]. ROS is produced during CYP2E1-mediated metabolism of the potentially toxic substrates [19] and even in the absence of its substrates [20]. Nitric oxide, produced through induction of iNOS, may contribute to increased nitrosative stress such as production of more toxic peroxynitrite anion (ONOO−) in the presence of ROS [21]. On the other hand, chronic alcohol exposure reduces the levels of cellular protectants such as glutathione and other antioxidants [1-5]. All these changes lead to markedly elevated oxidative and nitrosative stress which can negatively affect the target DNA, proteins, and lipids. Subsequently, following alcohol-mediated changes in these proteins, target cells or tissues undergo stressful conditions and become more vulnerable to the cellular damage especially in the presence of additional damaging factors such as pro-inflammatory cytokines, hepatitis viruses, drugs, and smoking. We hypothesized that ROS-mediated oxidation of certain cysteinyl residues of target proteins may negatively influence their physiological function, leading to increased susceptibility to other toxic substances resulting in more grave, irreversible organ damage. Despite the well established effect of alcohol on ROS/RNS production and cellular dysfunction with reduced energy metabolism [1-5], it is poorly understood which proteins are oxidized and whether their biological functions are altered. To address this problem, we have recently developed a sensitive method to positively identify oxidized proteins in the mitochondria from alcohol-exposed E47 HepG2 hepatoma cells and mouse liver [22]. The aim of this work was to extend our targeted proteomics approach to identify cytosolic proteins that are oxidized after alcohol exposure and study their functional alteration following oxidation of cysteinyl residues of target proteins.
2 Materials and Methods
2.1 Chemicals and other materials
Biotin-conjugated N-maleimide (biotin-NM), N-ethyl-maleimide (NEM), DTT, polyclonal antibodies to 3-nitrotyrosine, and agarose-conjugated monoclonal antibody against biotin (agarose-MAb-biotin) were obtained from Sigma Chemical (St. Louis, MO, USA) in highest purity. All tissue culture media including fetal bovine serum, antibiotics, horse radish peroxidase (HRP)-conjugated streptavidin, and streptavidin-agarose were purchased from Invitrogen (Carlsbad, CA, USA). Protease inhibitor cocktail was purchased from EMD Biosciences-Calbiochem (San Diego, CA, USA). Immobiline DryStrips (pH 3-10 and 4-7) and Sephadex G25 spin columns were obtained from Amersham Biosciences (Uppsala, Sweden). Specific antibodies to native peroxiredoxin (Prx) or hyperoxidized Prx-SO3 were kindly provided by Dr. Sue Goo Rhee (National Institutes of Health, Bethesda, MD, USA) [23,24]. Other materials not listed here were as described [22,25,26].
2.2 Animal maintenance and pair-feeding
Young male C57BL/6 mice from the NIH Small Animal Section (n = 4 per group) were maintained on a 12-h light-dark cycle in accordance with the NIH guideline for small animals. Individually housed mice were fed a Lieber-DeCarli alcohol liquid diet (with 35% daily calories derived from ethanol; Bio-Serv, Frenchtown, NJ, USA) for 6 weeks. Body weight and food consumption of each animal was measured every day. Based on the alcohol diet consumption, the same amounts of isocaloric dextrose control diet were provided to pair-fed control mice, as described [27,28].
2.3 Labeling of oxidized proteins with biotin-NM
All buffers used in this study were freshly pre-equilibrated with nitrogen gas for at least 30 min to remove dissolved oxygen. To prepare cytosolic fractions, each mouse liver freshly obtained from pair-fed control or alcohol-fed group (n = 4 per group) was rinsed with cold PBS to remove blood, homogenized with 3 volumes of STE buffer (250 mM sucrose, 50 mM Tris-Cl, pH 7.5, and 1 mM EDTA with protease inhibitor cocktails), and subjected to centrifugation for 105,000 × g for 30 min at 4 °C. After centrifugation, the supernatant fractions were carefully transferred to other tubes and used as cytosolic proteins. The pellets were resuspended in Tris-buffer (50 mM Tris-Cl, pH 7.5, 1 mM EDTA and protease inhibitors) and used as microsomal proteins. Concentration of the cytosolic and microsomal proteins was determined using the BioRad protein assay kit, as described previously [25]. Labeling of oxidized protein thiols with biotin-NM was performed using the method of Suh et al. [22] with the following modifications. Cytosolic proteins (10 mg/reaction) were incubated with 40 mM NEM for 20 min at room temperature to block reduced thiols. To remove excess NEM, the proteins were passed through Sephadex G25 mini-spin columns that had been equilibrated with the elution buffer (40 mM HEPES, 50 mM NaCl, 1 mM EDTA, 1 mM EGTA, protease inhibitors, pH 7.4). DTT was added to the protein eluates at a final concentration of 5 mM and the solution incubated for 20 min at room temperature to reduce the oxidized disufides and mixed sulfides. Aliquots of biotin-NM (2 M stock in DMSO) were added to the protein eluates at a final concentration of 6 mM. Excess biotin-NM was removed by passing the biotin-NM labeled protein mixture through a second Sephadex G25 mini-spin column pre-equilibrated with the elution buffer. Equal amounts of the biotin-NM labeled proteins were affinity purified with streptavidin-agarose beads. The biotinylated proteins were washed twice with the elution buffer with protease inhibitors and 1% CHAPS to remove any non-specifically bound proteins. The biotin-NM labeled proteins bound to the streptavidin-agarose beads were dissolved in Laemmli’s 1-D gel buffer or 2-D gel buffer (8 M urea, 20 mM DTT, 2% CHAPS, 0.5% IPG buffer, pH 3–10 or 4-7) 30 min before IEF on dry IPG strips (non-linear pH gradient of 3 – 10 or 4-7) at 50,000 Vh, as recommended by the manufacturer.
2.5 Cell lines and cell culture
E47 HepG2 human hepatoma cells with transduced human CYP2E1 [7] were kindly provided by Dr. Arthur I. Cederbaum (Mount Sinai Medical School, New York, NY, USA) and maintained as recently described [22]. When E47 HepG2 cells reached approximately 70% confluence, cells were exposed to 100 mM ethanol (freshly diluted in normal growth media) for indicated times. To prevent ethanol evaporation during exposure, each culture dish was tightly wrapped with Parafilm. After exposure to ethanol for the indicated times, E47 HepG2 cells were harvested by centrifugation at 2,500 × g for 5 min. The harvested cells were homogenized with the STE buffer and cytosolic fractions prepared by centrifugation at 15,000 × g for 20 min at 4 °C. The supernatant fractions were carefully transferred to other tubes and immediately subjected to biotin-NM labeling. Another batch of cytosolic fractions were rapidly frozen in dry ice and stored at −80 °C until used for immunoblot analysis.
2.6 Electrophoresis and immunoblot analyses
Purified biotin-NM labeled cytosolic proteins were dissolved in 1-D Laemmli buffer for immunoblot analysis using the specific antibody against each target protein as indicated in the text. The antigen detected by the primary antibody was visualized with the appropriate secondary antibody conjugated with HRP for enhanced chemiluminescence (ECL) detection, as described [25,26].
2.7 Analysis of 2D-PAGE protein bands by mass spectrometry and bioinformatics
Purified biotin-NM labeled proteins were analyzed by 2-D PAGE, which consisted of an initial IEF step (pH range of 3-10 or 4-7) followed by a gel electrophoresis separation on a 10% gel, and subsequent staining with Silver Stain Plus according to the manufacturer’s protocol. Each gel was scanned with a Molecular Dynamics Personal Densitomer SI and analyzed with ImageQuant software (Amersham Biosciences). Protein spots of interest (increased intensity after alcohol exposure) were excised from the gels using a razor blade and quickly frozen in dry ice until further MS analysis. In-gel digestion of silver-stained protein gel spots, microcapillary reversed-phase (μRPLC) – tandem mass spectrometry (Ms/MS) and bioinformatic analyses were performed as described recently [22,29,30].
3 Results
3.1 Increased levels of CYP2E1 and nitro-tyrosine in alcohol-fed mouse liver
To demonstrate increased oxidative stress in our tissue samples after alcohol exposure, we determined that the levels of nitro-tyrosine (3-NT) served as a marker for oxidative stress. Microsomal proteins from alcohol-fed mice and pair-fed control mice were separated on 1-D polyacrylamide gels and stained with Coomassie blue to verify that similar amounts of protein were used for each lane (Fig. 1A, top). Consistent with previous results [27,28], the hepatic levels of CYP2E1 (Fig. 1A, bottom) were markedly increased in alcohol-fed mouse. The amount of 3-NT in the cytoplasm (Fig. 1B, top) determined by immunoblot analysis was significantly higher in alcohol-fed mice compared to pair-fed control animals, while the amount of actin was similar in all samples examined (Fig. 1B, bottom).
Figure 1.

Increased levels of CYP2E1 and 3-nitrotyrosine in alcohol-fed mouse liver. (A) Equal amounts of microsomal proteins (10 μg/well) from the livers of control mice or alcohol-fed mice for 6 weeks (n = 2 per lane) were separated on 10% SDS-PAGE, transferred to PVDF-Immobilon membranes, and stained with Coomassie blue (top) or subjected to immunoblot analysis by using anti-CYP2E1 antibody (bottom). The CYP2E1 protein band is indicated with an arrow. (B) Equal amounts (15 μg/lane) of freshly isolated cytosolic proteins from the same set of mouse livers were separated on 10% SDS-PAGE and subjected to immunoblot analyses using specific antibodies against 3-nitrotyrosine (3-NT) (top) or β-actin (bottom). Specific protein bands recognized by the antibodies against 3-NT are designated with arrows. This figure represents a typical result from two separate experiments.
Immunoblot analysis was performed to determine the levels of biotin-NM labeled oxidized proteins using streptavidin-HRP as a probe. A typical pattern of biotin-NM labeled oxidized proteins in pair-fed control and alcohol-fed mice is shown in Figure 2A. Only a small number of proteins in the pair-fed control mice appear to be oxidized and thus recognized by streptavidin-HRP (Fig. 2A, lanes 1 and 2). However, the intensity and the number of oxidized proteins detected by streptavidin-HRP (Fig. 2A, lanes 3 and 4) were greatly increased in alcohol-fed mouse liver. Similar results showing increased levels of biotin-NM labeled proteins were also observed in ethanol-sensitive E47 HepG2 cells detected with MAb-biotin-HRP (Fig. 2B). These results indicate that ethanol exposure causes oxidation of various cytosolic proteins that were efficiently labeled with biotin-NM in both mouse livers and cultured E47 HepG2 cells.
Figure 2.

Increased oxidation of cytosolic proteins in alcohol-fed mouse liver and E47 HepG2 cells. (A) Purified biotin-NM labeled cytosolic proteins (20 μg/well, n = 2 per lane) from pair-fed control and ethanol-fed mice for 6 weeks were separated on 10% SDS-PAGE, transferred to PVDF-Immobilon membranes, and subjected to immunoblot analysis using streptavidin-HRP. (B) Biotin-NM labeled cytosolic proteins from untreated and E47 HepG2 cells treated with 100 mM ethanol for 8 h were analyzed by immunoblot analysis using MAb-biotin-HRP. (B) This figure represents a typical result from two separate experiments.
3.2 Increased oxidation of cytosolic proteins after alcohol exposure
Because of the increased oxidation of cytosolic proteins after alcohol exposure, we sought to identify each protein through labeling with biotin-NM, purification by streptavidin-agarose, separation by 2-DE, and MS protein identification. Typical patterns of 2-D gels (pH range 3 – 10) of the oxidized cytosolic proteins isolated from pair-fed control or alcohol-fed mice are shown in Figure 3. Several oxidized proteins labeled with biotin-NM were detected in the pair-fed control mouse livers (Fig. 3A). This result may be due to ROS generated from constitutively expressed hepatic CYP2E1 even in the absence of its substrates [20] and ROS spontaneously released from mitochondria even in untreated tissue [31]. To compare the relative intensities of oxidized protein spots in different 2-D gels, the intensity of the darkest spot (spot 21 designated with a square) in the control sample (Fig. 3A) was matched to that of the same protein spot in the 2-D gel for the ethanol-exposed group (Fig. 3B). Under these conditions, the number of labeled proteins and the intensities of many spots in alcohol-fed group were markedly increased compared to those of pair-fed control, although the intensities of a few spots were unchanged or showed a reduction in the alcohol-exposed sample. In addition, many proteins were not separated into individual isolated spots but remained as aggregated bands in the acidic pI range (range 5 - 6). For the purpose of protein identification, 55 spots with increased intensities were picked up from this particular gel (Fig. 3C) and subjected to further MS analysis.
Figure 3.
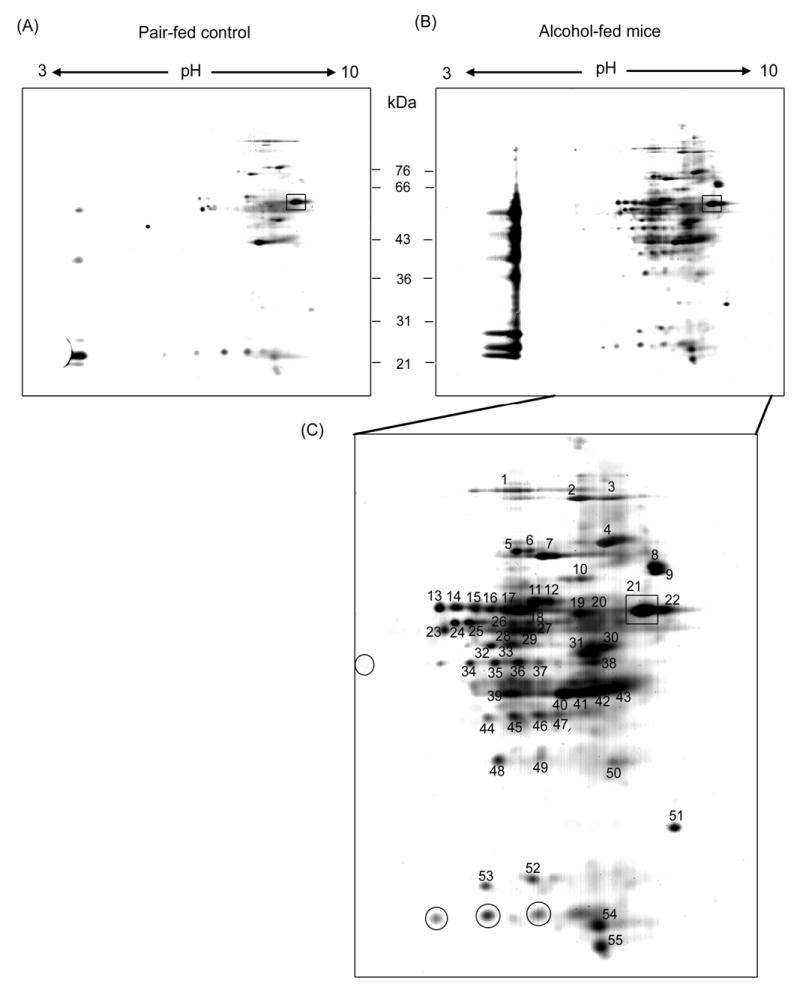
Separation of biotin-NM labeled cytosolic proteins from mouse livers by 2-DE. Biotin-NM labeled cytosolic proteins from pair-fed control (A) and alcohol-fed mouse livers (B) were purified with streptavidin-agarose, resolved by 2-DE gels, and silver stained. Individual protein spots (spot 1-55) with differential intensities were marked with different numbers, excised out of this particular gel (pH range 3 - 10), and subjected to MS analysis following in-gel trypsin digestion. Spot 21, designated with a square, was used as an internal standard for comparison purpose between the two different gels for pair-fed control and alcohol-fed mouse livers. Protein spots with similar or decreased intensities after alcohol exposure are designated with circles in Fig. 3C.
To resolve the aggregated proteins in the acidic pH range and verify their identities, we re-analyzed the same set of cytosolic proteins on 2-D gels using a different pH range (4 – 7). Consistent with the data shown in Fig. 3, a small number of oxidized proteins were detected in the pair-fed control livers (Fig. 4A). The number and spot intensities of biotin-NM labeled proteins were markedly increased in alcohol-fed mouse livers (Fig. 4B), when the intensity of the darkest spot (spot 88 designated with a square) in control samples was matched with that of the same protein in alcohol-treated samples. Some of the proteins, well separated on alkaline pH range in Fig. 3, aggregated in the pH region between 6 and 7. Despite the aggregation problems, 37 individual spots with increased intensities after alcohol exposure (Fig. 4C) were selected for MS identification.
Figure 4.

Separation of biotin-NM labeled cytosolic proteins from mouse livers on 2-DE. Another batch of biotin-NM labeled cytosolic proteins was purified streptavidin-agarose, resolved on 2-DE, and silver stained. Clearly separated protein spots (spot 56 - 92) were excised out of this particular gel (pH range 4 - 7) and subjected to MS analysis following in-gel trypsin digestion. Spot 88, designated with a square, was used as an internal standard for comparison purpose between the two different gels.
3.3 Summary of protein sequencing analyses
Protein spots excised from the 2-D gels (Figs. 3C and 4C), were in-gel digested with trypsin, and the extracted peptides analyzed by μRPLC-MS/MS. The results of the MS analyses for the oxidized proteins are summarized in Table 1. The peptide sequence analyses unequivocally established that many proteins that function as molecular chaperones [glucose regulated protein precursor 78 kDa (GRP78), heat shock protein 90 (Hsp90), GRP75, Hsp70, Hsp60], protein folding and structural proteins [protein disulfide isomerase (PDI), cytokeratin isoforms, and actin], and antioxidant defensive enzymes [catalase (EC 1.11.1.6), and peroxiredoxin 1/4 (EC 1.11.1.15, Prx 1/4)] are oxidized by alcohol exposure. In addition, many enzymes involved in intermediary metabolism such as the folate biosynthesis and the transmethylation-transsulfuration pathway [formyltetrahydrofolate dehydrogenase (EC 1.5.1.6, FTHF-DH), methionine adenosyl transferase (EC 2.5.1.6, MAT), and S-adenosyl homocysteine hydrolase (EC 3.3.1.1, SAHH)] and carbohydrate/energy metabolism [glyceraldehyde-3-phosphate dehydrogenase (EC 1.2.1.12, GAPDH), phosphoglucomutase (EC 5.4.2.2)] were oxidized after chronic ethanol treatment. Our results also indicate that a few mitochondrial or nuclear proteins, present as minor contaminants in this particular cytosolic preparation, were also oxidized by ethanol-mediated ROS (Table 1).
Table 1.
Summary of LC-MS/MS peptide sequence analyses for protein identification.
| Spot No. | Protein Identified | Pept. ID.ed | Expected Mass/pI | Observed Mass/pI | Accession No. |
|---|---|---|---|---|---|
| 1 | Formyltetrahydrofolate-dehydrogenase* | 2 | 98/5.6 | 84/7.3 | O75891 |
| 2 | ATPase, endoplamic reticulum | 6 | 89/5.1 | 82/7.9 | P55072 |
| 3 | Serum albumin precursor | 8 | 69/5.9 | 82/8.3 | P02768 |
| 4 | Glucose regulated protein precursor 78 kDa | 19 | 72/5.1 | 76/8.2 | P11021 |
| 5 | Glucose regulated protein precursor 75 kDa | 6 | 74/5.9 | 74/7.4 | P38646 |
| 6 | Serotransferrin precursor (Transferrin) | 2 | 77/6.8 | 74/7.5 | P02787 |
| 7 | Heat shock protein 71 | 9 | 71/5.4 | 73/7.7 | P11142 |
| Heat shock protein 70* | 3 | 70/5.6 | 73/7.7 | P54652 | |
| 8 | Serum albumin precursor | 1 | 69/5.9 | 71/8.7 | P02768 |
| 9 | Ubiquilin 1 | 3 | 62/5.0 | 70/8.7 | Q9UMX0 |
| 10 | Alpha-actin 2* | 3 | 42/5.2 | 66/8.0 | P62736 |
| 11 | Ubiquilin 1 | 1 | 62/5.0 | 60/7.5 | Q9UMX0 |
| 12 | Heat shock protein 60 | 2 | 61/5.7 | 60/7.6 | P10809 |
| 13 | Protein disulfide isomerase A3 precursor* | 3 | 57/6.0 | 59/6.6 | P30101 |
| 14 | Catalase* | 1 | 60/6.9 | 59/6.7 | P04040 |
| 15 | Protein disulfide isomerase A3 precursor* | 3 | 57/6.0 | 59/6.9 | P30101 |
| 16 | Catalase* | 1 | 60/6.9 | 59/7.1 | P04040 |
| 17 | Prolyl 4-hydroxylase beta subunit (PDI)* | 3 | 57/4.8 | 59/7.3 | P07237 |
| 18 | Cytokeratin 1 | 3 | 66/8.1 | 59/7.4 | P04264 |
| 19 | Serum Albumin precursor | 1 | 69/5.9 | 58/7.9 | P02768 |
| 20 | Prolyl 4-hydroxylase beta subunit (PDI)* | 1 | 57/4.8 | 58/8.0 | P07237 |
| 21 | Prolyl 4-hydroxylase beta subunit (PDI)* | 15 | 57/4.8 | 58/8.6 | P07237 |
| 22 | Arachidonate 12-lipoxygenase | 1 | 76/5.8 | 58/8.8 | P18054 |
| 23 | Thioredoxin* | 1 | 12/4.8 | 54/6.6 | P10599 |
| 24 | Serum albumin precursor | 1 | 69/5.9 | 55/6.7 | P02768 |
| 25 | Tryptophan/serine protease | 1 | 55/6.9 | Q6UWB4 | |
| 26 | Cytokeratin 10 | 5 | 59/5.1 | 55/7.4 | P13645 |
| 27 | Trypsin I precursor (Trypsinogen) | 1 | 27/6.1 | 55/7.5 | P07477 |
| 28 | Selenium binding protein* | 1 | 52/6.1 | 54/7.4 | Q13228 |
| 29 | UDP-glucose-pyrophosphorylase 1 | 2 | 57/7.7 | 57/7.7 | Q07131 |
| 30 | 26S Protease regulatory subunit 6A | 1 | 49/5.1 | 52/8.2 | P17980 |
| 31 | Dynactin complex 50 kDa subunit | 2 | 44/5.1 | 51/8.0 | Q13561 |
| 32 | Protein disulfide isomerase A6 precursor* | 2 | 48/5.0 | 52/7.1 | Q15084 |
| 33 | Argininosuccinate lyase* | 1 | 52/6.5 | 52/7.3 | P04424 |
| 34 | Cytokeratin 9 | 3 | 61/5.1 | 50/6.8 | P35527 |
| 35 | Cytokeratin 10 | 2 | 59/5.1 | 50.7.1 | P13645 |
| 36 | Cytokeratin 10 | 2 | 59/5.1 | 50/7.3 | P13645 |
| 37 | Cytokeratin 10 | 2 | 59/5.1 | 50/7.6 | P13645 |
| 38 | Methionine S-adenosyltransferase* | 1 | 43/5.9 | 50/8.1 | Q00266 |
| 39 | Alpha-actin 2* | 3 | 42/5.2 | 44/7.3 | P62736 |
| 40 | Alpha-actin 2* | 3 | 42/5.2 | 42/7.9 | P62736 |
| 41 | Beta-actin* | 3 | 42/5.3 | 42/8.0 | P60709 |
| 42 | Cytokeratin 9 | 2 | 62/5.1 | 43/8.1 | P35527 |
| 43 | S-Adenosyl homocysteine hydrolase* | 1 | 48/5.9 | 43/8.3 | P23526 |
| 44 | Vitamin D-binding protein precursor | 1 | 53/5.4 | 41/7.0 | P02774 |
| 45 | Cytokeratins 9 and 10 | 11 | 62/5.1 | 41/7.3 | P35527 |
| 46 | Cytokeratins 1 and 2 | 11 | 66//8.1 | 41.7.6 | P35908 |
| 47 | Calcium binding protein 39-like | 1 | 39/8.5 | 41/7.8 | Q9H9S4 |
| 48 | Serotransferrin precursor (Transferrin) | 1 | 77/6.8 | 37.7.2 | P02787 |
| 49 | Glyceraldehyde-3-phosphate dehydrogenase | 1 | 36/6.6 | 38/7.6 | P00354 |
| 50 | Serotransferrin precursor (Transferrin) | 1 | 77/6.8 | 37/8.3 | P02787 |
| 51 | Serum albumin precursor | 2 | 69/5.9 | 33/8.8 | P02768 |
| 52 | Serum albumin precursor | 3 | 69/5.9 | 31/7.5 | P02768 |
| 53 | Serotransferrin precursor (Transferrin) | 1 | 77/6.8 | 31/7.0 | P02787 |
| 54 | Cytokeratin 1 | 3 | 66/8.1 | 23/8.1 | P04264 |
| 55 | Peroxiredoxin 1* | 2 | 22/8.3 | 22/8.3 | Q13162 |
| 56 | Prolyl 4-hydroxylase beta subunit (PDI)* | 2 | 57/4.8 | 57/4.8 | P07237 |
| 57 | Prolyl 4-hydroxylase beta subunit (PDI)* | 1 | 57/4.8 | 53/5.1 | P07237 |
| 58 | Phosphoglucomutase* | 1 | 61/6.3 | 53/5.0 | P36871 |
| 59 | Catalase* | 1 | 60/6.9 | 53/5.2 | P04040 |
| 60 | Serum albumin precursor | 2 | 69/5.9 | 43/5.0 | P02787 |
| 61 | Catalase* | 1 | 60/6.9 | 43/5.2 | P04040 |
| 62 | Glucose regulated protein precursor 78 kDa | 1 | 72/5.1 | 40/4.6 | P11021 |
| 63 | Prolyl 4-hydroxylase beta subunit (PDI)* | 2 | 57/4.8 | 36/4.7 | P07237 |
| 64 | Prolyl 4-hydroxylase beta subunit (PDI)* | 2 | 57/4.8 | 35/4.8 | P07237 |
| 65 | Cytokeratin 9 | 6 | 62/5.1 | 32/4.7 | P35527 |
| 66 | Cytokeratin 1 | 10 | 66/8.1 | 32/4.9 | P04264 |
| 67 | Prolyl 4-hydroxylase beta subunit (PDI)* | 4 | 57/4.8 | 30/4.5 | P07237 |
| 68 | Glucose regulated protein precursor 78 kDa | 2 | 72/5.1 | 30/5.0 | P11021 |
| 69 | Alpha-actin 2* | 2 | 42/5.2 | 29/5.3 | P62736 |
| 70 | Calcium binding protein 39-like | 1 | 39/8.5 | 29/5.4 | Q9H9S4 |
| 71 | Serum albumin precursor | 3 | 69/5.9 | 27/4.6 | P02768 |
| 72 | Glucose regulated protein precursor 78 kDa | 2 | 72/5.1 | 27/4.8 | P11021 |
| 73 | Alpha-actin 2* | 2 | 42/5.2 | 26.5.2 | P62736 |
| 74 | Formyltetrahydrofolate-dehydrogenase* | 1 | 98/5.63 | 26.5.3 | O75891 |
| 75 | S-Adenosyl homocysteine hydrolase* | 1 | 48/5.9 | 26/5.5 | P23526 |
| 76 | Cytokeratin 14 and 16 | 6 | 52/5.1 | 26/5.1 | P02533 |
| 77 | Peroxiredoxin 1/4* | 2 | 30/5.9 | 25/5.1 | Q13162 |
| 78 | Cytokeratin 10 | 2 | 59/5.1 | 24/5.0 | P13645 |
| 79 | Serum albumin precursor | 5 | 69/5.9 | 21/4.7 | P02768 |
| 80 | Transcription elongation factor B | 1 | 12/4.7 | 21/4.8 | Q15369 |
| 81 | Prolyl 4-hydroxylase beta subunit | 1 | 57/4.8 | 21/4.9 | P07237 |
| 82 | Beta-actin* | 1 | 42/5.3 | 18/4.9 | P60709 |
| 83 | Glucose regulated protein precursor 78 kDa | 3 | 72/5.1 | 17/4.8 | P11021 |
| 84 | Calcium binding protein 39-like | 1 | 39/8.5 | 17/5.1 | Q9H9S4 |
| 85 | Retinol Dehydrogenase 10 (RDH10) | 1 | 12/4.7 | 13/5.0 | Q8IZV5 |
| 86 | Cytokeratins 1 and 10 | 5 | 66/8.1 | 12/4.9 | P04264 |
| 87 | Alpha-actin 2* | 1 | 42/5.2 | 12/4.7 | P62736 |
| 88 | Serum albumin precursor | 1 | 69/5.9 | 12/4.9 | P02768 |
| 89 | Serum albumin precursor | 1 | 69/5.9 | 12/5.1 | P02768 |
| 90 | Cytokeratins 1 and 10 | 8 | 66/8.1 | 12/4.6 | P04264 |
| 91 | Cytokeratin 10 | 1 | 59/5.1 | 11/4.9 | P13645 |
| 92 | Cytokeratin 10 | 1 | 59/5.1 | 11/4.8 | P13645 |
The presence of certain proteins present in small quantities might have been missed due to their very low abundance on the 2-D gels and contamination with other proteins that are present in large quantities. Despite small number of peptides identified for some proteins, we are confident that those peptides that were identified by MS analysis represent the peptide sequences of listed proteins. The presence of the proteins marked with asterisks was also confirmed by MS analysis of Coomassie blue-stained 1-D gel pieces (as Supplemental Table 1), as described in the text.
Peptide sequencing results also reveal that observed molecular weights and pI values of many proteins do not match well to those of the calculated values (Table 1). These differences could result from random or uneven degradations of proteins to smaller fragments and potential post-translational modifications of certain proteins. In fact, many proteins such as catalase, PDI A3 precursor, prolyl 4-hydroxyase, cytokeratins, and actin, exhibited different pI values with little changes in their molecular weights on 2-D gels, suggesting potential post-translational modifications of these proteins. We also observed that molecular weights of some proteins such as α-actin (spot 10) and thioredoxin (spot 23) turned out to be larger than their expected sizes, suggesting potential aggregation or cross-linking products of these proteins following oxidation. Furthermore, smaller fragments of various proteins including FTDF-DH, GRP78, Hsp70, serum albumin precursor, ubiquilin 1, catalase, Hsp60, PDI, serotransferrin precursor, cytokeratins, SAHH, actin, and Prx were repeatedly detected over many spots in alcohol-fed mice but not in pair-fed control mice (Table 1). These results strongly suggest increased degradation of these proteins after oxidation following alcohol exposure.
To confirm the presence of those proteins that were identified by only one or two peptides (Table 1), additional peptide sequence analysis was performed on Coomassie-stained protein bands separated on 1-D gels following the method of Lin et al. [32] after purification of biotin-NM labeled proteins from alcohol-fed mouse liver (data not shown: available in Supplemental Table 1). The oxidized proteins verified by this analysis were: FTHF-DH, Hsp70, phosphoglucomutase, catalase, selenium binding protein, arginosuccinate lyase, MAT, SAHH, α- and β-actins, GAPDH, Prx, retinol dehydrogenase, and thioredoxin. These proteins were identified with multiple peptides and are consistent with the corresponding proteins listed in Table 1. Therefore, this additional peptide analysis supports the presence of various oxidized proteins despite the small numbers of peptide hits in the initial MS analysis of the silver stained spots. From the peptide analysis on the Coomassie stained bands, we also detected the presence of several other cytosolic proteins not listed in Table 1. These proteins are: aldehyde dehydrogenase 1 and 4, glutathione S-transferases pi and mu, fructose 1,6-biphosphatase, aldolase 2, alpha-keto reductase, nucleoside-diphosphate kinase 2, transketolase, methionine sulfoxide reductase, α-enolase, UDP-glucose dehydrogense, elongation factor 1-α, pyruvate kinase liver isoform, phosphoglycerate kinase, cystathionine β-synthase, glycine N-methyltransferase, betaine-homocysteine methyltransferase, and hemoglobin alpha and beta. It is likely that we were unable to detect these proteins in the original analysis because these proteins existed in small quantities in the silver-stained gels. Alternatively, we might have simply missed many other spots from the 2-D gels, as shown in Figures 3C and 4C.
3.4 Inactivation of peroxiredoxin following oxidation in alcohol-fed mice and E47 HepG2 cells
Among the many oxidized cytosolic proteins we identified, Prx was chosen to test our hypothesis that the oxidation of critical cysteine residues of target proteins leads to their inactivation. As shown in Fig. 5A, the levels of total Prx in control and alcohol-fed mouse livers were similar in all samples analyzed. However, the inactive form of Prx, recognized by the anti-Prx-SO3 antibody which recognizes both sulfinic and sulfonic forms of Prx [24,25], was not detected in the control but it was readily detected in the alcohol-fed mice, suggesting oxidation and inactivation of Prx by alcohol-mediated oxidative stress.
Figure 5.

Inactivation of peroxiredoxin through oxidation after alcohol exposure. (A) Equal amounts (20 μg/well) of cytosolic proteins from pair-fed control and alcohol-fed mice were separated on 12% SDS-polyacrylamide gel and subjected to immunoblot analysis using a specific antibody which recognizes either oxidized Prx-SO3 (inactive form) or Prx (total). (B) Equal amounts (20 μg/well) of cytosolic proteins from E47 HepG2 cells untreated or treated with 100 mM ethanol for indicated times were subjected to immunoblot analysis using specific antibodies to Prx-SO3 or Prx. This figure represents a typical result from three separate experiments.
Because of increased levels of inactive, oxidized Prx detected in alcohol-fed mouse livers, we also determined whether Prx can be oxidized in ethanol-sensitive E47 HepG2 hepatoma cells after ethanol was incubated for different times. The levels of total Prx were similar in all samples tested. In untreated cytosol, the level of oxidized Prx was very low and undetectable. However, even after 2 h incubation with ethanol, oxidized Prx was recognized with the specific antibodies (Fig. 5, top panel). Alcohol-mediated oxidation of Prx was persistent and hyperoxidized Prx (Prx-SO3) remained elevated up to 48 h after ethanol exposure. In this case, ethanol may also inhibit the function of sulfiredoxin, which usually restores Prx function [24]. Another result with anti-oxidized Prx antibody showed that this protein is oxidized within 60 min of alcohol exposure, which may contribute to the increased peroxide levels in E47 HepG2 cells as well as mouse liver exposed to alcohol.
4 Discussion
It is well established that chronic alcohol exposure for extended periods results in adverse conditions with increased susceptibility toward many disease states partly through increased oxidative and nitrosative stress [1-5]. In addition to increased levels of ROS/RNS production through various mechanisms, alcohol is known to reduce the levels of cellular antioxidants such as glutathione, S-adenosylmethionine and tocopherol [1-5]. Recent studies showed that chronic administration of alcohol alone or in combination with a folate-deficient diet causes significant reduction of various enzymes involved in the transmethylation and transsulfuration pathways [33,34]. Alcohol alone can reduce the activities of SAHH [34] and methionine synthase [35]. In addition, significantly decreased activities of MAT were observed in cirrhotic patients [36]. Despite these reports about alcohol-mediated alterations of the enzymes involved in the transmethylation and transsulfuration pathways [33-36], there is little information about direct evidence of oxidation and subsequent inactivation of oxidized proteins after alcohol treatment. In order to elucidate the uncertain mechanistic aspects of enzyme inhibition, we have recently developed a sensitive method to positively identify oxidized proteins. This method was successfully used to identify oxidized mitochondrial proteins in ethanol-exposed E47 HepG2 hepatoma cells and alcohol-fed mouse livers. In this report, we extended our effort to identify cytosolic proteins that are oxidized under alcohol-mediated oxidative stress, as demonstrated by elevated levels of 3-NT and CYP2E1. Our results clearly showed that chronic ethanol treatment caused oxidation of many proteins based on greatly increased numbers and intensities of biotin-NM labeled oxidized proteins in alcohol-exposed samples (mouse livers and hepatoma cells) than their control counterparts.
Stadtman and coworkers have reviewed that many amino acids such as cysteine, methionine, histidine, lysine, tyrosine, and other amino acids can be oxidized [37]. Oxidation of these amino acids in many enzymes usually leads to irreversible inactivation of their catalytic activities, although some oxidized cysteines (i.e. disulfide and sulfenic acid) and methionine-sulfoxide can be reduced to cysteine and methoinine, respectively, under proper conditions [37,38]. The aggregated degradation products or crosslinked proteins were also observed in human and animal tissues especially after aging [39,40] and human alcoholics or alcohol-fed animals [41,42]. In addition, oxidized proteins become spontaneously degraded or more sensitive to proteolytic degradation as demonstrated in various model systems [43-45]. Despite the possibilities of oxidative modifications of many other amino acids under alcohol-mediated oxidative stress, we only concentrated on oxidation of cysteine residue because biotin-NM is a specific reagent that interacts with the reduced cysteine. Our method of labeling oxidized protein cysteines with biotin-NM is likely to detect various forms of oxidized cysteine residues such as intramolecular or intermolecular disulfides, mixed disulfides with glutathione, nitrosylated cysteines and protein sulfenic acids [46], because these oxidatively modified cysteine residues can be efficiently reduced to -SH groups in the presence of reducing agents such as glutathione, thioredoxin, and DTT (used in our study) and thus labeled by biotin-NM [22]. Oxidation of protein thiols detected in the current study may be related to the reversible cycles between disulfides and reduced thiols during their catalytic reactions, as exemplified with Prx [23,24]. Alternatively, oxidation of some protein thiols may represent actual inactivation of their enzyme activities through peroxynitrite-mediated nitrosylation of their cysteine residues, as demonstrated with MAT [47], and GAPDH [48] under oxidative/nitrosative stress. It is possible that inactivation of other proteins may also be facilitated by concomitant oxidation of other critical amino acids such as methionine and histidine in addition to the cysteine residues [37]. Furthermore, our current results with repeated detection of smaller fragments of various proteins such as FTHF-DH, GRP78, transferrin, albumin, catalase, Hsp60, PDI, actin, and Prx detected in alcohol-fed mice provide direct evidence that alcohol-mediated oxidized proteins are more susceptible to degradation. Since the corresponding protein spots of these protein fragments were either absent or present in very low quantities in pair-fed control mice, these results clearly show that oxidized proteins, labeled by biotin-NM and confirmed by MS analysis, are more susceptible to spontaneous or enzymatic degradation. Similarly, degraded fragments of mitochondrial proteins were also detected in our recent study with alcohol-exposed E47 HepG2 cells [22]. Taken together, to our knowledge, our results represent the first report about increased degradation of many oxidized proteins in mammalian tissues under alcohol-mediated oxidative stress. The questions regarding whether degraded fragments of oxidized proteins are accumulated in the cells and thus negatively affect cellular functions are not known and warrant further investigation.
Oxidized proteins are known to be preferentially degraded by non-lysosomal proteasomes [49,50]. However, chronic alcohol treatment significantly inhibits the lysosomal and non-lysosomal (proteasomal) activities, leading to hepatic accumulation of various proteins after alcohol administration [51-53]. Consistent with these reports [51-53], CYP2E1 levels in the liver and other tissues have been shown to be increased by alcohol or acetone mainly through inhibition of proteasomal degradation [27,54,55]. Therefore, our current results suggesting increased degradation of oxidized proteins may not be related to the alcohol-mediated suppression of proteasomal degradation of proteins. Based on this reason, the oxidized proteins might undergo spontaneous degradation or fragmentation possibly through oxidation of proline residues in the protein backbones [37]. Alternatively, oxidized proteins may become more susceptible to certain proteolytic enzymes such as metalloproteinases that may be activated upon alcohol exposure [56]. In addition, it is unknown whether smaller protein fragments may be secreted into the serum and serve as autoimmunogens, leading to increased sensitivity toward cellular dysfunction and damage. In fact, alcoholic humans and alcohol-treated animals are known to possess autoimmune antibodies against various cellular proteins such as CYP2E1 itself or other acetaldehyde-protein adducts [57,58]. Therefore, it would be of interest to investigate whether these small fragments of degradation products serve as autoimmunogens, similar to the E2 subunit of mitochondrial pyruvate dehydrogenase complex in primary biliary cirrhosis [59]. These possibilities are being explored in the laboratory.
Our results of alcohol-mediated oxidative modification of Prx and other enzymes are consistent with earlier results that oxidation of certain proteins such as Prx and GAPDH led to inactivation of their catalytic activities [23,24,48]. Oxidation of Prx and inactivation could take place rapidly (as early as 1 h after alcohol exposure) and is consistent with the increased peroxide level detected by dichlorofluorescein fluorescence, a well-established indicator of ROS, in E47 HepG2 cells [7,22]. Our results suggest that alcohol appears to oxidize Prx thiols to the reversible forms of disulfide and sulfenic acid as well as the hyperoxidized forms of sulfinic and sulfonic acids. Because of the persistent increase in the levels of hyperoxidized Prx up to 48 h, ethanol appears to inhibit the function of sulfiredoxin, which restores the function of Prx [24]. Furthermore, our data indicate the oxidation of many proteins involved in the transmethylation and transsulfuration pathways. We are in the middle of investigating whether oxidation of these proteins would cause reduction of the activities of these proteins. If the reduced activities of these proteins are observed, the results may explain the recent findings of suppressed activities of the enzymes such as SAHH and MAT but also provide underlying mechanistic information for the reduced levels of S-adenosylmethionine and glutathione after alcohol treatment [1-5,33-36]. Subsequently, the stressful conditions with reduced levels of antioxidants and inhibition of key enzymes with increased ROS/RNS through induced CYP2E1 and iNOS may predispose the tissues more susceptible to irreversible damage in the presence of additional pathogenic factors such as hepatitis viruses or toxic drugs, as frequently observed in many alcoholic individuals [60-62].
5 Concluding Remarks
In conclusion, our current results using a biotin-NM targeted proteomic approach to identify oxidized proteins reveal that many cytosolic proteins are oxidized by chronic alcohol exposure. Similar patterns of oxidized cytosolic proteins were also observed in cultured hepatoma cells. Many cytosolic proteins that are oxidized after alcohol exposure were unambiguously identified. Detection of smaller fragments of many cytosolic proteins also provide evidence that oxidized proteins are easily degraded either by spontaneous degradation or increased susceptibility toward proteolytic enzymes. Alcohol-related oxidative inactivation of certain key enzymes may explain the underlying reason for alcohol-mediated oxidative stress and cellular dysfunction.
Acknowledgments
The authors are very grateful to Dr. Arthur I. Cederbaum and Dr. Sue Goo Rhee for providing E47 HepG2 cells and specific antibodies against Prx- SO3 or Prx used in this study. We also thank Dr. Norman Salem Jr. for the support throughout the experiments. We greatly appreciate Dr. Drake Zhang at ProtTech, Inc. (Norristown, PA, USA) for MS analysis. This research was supported by the NIAAA Intramural Research Program Fund and a grant for Chronic Liver Disease Project (to B.J. Song) from the Center for Biological Modulators in Korea. This project has been also funded in part with Federal funds from the National Cancer Institute, National Institutes of Health, under Contract No. NO1-CO-12400. By acceptance of this article, the publisher or recipient acknowledges the right of the U.S. Government to retain a nonexclusive, royalty-free license to any copyright covering the article. The content of this publication does not necessarily reflect the views or policies of the Department of Health and Human Services, nor does mention of trade names, commercial products, or organizations imply endorsement by the U.S. Government.
References
- 1.Tsukamoto H, Takei Y, McClain CJ, Joshi-Barve S, et al. Alcohol Clin Exp Res. 2001;25(Suppl):171S–181S. doi: 10.1097/00000374-200105051-00029. [DOI] [PubMed] [Google Scholar]
- 2.Sun AY, Ingelman-Sundberg M, Neve E, Matsumoto H, et al. Alcohol Clin Exp Res. 2001;25(Suppl):237S–243S. doi: 10.1097/00000374-200105051-00038. [DOI] [PubMed] [Google Scholar]
- 3.Molina PE, Hoek JB, Nelson S, Guidot DM, et al. Alcohol Clin Exp Res. 2003;27:563–575. doi: 10.1097/01.ALC.0000057946.57330.F7. [DOI] [PubMed] [Google Scholar]
- 4.Nordmann R, Ribiere C, Rouach H. Free Radical Biol Med. 1992;12:219–240. doi: 10.1016/0891-5849(92)90030-k. [DOI] [PubMed] [Google Scholar]
- 5.Lieber CS. Physiol Rev. 1997;77:517–543. doi: 10.1152/physrev.1997.77.2.517. [DOI] [PubMed] [Google Scholar]
- 6.de la M Hall P, Lieber CS, DeCarli LD, French SW, et al. Alcohol Clin Exp Res. 2001;25(Suppl):254S–261S. doi: 10.1097/00000374-200105051-00041. [DOI] [PubMed] [Google Scholar]
- 7.Wu D, Cederbaum AI. Alcohol Clin Exp Res. 1999;23:67–76. [PubMed] [Google Scholar]
- 8.Schaffert CS, Todero SL, McVicker BL, Tuma PL, et al. Biochem Pharmacol. 2004;67:2167–2174. doi: 10.1016/j.bcp.2004.01.022. [DOI] [PubMed] [Google Scholar]
- 9.Song BJ, Koop DR, Ingelman-Sundberg M, Nanji A, Cederbaum AI. Alcohol Clin Exp Res. 1996;20:138A–146A. doi: 10.1111/j.1530-0277.1996.tb01764.x. [DOI] [PubMed] [Google Scholar]
- 10.Takahashi T, Lasker JM, Rosman AS, Lieber CS. Hepatology. 1993;17:236–245. [PubMed] [Google Scholar]
- 11.Miles MF, Wilke N, Elliot M, Tanner W, Shah S. Mol Pharmacol. 1994;46:873–879. [PubMed] [Google Scholar]
- 12.Lee JH, Yang ES, Park JW. J Biol Chem. 2003;278:51360–51371. doi: 10.1074/jbc.M302332200. [DOI] [PubMed] [Google Scholar]
- 13.Bailey SM, Cunningham CC. Free Radic Biol Med. 2002;32:11–16. doi: 10.1016/s0891-5849(01)00769-9. [DOI] [PubMed] [Google Scholar]
- 14.Kono H, Rusyn I, Bradford BU, Connor HD, et al. J Pharmacol Exp Ther. 2000;293:296–303. [PubMed] [Google Scholar]
- 15.Kono H, Rusyn I, Yin M, Gabele E, et al. J Clin Invest. 2000;106:867–872. doi: 10.1172/JCI9020. [DOI] [PMC free article] [PubMed] [Google Scholar]
- 16.Kono H, Rusyn I, Uesugi T, Yamashina S, et al. Am J Physiol Gastrointest Liver Physiol. 2001;280:G1005–G1012. doi: 10.1152/ajpgi.2001.280.5.G1005. [DOI] [PubMed] [Google Scholar]
- 17.Guengerich FP, Kim DH, Iwasaki M. Chem Res Toxicol. 1991;4:168–179. doi: 10.1021/tx00020a008. [DOI] [PubMed] [Google Scholar]
- 18.Koop DR. FASEB J. 1992;6:724–730. doi: 10.1096/fasebj.6.2.1537462. [DOI] [PubMed] [Google Scholar]
- 19.Ekstrom G, Ingelman-Sundberg M. Biochem Pharmacol. 1989;38:1313–1319. doi: 10.1016/0006-2952(89)90338-9. [DOI] [PubMed] [Google Scholar]
- 20.Bell LC, Guengerich FP. J Biol Chem. 1997;272:29643–29651. doi: 10.1074/jbc.272.47.29643. [DOI] [PubMed] [Google Scholar]
- 21.Beckman JS, Beckman TW, Chen J, Marshall MA, Freeman BA. Proc Natl Acad Sci USA. 1990;87:1620–1624. doi: 10.1073/pnas.87.4.1620. [DOI] [PMC free article] [PubMed] [Google Scholar]
- 22.Suh SK, Hood BL, Kim BJ, Conrad TP, et al. Proteomics. 2004;4:3401–3412. doi: 10.1002/pmic.200400971. [DOI] [PubMed] [Google Scholar]
- 23.Woo HA, Kang SW, Kim HK, Yang KS, et al. J Biol Chem. 2003;278:47361–47364. doi: 10.1074/jbc.C300428200. [DOI] [PubMed] [Google Scholar]
- 24.Woo HA, Jeong W, Chang TS, Park KJ, et al. J Biol Chem. 2005;280:3125–3128. doi: 10.1074/jbc.C400496200. [DOI] [PubMed] [Google Scholar]
- 25.Bae MA, Pie JE, Song BJ. Mol Pharmacol. 2001;60:847–856. [PubMed] [Google Scholar]
- 26.Bae MA, Song BJ. Mol Pharmacol. 2003;63:401–408. doi: 10.1124/mol.63.2.401. [DOI] [PubMed] [Google Scholar]
- 27.Roberts BJ, Song BJ, Soh Y, Park SS, et al. J Biol Chem. 1995;270:29632–29635. doi: 10.1074/jbc.270.50.29632. [DOI] [PubMed] [Google Scholar]
- 28.Jeong KS, Soh Y, Jeng J, Felder MR, et al. Arch Biochem Biophys. 2000;384:81–87. doi: 10.1006/abbi.2000.2119. [DOI] [PubMed] [Google Scholar]
- 29.Blonder J, Conrads TP, Yu LR, Terunuma A, et al. Proteomics. 2004;4:31–45. doi: 10.1002/pmic.200300543. [DOI] [PubMed] [Google Scholar]
- 30.Blonder J, Rodriguez-Galan MC, Lucas DA, Young HA, et al. Biochim Biophys Acta. 2004;1698:87–95. doi: 10.1016/j.bbapap.2003.10.009. [DOI] [PubMed] [Google Scholar]
- 31.Boveris A, Oshino N, Chance B. Biochem J. 1972;128:617–630. doi: 10.1042/bj1280617. [DOI] [PMC free article] [PubMed] [Google Scholar]
- 32.Lin Z, Crockett DK, Lim MS, Elenitoba-Johnson KS. J Biomol Tech. 2003;14:149–155. [PMC free article] [PubMed] [Google Scholar]
- 33.Halsted CH, Villanueva JA, Devlin AM, Niemela O, et al. Proc Natl Acad Sci U S A. 2002;99:10072–10077. doi: 10.1073/pnas.112336399. [DOI] [PMC free article] [PubMed] [Google Scholar]
- 34.Villanueva JA, Halsted CH. Hepatology. 2004;39:1303–1310. doi: 10.1002/hep.20168. [DOI] [PubMed] [Google Scholar]
- 35.Kenyon SH, Nicolaou A, Gibbons WA. Alcohol. 1998;15:305–309. doi: 10.1016/s0741-8329(97)00134-1. [DOI] [PubMed] [Google Scholar]
- 36.Duce AM, Ortiz P, Cabrero C, Mato JM. Hepatology. 1988;8:65–68. doi: 10.1002/hep.1840080113. [DOI] [PubMed] [Google Scholar]
- 37.Berlett BS, Stadtman ER. J Biol Chem. 1997;272:20313–20316. doi: 10.1074/jbc.272.33.20313. [DOI] [PubMed] [Google Scholar]
- 38.Stadtman ER, Moskovitz J, Levine RL. Antioxid Redox Signal. 2003;5:577–582. doi: 10.1089/152308603770310239. [DOI] [PubMed] [Google Scholar]
- 39.Smith CD, Carney JM, Starke-Reed PE, et al. Proc Natl Acad Sci U S A. 1991;88:10540–10543. doi: 10.1073/pnas.88.23.10540. [DOI] [PMC free article] [PubMed] [Google Scholar]
- 40.Agarwal S, Sohal RS. Arch Biochem Biophys. 1994;309:24–28. doi: 10.1006/abbi.1994.1078. [DOI] [PubMed] [Google Scholar]
- 41.Stumptner C, Omary MB, Fickert P, Denk H, Zatloukal K. Am J Pathol. 2000;156:77–90. doi: 10.1016/S0002-9440(10)64708-6. [DOI] [PMC free article] [PubMed] [Google Scholar]
- 42.Bardag-Gorce F, Vu J, Nan L, Riley N, et al. Exp Mol Pathol. 2004;76:83–89. doi: 10.1016/j.yexmp.2003.11.004. [DOI] [PubMed] [Google Scholar]
- 43.Rivett AJ. J Biol Chem. 1985;260:300–305. [PubMed] [Google Scholar]
- 44.Davies KJA. J Biol Chem. 1987;262:9895–9901. [PubMed] [Google Scholar]
- 45.Pirlich M, Muller C, Sandig G, Jakstadt M, et al. Free Radic Biol Med. 2002;33:283–291. doi: 10.1016/s0891-5849(02)00880-8. [DOI] [PubMed] [Google Scholar]
- 46.Baty JW, Hampton MB, Winterbourn CC. Proteomics. 2002;2:1261–1266. doi: 10.1002/1615-9861(200209)2:9<1261::AID-PROT1261>3.0.CO;2-Q. [DOI] [PubMed] [Google Scholar]
- 47.Ruiz F, Corrales FJ, Miqueo C, Mato JM. Hepatology. 1998;28:1051–1057. doi: 10.1002/hep.510280420. [DOI] [PubMed] [Google Scholar]
- 48.Mohr S, Hallak H, de Boitte A, Lapetina EG, Brune B. J Biol Chem. 1999;274:9427–9430. doi: 10.1074/jbc.274.14.9427. [DOI] [PubMed] [Google Scholar]
- 49.Rivett AJ. Arch Biochem Biophys. 1985;243:624–632. doi: 10.1016/0003-9861(85)90540-5. [DOI] [PubMed] [Google Scholar]
- 50.Grune T, Reinheckel T, Davies KJA. FASEB J. 1997;11:526–534. [PubMed] [Google Scholar]
- 51.Donohue TM, Jr, Kharbanda KK, Casey CA, Nanji AA. Alcohol Clin Exp Res. 2004;28:1257–1263. doi: 10.1097/01.alc.0000134233.89896.19. [DOI] [PubMed] [Google Scholar]
- 52.Kharbanda KK, McVicker DL, Zetterman RK, Donohue TM., Jr Biochim Biophys Acta. 1995;1245:421–429. doi: 10.1016/0304-4165(95)00121-2. [DOI] [PubMed] [Google Scholar]
- 53.Fataccioli V, Andraud E, Gentil M, French SW, Rouach H. Hepatology. 1999;29:14–20. doi: 10.1002/hep.510290106. [DOI] [PubMed] [Google Scholar]
- 54.Song BJ, Veech RL, Park SS, Gelboin HV, Gonzalez FJ. J Biol Chem. 1989;264:3568–3572. [PubMed] [Google Scholar]
- 55.Roberts BJ, Shoaf SE, Jeong KS, Song BJ. Biochem Biophys Res Commun. 1994;205:1064–1071. doi: 10.1006/bbrc.1994.2774. [DOI] [PubMed] [Google Scholar]
- 56.Aye MM, Ma C, Lin H, Bower KA, et al. Int J Cancer. 2004;112:738–746. doi: 10.1002/ijc.20497. [DOI] [PubMed] [Google Scholar]
- 57.Israel Y. Gastroenterology. 1997;113:353–355. [PubMed] [Google Scholar]
- 58.Clot P, Albano E, Elliasson E, Tabone M, et al. Gastroenterology. 1996;111:206–216. doi: 10.1053/gast.1996.v111.pm8698201. [DOI] [PubMed] [Google Scholar]
- 59.Mato TK, Davis PA, Odin JA, Coppel RL, Gershwin ME. Hepatology. 2004;40:1241–1248. doi: 10.1002/hep.20491. [DOI] [PMC free article] [PubMed] [Google Scholar]
- 60.Rigamonti C, Mottaran E, Reale E, Rolla R, et al. Hepatology. 2003;38:42–49. doi: 10.1053/jhep.2003.50275. [DOI] [PubMed] [Google Scholar]
- 61.Whitcomb DC, Block GD. J A M A. 1994;272:1845–1850. doi: 10.1001/jama.1994.03520230055038. [DOI] [PubMed] [Google Scholar]
- 62.Howard LA, Miksys S, Hoffmann E, Mash D, Tyndale RF. Br J Pharmacol. 2003;138:1376–1386. doi: 10.1038/sj.bjp.0705146. [DOI] [PMC free article] [PubMed] [Google Scholar]