

Abstract
Formation of thrombin is triggered when membrane-localized tissue factor (TF) is exposed to blood. In closed models of this process, thrombin formation displays an initiation phase (low rates of thrombin production cause platelet activation and fibrinogen clotting), a propagation phase (>95% of thrombin production occurs) and a termination phase (prothrombin activation ceases and free thrombin is inactivated). A current controversy centers on whether the TF stimulus requires supplementation from a circulating pool of blood TF in order to sustain an adequate procoagulant response. We have evaluated the requirement for TF during the progress of the blood coagulation reaction and have extended these analyses to assess the requirement for TF during resupply (“flow replacement”). Elimination of TF activity at various times during the initiation phase indicated: a period of absolute dependence (<10s); a transitional period in which the dependence on TF is partial and decreases as the reaction proceeds (10–240s); and a period in which the progress of the reaction is TF independent (>240s). Resupply of reactions late during the termination phase with fresh reactants, but no TF, yielded immediate bursts of thrombin formation similar in magnitude to the original propagation phases. Our data show that independence from the initial TF stimulus is achieved by the onset of the propagation phase and that the ensemble of coagulation products and intermediates which yield this TF independence maintain their prothrombin-activating potential for considerable time. These observations support the hypothesis that the transient, localized expression of TF is sufficient to sustain a TF-independent procoagulant response as long as flow persists.
Abbreviations used are: AT-III, antithrombin III; EDTA, (ethylene-dinitrilo) tetraacetic acid; FPRck, D-Phe-Pro-ArgCH2Cl; HEPES, N-[2-Hydroxyethyl]piperazine-N′-2—ethanesulfonic acid; HBS, 20 mM HEPES, 150 mM NaCL, pH 7.4; HSPG, heparan sulfate proteoglycans PC, 1,2-dioleoyl-sn-glycero-3-phosphocholine; PS, 1,2-dioleoyl-sn-3-glycero-3-[phospho-L-serine]; PCPS vesicles, single bilayer phospholipid vesicles composed of 75%PC and 25% PS; PEG, polyethylene glycol, average molecular weight = 8000; TFPI, tissue factor pathway inhibitor; TAT, thrombin-antithrombin III complex; TF, tissue factor
Tissue factor (TF) is a 263 amino acid glycoprotein with three major domains: 1) an extracellular domain (residues 1–219) that binds with high affinity to factor VIIa; 2) a transmembrane domain (residues 220–242) that anchors TF to the membrane surface; and 3) a cytoplasmic domain (residues 243–263)(1–3). Binding of plasma factor VIIa to membrane bound TF results in an approximately 2 × 10⁷-fold increase in the enzymatic activity of factor VIIa towards its natural substrates factor IX and factor X (4). Most studies have concluded that membrane-bound tissue factors (TF), expressed by inflammatory cells and cells outside the vasculature, are the key initiators of the blood coagulation process (5–7).
The generation of thrombin, the enzyme responsible for clot formation as well as other procoagulant and anticoagulant functions during the blood coagulation process occurs in a nonlinear fashion (8). During an initiation phase, tiny amounts of thrombin are generated, platelets, zymogens and procofactors are activated, and complex enzymes assembled (9;10). Subsequently, a propagation phase of thrombin generation occurs, characterized by dramatic increases in both the rate of thrombin generation and levels of thrombin. The duration of the initiation phase, which roughly corresponds to the clotting time of blood and plasma, is predominantly dependent upon the concentration of the factor VIIa-TF enzyme complex and tissue factor pathway inhibitor (TFPI)(11–13). Thrombin generation during the propagation phase, however, is almost independent of this complex and TFPI (14).
TFPI is a multivalent Kunitz type plasma proteinase inhibitor (15;16). It is the principal stoichiometric inhibitor of the factor VIIa-TF complex and thus is a key regulator of the initiation phase of thrombin generation (14). TFPI inhibits the factor VIIa-TF complex in a factor Xa dependent manner (17–19). The mechanistic dependence of factor VIIa-TF inhibition by TFPI on one of the products of factor VIIa-TF catalysis works against premature neutralization of the TF stimulus. The centrality of the TFPI regulatory mechanism to normal hemostasis is apparent by the lack of reports of individuals with a TFPI (−/−) genotype and the lethality in utero of the TFPI (−/−) genotype in transgenic mice (20).
Recently, controversy has emerged concerning the presence and functionality of TF species circulating in blood. Reports of circulating TF can be divided into those showing TF localized on the surface of blood cells and microparticles and those describing a TF species that circulates as a soluble protein (21–27). These blood TF species are invoked in support of a new hypothesis that TF dependent thrombin generation requires a continuous infusion of this cofactor. It has, for example, been hypothesized that circulating TF plays an important role in clot growth (26). However, data from our laboratory and others have indicated that there is little or no TF-related activity in the blood of healthy individuals (28–31) or in the blood of mice (32).
The goals of this study were to define the duration of the TF stimulus necessary to yield normal thrombin generation and to assess the requirement for additional TF during the progress of the blood coagulation reaction. We used three models of blood coagulation developed by our laboratory: numerical simulation (33;34), synthetic plasma (11;12) and whole blood (13).
EXPERIMENTAL PROCEDURES
Materials
Human coagulation factors VII, X, IX, and prothrombin, were isolated from fresh frozen plasma using the methods of Bajaj et al. (35), and were purged of trace contaminants and traces of active enzymes as described (12). Human factor V and antithrombin III (AT-III) were isolated from freshly frozen plasma (36;37). Recombinant factor VIII and recombinant TF (residues 1–242) were provided as gifts from Drs. Shu Len Liu and Roger Lundblad (Hyland division, Baxter Healthcare Corp, Duarte, CA). Recombinant human factor VIIa was provided as a gift from Dr. Ula Hedner (Novo Nordisk, Denmark). Recombinant full-length TFPI was provided as a gift from Dr. K. Johnson (Chiron Corp, Emeryville, CA). Corn trypsin inhibitor (CTI) was isolated from popcorn and the preparation of the TF/lipid reagent was performed as described elsewhere (38). 1,2-Dioleolyl-sn-Glycero-3-Phospho-L-Serine (PS) and 1,2-Dioleoyl-sn-Glycero-3-Phosphocholine (PC) were purchased from Avanti Polar Lipids, Inc (Alabaster, AL), and EDTA (Ca++ quencher) was purchased from Sigma (St Louis, MO). Phospholipid vesicles (PCPS) composed of 25% PS and 75% PC were prepared as described (39). Spectrozyme TH was purchased from American Diagnostica, Inc (Greenwich, CT). D-Phe-Pro-ArgCH2Cl (FPRck) was prepared in house and monoclonal anti-TF (aTF-5) and anti-factor VII/VIIa (aFVII-1) antibodies were produced by the Biochemistry Antibody Core Laboratory (University of Vermont). ELISA thrombin-AT-III (TAT) kit (Enzygnost TAT) was purchased from Behring (Marburg, Germany).
Computational Model
The current numerical model is based upon prior publications by Jones et al. (33), Hockin et al. (34) and Butenas et al. (40) and yields concentration versus time profiles for selected species when electronic mixtures of the procoagulant factors II, IX, X, VII, VIIa, V, and VIII and the anticoagulants TFPI and AT-III are exposed to picomolar concentrations of TF. The standard simulation sets zymogen, cofactor and inhibitor concentrations at their mean physiological values and the concentration of the TF stimulus at 5 pM. Simulations designed to define the minimum time interval of TF function were conducted by arresting the standard simulation at selected times, setting the concentrations of free TF and all TF containing species to zero and then allowing the electronic simulation to proceed. Numerical simulations of resupply were constructed to mimic the equal volume addition of fresh “plasma” material used in the empirical models. Electronic reactions were allowed to proceed for a given time and then stopped. The starting concentrations of all species for the resupplied reaction were then calculated as follows: the concentration of each product or intermediate species at any time (t = x) in the initial reaction was divided in half for the start of the resupplied reaction; for each zymogen, cofactor and inhibitor, the concentration present at the start of the resupplied reaction were calculated as follows: ((unreacted component concentration at t = x)/2 + (resupply component concentration)/2). TF was not included in the resupplying material. With the initial state of the resupplied reaction defined, the simulation was then restarted.
Synthetic coagulation model
The procedure used is a modification of Lawson et al (11) and van ‘t Veer et al.(12). Platelets were prepared by the method of Mustard et al (41).
I. Procofactor solution
Relipidated TF (10 pM; molar ratio PCPS:TF=5000) is incubated with 4 μM PCPS or 4 × 10⁸ platelets/mL in HBS (20 mM HEPES and 150 mM NaCl, pH 7.4), 2 mM CaCl2 for 10 min at 37°C. Factor V (40 nM) and factor VIII (1.4 nM) are added prior to the initiation of the reaction.
II. Zymogen-inhibitor solution
Prothrombin (2.8 μM), factor VII (20 nM), factor VIIa (0.2 nM), factor X (340 nM), factor IX (180 nM), factor XI (60 nM), TFPI (5 nM), and AT-III (6.8 μM) are preheated in HBS, 2 mM CaCl2 at 37°C for 3 min.
The reaction is started by mixing equal volumes of both Ca+2 preequilibrated solutions resulting in physiological concentrations of the zymogens, pro-cofactors and inhibitors, 5 pM TF, 2 mM CaCl2 and 2 μM PCPS or 2 × 10⁸ platelets/mL. Following the start of the reaction, at selected time points, 10 μl aliquots are withdrawn from the reaction mixture and quenched in 20 mM EDTA in HBS (pH 7.4) containing 0.2 mM Spectrozyme TH and assayed immediately for thrombin activity. The hydrolysis of the substrate is monitored by the change in absorbance at 405 nm using a Vmax spectrophotometer (Molecular Devices Corp., Menlo Park, CA). Thrombin generation is calculated from a standard curve prepared by serial dilutions of α-thrombin. In the antibody quenching experiments aTF-5 and aFVII-1 (0.25 mg of each; diluted in HBS, 2 mM CaCl2, pH 7.4) are added at selected time-points to the reaction mixture. Resupply was conducted at selected times by the addition of an equal volume of freshly constituted, TF free, procofactor/zymogen-inhibitor mixture to an ongoing reaction. The same protocol of sampling, quenching and assay was then followed.
Whole blood model
The protocol used is a modification of Rand et al. (13). A healthy donor was recruited, advised according to a protocol approved by the University of Vermont Human Studies Committee and his consent was obtained. The individual selected exhibited normal values for the parameters of blood coagulation, protein levels and platelet counts. Experiments were performed in tubes placed on a rocking table enclosed in a 37°C temperature-controlled glove box using fresh blood. Blood was drawn by venipuncture and immediately delivered into the reagent-loaded tubes. All tubes (two series per experiment) are loaded with CTI (0.1 mg/ml). No additional reagents are added to the phlebotomy control series (2 tubes). Thirty-two tubes (15 tubes in series A and 17 tubes in series B) are loaded with relipidated TF (TF/PCPS 5 pM/25 nM) in HBS, 2 mM CaCl2. The zero-time tube of each series is pretreated with 1 ml of 50 mM EDTA and 10 μl of 10 mM FPRck (diluted in 10 mM HCl). After blood is delivered, the tubes are periodically (60–1,200 s) quenched with EDTA and FPRck. In TF quenching experiments, antibodies aTF-5 and aFVII-1 (0.25 mg of each; diluted in HBS, 2 mM CaCl2, pH 7.4) are added to two series B tubes at 0 s and to 12 tubes (quenching time 180–1,200 s) at 120 s. An equal volume of HBS, 2 mM CaCl2, pH 7.4 is added to the A series tubes. In all experiments, no more than 35 μl of reagents (3.5% of blood volume) are loaded in each tube. The clotting time is observed visually by two observers and is called when “clumps” are observed on the side of the tube. After the experiment, tubes are centrifuged and the supernatants are aliquoted and analyzed for TAT levels.
In resupply experiments, the setup is similar but the B series tubes are not quenched during the first 20 min. At 20 min after initiation with TF, these tubes all receive an equal volume of new blood, drawn from the same individual one minute prior to its use. In some experiments, inhibitory antibodies (aTF-5 and aFVII-1: 0.25 mg of each; diluted in HBS, 2 mM CaCl2, pH 7.4) are added to the ongoing reactions 1 min prior to resupply. These tubes were then periodically quenched (1260–2400 s) with EDTA and FPRck. Within this experimental format several additional tubes were quenched at 20 min, prior to resupply, and at 40 min with EDTA only.
Active thrombin and thrombin inhibitor levels
Sera derived from TF-initiated whole blood quenched only with EDTA was assessed for the presence of active thrombin and for its residual capacity to inhibit thrombin. Active thrombin was measured in a clotting based assay using purified fibrinogen (42). Briefly, 50 μL of a 5 mg/mL fibrinogen stock in HBS + 5 mM CaCl2 + 0.1 % PEG 8000 was brought to 37ºC and then 50 μL of the thrombin containing sample was added. Clotting times were determined using a ST-4 clotting instrument (Diagnostica Stago, Parsippany, New Jersey). Clotting times obtained in the presence of sera samples were converted to thrombin concentrations by reference to a standard curve constructed with thrombin concentrations ranging from 10 nM to 40 pM. To assess the remaining thrombin inhibitor capacity of these same sera, exogenous thrombin (100 nM or 50 nM final) was added to a 50 μL aliquot of sera at 37ºC. Individual reactions were quenched at different times by a 30-fold dilution with HBS and then assayed immediately as described above. The efficacy of the quenching scheme was established by experiments in which the sera samples were diluted 30-fold prior to the addition of thrombin: assays conducted within one minute of thrombin addition to a diluted plasma sample showed no decay in thrombin activity. Analysis of the observed decay in thrombin activity as a first order process yielded a good fit to the data.
Operational definitions
In empirical models the initiation phase of thrombin generation is defined as a time interval from the start of the reaction (represented by 0 on the horizontal (x) axis in figures) to the point of intersection of the x-axis and a tangent to the maximum slope of thrombin generation. This point roughly corresponds to the clotting time in blood and plasma. In numerical simulations the initiation phase is defined as the time to reach an active thrombin level of 2 nM (~ 10 nM TAT). The propagation phase of thrombin generation is defined as a time interval from the end of the initiation phase to the maximum thrombin (or TAT) concentration. The termination phase is defined as the period of the reaction in which prothrombin consumption is over and active thrombin levels are falling as a result of inactivation by endogenous protease inhibitors.
RESULTS
Partitioning of TF during coagulation
Data from empirical studies of the regulation of the TF-factor VIIa complex have indicated that TFPI is a rapid and efficient suppressor of the procoagulant consequences of TF expression (14) (43). Fig. 1 presents simulation data detailing the partitioning of an introduced bolus (5 pM) of TF between catalytically inert (panel A) and active complexes (panel B). Twenty seconds after the introduction of TF to the system, greater than 98% of TF remains inert, either complexed with uncleaved factor VII zymogen (A, •) or unassociated with a protein partner (A, ×). By 100 s into the reaction, ~ 80% of TF is bound to factor VII, a condition that persists throughout the propagation phase, while ~ 9% is free and ~ 9% tied up in complexes with TFPI. As the reaction progresses, TF continues to be found primarily in inert complexes, although the predominant species becomes the TF-factor VIIa-factor Xa-TFPI complex (A, ♦). At 1200 s, ~ 93% of the TF is bound to TFPI, ~ 6% is bound to factor VII, and ~ 0.1% (~ 5 fM) is unassociated with other proteins.
Fig 1. Numerical simulation: the formation of TF complexes during coagulation.


The reaction in electronic plasma is started by addition of 5 pM TF (t=0). Data is expressed as metabolite concentration (femtomolar) vs time (s). Panel A: Inert complexes: TF not bound to other proteins (×); TF-factor VII (•); TF-factor VIIa-factor Xa-TFPI (♦); also shown total TF-factor VIIa (▪). Panel B: catalytically active species: TF-factor-VIIa complex derived from endogenous VIIa (○); TF-VIIa complex where the factor VIIa is derived from factor VII activated during the progress of the reaction (□). Early formation of TF-factor VIIa-factor Xa-TFPI complex is also shown (♦). Time intervals corresponding to the initiation, propagation and termination phases of thrombin generation are indicated.
Fig 1B presents the evolution of functional catalytic TF complexes. This process is characterized by two maxima of functional TF-VIIa complex with each maxima primarily reflecting a different source of factor VIIa. The first occurs 20 s into the reaction, with levels of active TF species (defined as the sum of free TF-factor VIIa complex and TF-factor VIIa complex bound to its substrates and products) of ~ 80 fM. This maxima derives primarily from the association of endogenous (circulating) factor VIIa (100 pM) with the introduced TF stimulus (B, ○). This episode of TF-factor VIIa complex formation is short lived because of rapid factor Xa dependent sequestration by TFPI (B, ♦). The second phase of TF-VIIa accumulation initiates at ~ 260 s and reaches its maximum level, ~ 120 fM, at 460 s, a time which corresponds to the active thrombin maxima and the end of the propagation phase (B, □). This factor VIIa derives primarily from activation of factor VII by the rapidly increasing levels of thrombin and factor Xa that characterize the propagation phase (34). In these simulations, the previously formed pool of TF-factor VII complex supplies the TF via an exchange reaction controlled by off rate defining the TF factor VII binding equilibrium (t½ = 220 s) (A, •). At 1200 s, functional TF-VIIa, constitutes ~ 0.5% (~ 20 fM) of the total TF pool.
Time dependence of the TF stimulus during the initiation phase of thrombin generation
A. Numerical simulations
Fig. 2A displays simulations in which thrombin generation induced with 5 pM TF is allowed to proceed for selected time periods before the TF stimulus is mathematically removed and the reaction allowed to proceed without further contributions from the factor VIIa-TF complex. In a control experiment (♦), with TF-related activity only regulated by the natural inhibitors of the factor VIIa-TF complex, i.e. TFPI and AT-III, thrombin generation enters the propagation phase after an initiation phase of 240 s. During the propagation phase, thrombin is generated at a maximum rate of 2.0 nM/s and the maximum active thrombin achieved is 275 nM. Electronic nullification of TF activity at 240 s (▪) has little effect on these parameters: the duration of the initiation phase remains 240 s and the maximum rate of thrombin generation and its maximum level are only slightly decreased (1.9 nM/s and 240 nM). Nullification of TF-related activity at 120 s from the start of the reaction (▵) slightly alters the initiation phase with a more pronounced effect on the maximum rate of thrombin generation (1.3 nM/s) and the maximum thrombin level. When TF nullification time occurs earlier (60 s; ▴), all three parameters of thrombin generation undergo more significant changes, especially the initiation phase, which is prolonged to 330 s. No thrombin generation is observed over 1,200 s, when TF-related activity is nullified at the initiation of the reaction (×) or at 10 s post initiation (•). However, TF nullification at 20 s (not shown) results in significant thrombin generation indicating that between 10 and 20 s sufficient other procoagulant products have been mobilized to sustain the process.
Fig. 2. Quenching of TF activity during the initiation phase of thrombin generation in numerical simulations (A), synthetic plasma (C) and contact pathway-inhibited whole blood (D).


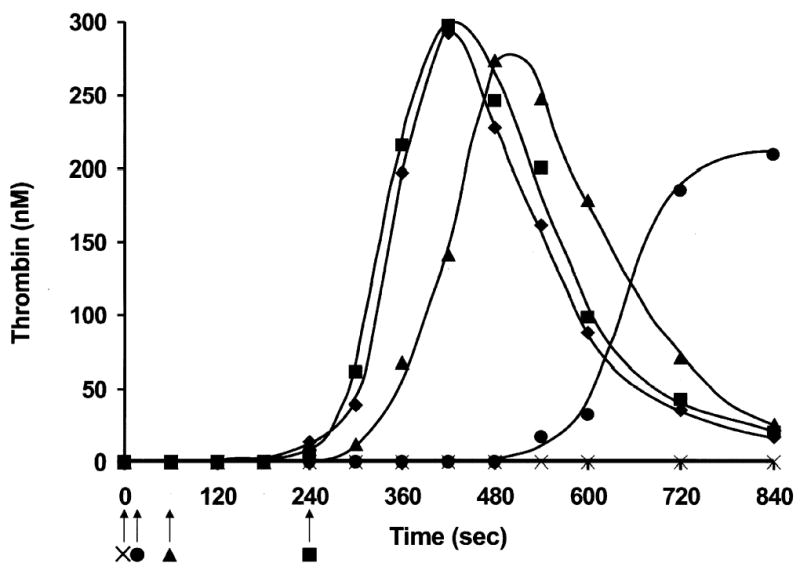
Thrombin generation was initiated with 5 pM membrane-bound TF. TF activity was eliminated at 0 s (×), 10 s (•), 60 s (▴), 120 s (▵) and 240 s (▪) after the initiation of the reaction or not eliminated at all (♦). Arrows mark the quenching times. In panel B, factor Xa production (note log scale) during control numerical simulation (see Panel A; ♦) is broken down into that produced by the factor VIIa-TF complex (♦) and by the factor VIIIa-factor IXa complex (⋄). Also depicted in panel B are the individual time courses of factor Xa production initiating at each quenching time point (10 s (•); 20 s (○); 60 s (▴); 120 s (▵)) which reflect the efficacy of the one remaining route of factor Xa production, the factor VIIIa-factor Xa complex, after the removal of all TF species. The Inset shows an expanded view of the time interval between 200 and 300 s.
In Fig. 2B, the influence of quenching on the production of factor Xa is shown. Factor Xa generated over the first 300 s of the control simulation is dissected into that produced by the factor VIIa-TF complex (♦) and that by the factor IXa-factor VIIIa complex (⋄). Factor Xa production after the mathematical elimination of TF containing species has only one significant route in these simulations, the factor IXa-factor VIIIa complex. Thus, time courses of factor Xa production after TF quenching at 10(•), 20 (○), 60 (▴) and 120 s (▵) are shown emanating from the control simulation of the factor IXa-factor VIIIa derived factor Xa. As can be seen, the post-quenching rate and extent of factor Xa production by the factor IXa-factor VIIIa complex approaches that of the unquenched reaction (⋄) as the interval between initiation and quenching increases. A convenient marker for comparing the performance of the TF depleted systems with the complete system is the time at which the factor IXa-factor VIIIa complex becomes the predominant source of new factor Xa. In the control simulation this time is ~ 210 s (see Fig 2B Inset). The reaction quenched at 120 s achieves this transition point in the primary source of new factor Xa at ~ 220 s, while that quenched at 60 s does so at ~ 280 s. In reactions quenched after 10 or 20 s, the factor IXa-factor VIIIa complex never becomes the primary source of factor Xa during the 1200 s reaction.
B. Synthetic plasma
In synthetic plasma with 2 μM PCPS (Fig. 2C), the profile of thrombin generation initiated with 5 pM TF is similar to that observed in numerical simulations at an equivalent TF concentration. The duration of the initiation phase is ~240 s (♦), the maximum rate of thrombin generation during the propagation phase is 2.6 nM/s and maximum concentration of active thrombin is 300 nM. The addition of inhibitory monoclonal anti-factor VII/VIIa and anti-TF antibodies at the end of the initiation phase (240 s; ▪) has no effect on subsequent thrombin generation. Quenching of TF-related activity at 60 s post initiation (▴) prolongs the initiation phase to ~300 s and slightly decreases the maximum rate of thrombin generation (2.0 nM/s) and the maximum concentration of active thrombin (270 nM). The early addition of the antibodies to the reaction mixture (10 s after the start; •) significantly prolongs the initiation phase (to 570 s), while the maximum rate of thrombin generation (1.3 nM/s) achieved during the propagation phase remains significant, and the maximum concentration of active thrombin is decreased by only 30% (210 nM). No thrombin generation is observed when inhibitory antibodies directed against TF and factor VII are added to the reaction mixture at 0 s (×).
C. Whole blood
In whole blood experiments we prevent contact pathway-initiated coagulation by adding 0.1 mg/ml CTI, which inhibits factor XI activation by factor XIIa (44). CTI-inhibited whole blood initiated with 5 pM membrane-bound TF clots in 290 s (Fig. 2D; ♦). The clotting time in whole blood approximates the start of the propagation phase of thrombin generation. In the blood from this individual, thrombin generation during the propagation phase, evaluated as thrombin-AT-III complex formation (TAT), occurs at 0.6 nM/s and the maximum concentration of thrombin generated is 330 nM. The addition of inhibitory anti-TF and anti-factor VII antibodies to blood in the middle of the initiation phase (120 s; ▵) prolongs the initiation phase duration (by 1 min) but has no effect on the rate of thrombin generation and on the final levels of thrombin achieved. No clot is observed in 1,200 s when antibodies are added to blood at the start of the reaction (0 s).
TF independence of the response to resupply
The previous experiments define the time interval of essential TF function during the initiation phase that is required to drive a normal cycle of thrombin generation, and establish that the reaction becomes independent of the presence of TF. The experimental systems used are all closed since there is no net change in mass during the reaction. Each system reaches a state where zymogens and cofactors are either fully depleted or their ongoing consumption is negligible. For example, with a 5 pM TF stimulus, prothrombin consumption is complete in our numerical simulations (34) and in synthetic plasma (K. Jones and K. G. Mann, manuscript in preparation). Both these models use mean physiologic values for the concentrations of their constituents. In whole blood experiments with a 5 pM TF stimulus, we have demonstrated that prothrombin consumption, assessed by TAT formation, is phenotype dependent, reflecting the specific ensemble of the concentration of each individual’s clotting factors (10;13;45). The catalytic status of these “exhausted” closed reaction systems after a cycle of TF-initiated thrombin generation has not been described. The following experiments show the response, after an initial episode of TF stimulation, for each of these closed systems to a resupply of starting material.
Resupply in Numerical simulations
Fig. 3 presents a numerical simulation of active thrombin and TAT generation after a resupply event. Resupply was conducted by mathematically mixing the array of species present at 1200 s after the initial 5 pM TF stimulus with an equal volume of the starting reactants but without additional TF. At 1200 s into the initial reaction the supply of prothrombin has been almost completely (>99 %) exhausted with the products of its activation distributed almost exclusively in inert complexes (TAT (~70 %); meizothrombin-antithrombin (~29 %)). Active thrombin levels are around 10 pM. Patterns of consumption of the other zymogens and cofactors have been reported previously (34) and are as follows factor IX (<1%); factor X (~2.5%); factor V and factor VIII (~100 %) and factor VII (~87 %). Factor VIIa is the only species initially present that accumulates during the simulated reaction. Thus the resupplied milieu is one in which prothrombin, factor V, factor VIII and factor VII are at ~ ½ their mean physiologic concentrations, AT-III is at ~80 % and factor IX, X and TFPI levels are at ~ 100 % their mean physiologic concentrations.
Fig. 3. Numerical simulation: Resupply of an electronic TF-initated blood coagulation reaction after the cessation of prothrombin consumption.
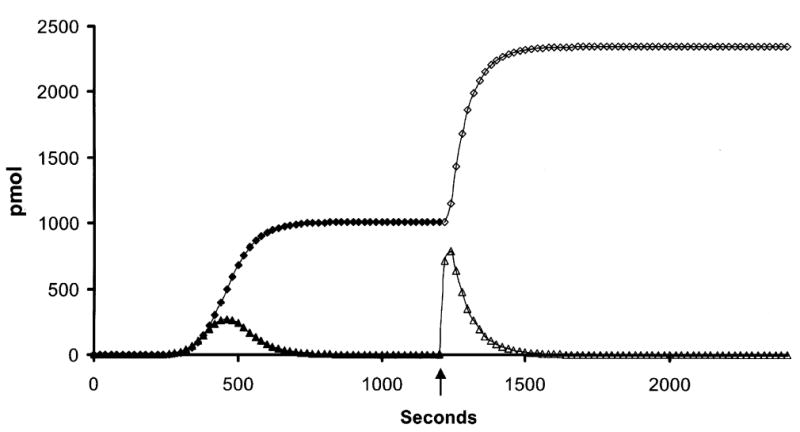
Thrombin generation was initiated with 5 pM TF and the reaction arrested after 1200 s. An equal “electronic volume” of fresh zymogens, cofactors and inhibitors, but no TF, was introduced and the reaction restarted. Time courses reflecting free thrombin levels and thrombin-antithrombin III levels (TAT) are presented as moles of product present (concentration × “electronic volume” of the reaction) vs time in order to conform to the methodology of the empirical experiments. Initial episode thrombin (▴); initial episode TAT (♦); resupply thrombin (▵); resupply TAT (⋄). The arrow indicates the resupply time.
The key features of the resupply response are: 1) the absence of a lag phase in the onset of prothrombin activation. The time to 2 nM thrombin drops from ~ 240 s, observed in the initial response to 5 pM TF, to ~ 1 s; 2) a 7 fold greater rate of thrombin generation relative to the initial propagation phase despite the starting concentration of prothrombin in the resupply reaction being ½ that of the initial reaction. TAT formation proceeds at an ~ 3.5 fold faster rate; and 3) complete consumption of resupplied prothrombin but with an altered distribution of inert products. Meizothrombin-antithrombin complexes account for only 3.6 % of the total antithrombin complexes produced during resupply. We have previously reported that meizothrombin is an accumulating product of prothrombin activation early in the initiation phase (46) of the TF-initiated process. Numerical simulations show that prothrombinase levels early after introduction of the TF stimulus are relatively low and meizothrombin interactions with factor V and AT-III are favored over reassociation with prothrombinase. None of these characteristics of the resupply response support the involvement of TF.
To further test the independence of the resupply response from TF, additional simulations were performed in which all TF species present in the original reaction at 1200 s were mathematically removed prior to mixing with fresh reactants without TF. When this was done, the time course of thrombin generation upon resupply was indistinguishable from the initial resupply simulation (Fig.3, ⋄) (data not shown). This analysis indicates that the residual TF species (see Fig. 1) in the original reaction system do not contribute to the resupply response.
In these numerical simulations of resupply the clear candidate for the TF-independent prothrombin activating potential is the prothrombinase complex which reaches levels of ~ 3.9 nM at 1200 s. The stability of the prothrombinase complex in this electronic plasma derives from the fact that the mathematical descriptions of the association of factor Xa with the inhibitors ATIII and TFPI do not provide an effective route for competing with factor Xa binding to factor Va, per empirical observation(47). The numerical simulations suggest that there is no requirement for TF to reignite thrombin generation if the prothrombinase complex, which is formed primarily during the propagation phase, is stable for significant periods of time in the empirical models.
Resupply in Synthetic plasma
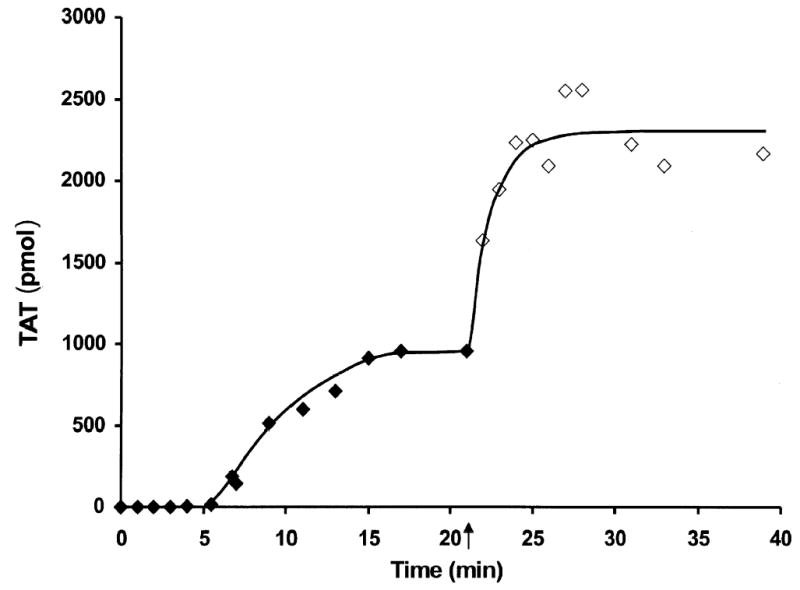
Fig. 4 presents thrombin generation curves for resupply experiments carried out in synthetic plasma in which 2 successive resupply events were conducted. In the synthetic plasma experiments presented, binding sites available for the assembly of procoagulant complexes are limited (2 μM phospholipid) and varied (synthetic PCPS vs platelets). This is in contrast to the presented numerical simulations in which there is no competition for phospholipid binding sites, specialized platelet receptors are not included and the potential contributions of the contents of activated platelets to the resupply reaction are not included.
Fig. 4. Synthetic plasma: Resupply of a reconstituted plasma system after the initial episode of TF-initiated thrombin generation.


Time courses of thrombin generation are shown after initiation with 5 pM TF in the presence of 2 μM PCPS (panel A) or 2 × 10⁸ platelets/mL (panel B). Each reaction was resupplied after 1200 s and again after an additional 1200 s by the addition of an equal volume of the starting material, but no additional TF. Panel A: initial episode (□); 1st resupply (▵); 2nd resupply (⋄). Panel B: initial episode (▪); 1st resupply (▴); 2nd resupply (♦). Arrows indicate resupply times. Thrombin levels are expressed as total moles active thrombin vs time (s) to normalize for volume changes.
Reactions started with a 5 pM TF stimulus were resupplied with an equal volume of unreacted synthetic plasma (proteins and phospholipid) without TF at 1200 s and then again at 2400 s. Panel A presents a representative experiment conducted using PCPS. Key features of the response to resupply are: the absence of a lag phase prior to the onset of thrombin production; and the approximate equivalence of the initial rate of thrombin production observed during the resupply events and that characterizing the initial propagation phase. This occurs despite the 50 % lower concentration of prothrombin available at the onset of each resupply and the successive dilutions of the catalyst pool and points to a stable and increasing catalyst presence. Thus, a thrombin concentration (2 nM) sufficient to reinitiate fibrin formation is achieved in 3 to 4 s compared to the ~ 240 s characteristic of TF-initiated thrombin generation in synthetic plasma with 2 μM PCPS. Panel B depicts the same resupply experimental format but with platelets. In general the pattern of response to resupply is similar to that observed in simulations and in synthetic plasma with PCPS. No lag phase in the onset of thrombin production is apparent and the maximum rates of thrombin generation during both resupply episodes are similar to those observed on PCPS during resupply. As before only a few seconds are required to achieve levels of thrombin which take almost 240 s in the TF-initiated episode.
Overall the synthetic plasma/platelet experiments demonstrate that a stable catalyst pool, a prothrombin activating potential, is generated by the initial episode of TF-initiated thrombin generation. It is able to at least match, when supplied with reactants, the prothrombin activation rates characteristic of the normal propagation phase. Additional TF is not required to form this prothrombin activating potential and the absence of a lag phase argues against a TF dependent mechanism.
Resupply in Whole blood
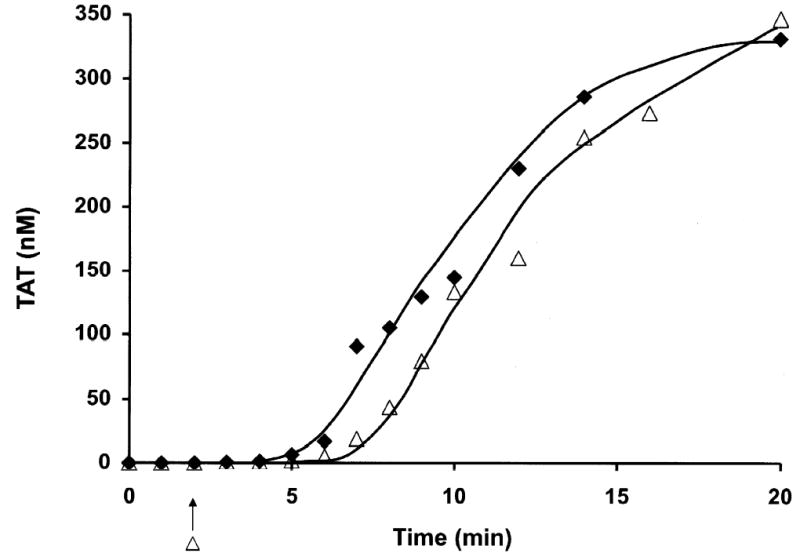
Fig. 5 presents a resupply experiment in contact pathway inhibited whole blood. The time course of TAT formation after stimulation of whole blood with 5 pM TF is presented (♦). A parallel set of whole blood aliquots initiated at the same time were resupplied after 1200 s with an equal volume of blood and TAT levels determined at the indicated times (⋄). The key features of this resupply time course are: the absence of a lag phase in the onset of maximum rate of thrombin generation; a rate of TAT formation ~ 4.5 fold faster than that observed in the initial propagation phase; and sequestration of ~ 93 % of the resupplied prothrombin as TAT complexes compared to 69 % in the TF initiated time course. A similar relationship between initial and resupply rates and final levels of TAT formation are observed in the numerical simulation of this process. Control experiments in which an equal volume of HBS rather than blood was added at the resupply time showed no further alteration in TAT levels over the next 20 min.
Fig. 5. Whole Blood: Resupply of a TF-initiated blood coagulation reaction after the cessation of prothrombin consumption.
A time course of TAT formation is shown after addition of 5 pM TF to contact pathway inhibited whole blood. One set of reactions was quenched at minute intervals over the first 20 min. A parallel set of blood aliquots, exposed to 5 pM TF at the same time, was incubated for 20 min and then each aliquot was resupplied with an equal volume freshly drawn contact pathway inhibited from the same individual. These reactions were then quenched over a span of an additional 20 min at the indicated times. TAT levels are expressed as total picomoles TAT vs time (s) to normalize for volume change. Initial episode (♦); resupply (⋄). The arrow indicates the resupply time.
To further probe the potential TF dependence of thrombin generation during the resupply reaction, inhibitory antibodies to TF and factor VII were added to the ongoing reactions 1 min prior to resupply. These antibodies when added to contact pathway inhibited blood or synthetic plasma prior to TF addition completely quench thrombin generation (e.g. see Fig. 2C (×)). In the presence of these inhibitory antibodies, the same pattern of enhanced rates of TAT formation and increased overall levels of TAT in the resupply event relative to the TF-initiated episode was observed (data not shown).
Active thrombin levels and thrombin inhibitor activity in the termination phase whole blood
When serum derived from whole blood samples that had been quenched with EDTA 1200 or 2400 s after TF stimulation, was assayed for fibrinogen clotting activity, none was observed (clot times > 999 s). The absence of activity over this period indicated that active thrombin levels were below 30 pM, the lower limit for reliable detection of thrombin with this assay. Fluorogenic assays are more sensitive but would be of limited utility in this study because they fail to discriminate against thrombin complexes with α2-macroglobulin. In the numerical simulation presented in Fig 2A the clearance rate of active thrombin, once its accumulation has ceased (460 s), is defined by a t½ of ~ 50 s. The time interval between peak thrombin levels and 1200 s represents over 15 half-lives with predicted residual active thrombin levels falling below 9 pM, consistent with our failure to detect thrombin.
The same sera that were devoid of detectable thrombin were then assayed for the ability to neutralize exogenous thrombin. The decay of the fibrinogen cleaving activity of the added thrombin appeared to be a first order process with a t½ of 42 s (Fig. 6). Similar values were obtained with sera obtained at 1200 and 2400 s. The observation that thrombin half-life was the same in 1200 and 2400 s sera underscores the stability of the inhibitors and their relative abundance relative to their endogenous targets.
Fig. 6. Thrombin inhibiting activity of sera from TF stimulated whole blood.

Thrombin (100 nM) was added to sera derived 2400 s after a 5 pM TF addition to contact pathway inhibited whole blood. Individual reactions were carried out for the indicated times at 37ºC, quenched by dilution and assayed immediately for fibrinogen clotting activity. Data are presented as the concentration of active thrombin present vs the incubation time (s) in the sera. Inset shows a fit of the data assuming thrombin inactivation follows a first order decay.
The significance of these observations is two-fold. The active status of the inhibitor cadre in sera derived from clotting whole blood suggests that all potential targets are being subjected to an ongoing reduction in their concentration. In addition to thrombin, these targets include factor factor Xa and factor IXa, both of which can form complexes with AT-III and other plasma proteinase inhibitors. Thus the final status of the TF-initiated blood coagulation reaction in closed systems remains dynamic with respect to inhibition. Equally, however the resupply experiments identify a catalyst pool that is protected from this ongoing inactivation process.
DISCUSSION
This study illustrates the utility of proceeding from numerically based mechanistic models to experimentation in complex chemical and biological settings. In our experimental protocols we have designed hypotheses based upon computational modeling and then proceeded to design complex chemical systems and ultimately studies of whole blood drawn from a living subject. This approach illustrates the economy of computer-aided design in biological studies.
Data from all three models indicate that functional TF is essential to trigger thrombin generation but not essential for normal thrombin generation once the reactions have proceeded for more than 120 seconds (with a 5 pM TF stimulus). Our data also show that TF-initiated blood coagulation generates an array of products that constitute a stable, TF-independent prothrombin activating potential which requires only resupply of blood, not more TF, to renew immediate, robust prothrombin consumption. While closed systems of TF-initiated blood coagulation are the predominant experimental tool and are accessible to definition at the chemical level, flowing blood represents an open system in which resupply of reactants to a reaction site is an essential component. The resupply experiments provided in this study provide insights into how resupply in an open system can govern the extent of a biological reaction.
In the closed models used in these studies thrombin generation displays operationally defined initiation, propagation and termination phases. Previous work supported the conclusion that during the initiation phase, factors IXa and Xa are initially generated exclusively by the TF-factor VIIa complex (9;34) which produces enough factor Xa to provide the initial amounts of thrombin required to both activate platelets and to activate the procofactors factors V and VIII (9;11;48). This work, however, did not address the issue of what time interval of TF-factor VIIa function was necessary to insure normal thrombin generation. In the current study we show that thrombin generation becomes largely independent of factor TF-factor VIIa activity about halfway into the initiation phase. Partial independence is apparent with significant, albeit delayed, propagation phases when quenching of TF function was carried out at earlier times. Numerical simulations indicate that the onset of independence from the TF stimulus between 10 and 20 s reflects the time required to assemble sufficient TF-factor VIIa complex from the endogenous factor VIIa supply and form the first supply of factor Xa. By 120 s, most of the initially formed TF-factor VIIa complex is found in inactive complex with factor Xa-TFPI. Thus, very early in the reaction the ensemble of products generated is sufficient to insure eventual progression to an amplified phase of thrombin production without the continued input of the TF pathway.
The rapid transition to independence from the initiating complex that characterizes thrombin generation depends on the emergence of the factor VIIIa-factor IXa complex, an event that in blood is contingent on the presence of the surface of activated platelets (49). Previous analyses in our whole blood model (10) showed that the onset of platelet activation occurs between 1 and 2 min post introduction of the TF stimulus. Consistent with this, a propagation phase of normal duration and extent were obtained in the presence of anti-TF and factor VIIa antibodies administered to whole blood 120 s into the reaction.
The termination phase is defined operationally in terms of the cessation of prothrombin consumption and the ongoing inactivation of thrombin and other clotting enzymes. In closed models of blood coagulation, termination of the process begins simultaneously with TF initiation, with the rate of inhibition by endogenous inhibitors catching up with and then surpassing the rates of new enzyme production. This is in part the result of the depletion of zymogens and in part a function of the absolute abundance of the stoichiometric inhibitors of blood such as AT-III, α2-macroglobulin and α1-proteinase inhibitor with respect to catalytic precursors. Our assessment of the remaining inhibitor potential of sera derived from TF-initiated whole blood confirms the presence, stability and efficacy of these inhibitors at times well beyond the cessation of prothrombin consumption. However, our resupply experiments indicate that the termination phase is also characterized by the presence of prothrombin activating potential which persists despite this functioning complement of stoichiometric inhibitors, even in whole blood. The prothrombin activating potential requires no new TF to emerge. Nor does it depend on the presence of residual TF species as evidenced by experiments in which functional TF species are eliminated either mathematically or by the use of inhibitory antibodies. Because of its prothrombin activating potential, the termination phase appears to constitute an idling motor, responding immediately to a new supply of blood. Since this phenomena appears in both our well defined systems (numerical and synthetic plasma) as well as in whole blood, the minimum necessary components must be present in our less complex models. A likely candidate is the prothrombinase complex. However, whether the simpler models fully encompass the makeup and stability of the prothrombin activating potential in whole blood remains to be determined.
The data presented here are consistent with the concept of a two-compartment model for the regulation of the procoagulant response to a breach in a blood vessel (Fig. 7). In this model, regulation of clotting in the extravascular space is primarily passive, controlled by the availability of fresh blood, while regulation in the intravascular compartment is dynamic, involving activation of protein C at the periphery and downstream of the breach and the enhancement of the AT-III inhibition reactions by endothelial cell heparan sulfate proteoglycans (HSPG).
Fig. 7. Schema of a two compartment model of the regulation of TF-initiated blood coagulation.

A cross section of a blood vessel showing the luminal space, endothelial cell layer and extravascular region is presented at the site of a perforation. The blood coagulation process in response is depicted in four stages. Tissue factor-factor VIIa complex, TF•VIIa; prothrombinase complex, Xa•Va; intrinsic factor Xase, VIIIa•IXa; ATIII-endothelial cell heparan sulfate proteoglycan complex bound to thrombin or factor Xa, HS•ATIII•(IIa or Xa); protein C bound to thrombomodulin-thrombin, TM•IIa•PC.
Stage 1. Perforation results in delivery of blood, and with it circulating factor VIIa and platelets, to an extravascular space rich in membrane bound TF. Platelets adhere to collagen and von Willebrand factor associated with the extravascular tissue, and TF binds factor VIIa, initiating the process of factor IX and factor X activation. Factor Xa activates small amounts of prothrombin to thrombin that activates more platelets and converts factor V and factor VIII to factor Va and factor VIIIa.
Stage 2. The reaction is propagated by platelet-bound intrinsic factor Xase and prothrombinase with the former being the principle factor Xa generator. Initial clotting occurs and fibrin begins to fill in the void in cooperation with activated platelets.
Stage 3. A barrier composed of activated platelets ladened with procoagualant complexes and enmeshed in fibrin scaffolding is formed. The reaction in the now filled perforation is terminated by reagent consumption attenuating further thrombin generation but functional procoagulant enzyme complexes persist because they are protected from the dynamic inhibitory processes found on the intravascular face.
Stage 4. View downstream of the perforation. Enzymes escaping from the plugged perforation are captured by antithrombin-heparan complexes and the protein C system is activated by residual thrombin binding to endothelial cell thrombomodulin, initiating the dynamic anticoagulant system. These intravascular processes work against occlusion of the vessel despite the continuous resupply of reactants across the intravascular face of the thrombus.
The fluidity of blood depends on the nonthrombogenic properties of the endothelial cell surface. These surfaces are nonthrombogenic via both passive (the absence of TF, subthreshold levels of phosphatidylserine) and dynamic mechanisms (the presence of thrombomodulin (50), the expression of HSPG that enhance the functions of inhibitors like AT-III (51), the presence of surface-associated TFPI (52) and the secretion of metabolites that actively suppress platelet adhesion (53;54)). Mechanical disruption of a blood vessel results in the movement of blood to an environment where TF is exposed and platelets bind and are activated (Fig. 7, stage 1). These events localize the initiating procoagulant reactions to blood now outside the vasculature with adhesion and activation of platelets in this extravascular blood providing sufficient receptors and phosphatidylserine-rich surfaces to support the propagation phase of thrombin generation (Fig. 7, stage 2). Our data suggest the hypothesis that this extravascular process rapidly becomes TF independent and that it results in the formation of a stable prothrombin activating potential. As long as new blood flows into this space, implying that fibrin formation and platelet aggregation have not achieved a sufficient barrier, the system is open and the propagation phase of thrombin generation will continue. If blood ceases to move into the extravascular compartment the system becomes closed, available prothrombin is consumed and enzymes sequestered into inactive complexes (Fig 7, stage 3). However the stability of the prothrombin activating potential and its localization in the extravascular space insure that if the barrier springs a leak, robust thrombin generation will begin immediately on contact and continue until consequent platelet activation and fibrin deposition reestablish a secure barrier.
Because of the constant resupply by flowing blood, regulation of clotting in the intravascular space contiguous to a point of outflow must involve circumventing the resistance of the prothrombin activating potential to circulating inhibitors (Fig. 7, stage 4). Without such down regulation the clot would grow into the intravascular space blocking flow through the vessel. Two candidate mechanisms include the thrombomodulin dependent activation of protein C by thrombin (55;56) and the actively nonthrombogenic and nonadhesive surface of the vascular endothelium with respect to platelets. Activated protein C (APC) proteolytically inactivates the cofactors factor Va and factor VIIIa, which would suppress formation of the prothrombinase complex and the factor IXa-factor VIIIa complex, the key complexes driving the propagation phase of thrombin generation. Endothelial cells at the periphery of the breach would supply the thrombomodulin, while thrombin would derive from the clot as it expands toward the intravascular compartment. Procoagualant cofactors on the intravascular side of the growing clot would presumably be the most accessible to this APC since this model assumes substantial clot formation as a precondition of delivering thrombin to intravascular thrombomodulin. Thus thrombin generation with consequent ongoing fibrin deposition and platelet activation would be suppressed on the intravascular face by this dynamic process while complexes to the extravascular side remained relatively protected from APC by the forming barrier and thus ready to respond to any leaking through of blood.
In addition to the APC-dependent inactivation of key procoagulant cofactors, suppression of the procoagulant response in the intravascular compartment would be augmented by the presence of endothelial cell HSPG. Heparins, functioning in a catalytic manner, conformationally activate AT-III, increasing its reactivity with thrombin (~ 103 fold), factor Xa (~ 102 fold) and factor IXa (~106 fold) (57;58). The consequences of enhanced thrombin suppression include depressed fibrin formation and relative deficits in cofactor activation and newly formed activated platelet surface. Increased rates of factor Xa and factor IXa inhibition would also contribute to reduce the potential to form new procoagulant complexes. HSPG enhancement of ATIII reactivity would limit both the availability of key protein components and the required procoagulant surface. The combination in the intravascular compartment of enhanced AT-III reactivity and the generation of APC would suppress clot growth on the intravascular face despite the continual resupply of reactants.
We have previously reported the absence of a propagation phase of thrombin generation in several models of induced hemophilia and in contact pathway inhibited whole blood from individuals with hemophilia (38;59;60). Resupply experiments conducted in both mathematical and empirical models of hemophilia do not display the immediate and robust thrombin formation observed in the fully constituted systems presented in this study (data not shown). Instead, upon resupply at 1200 s, the rate of thrombin generation was essentially unchanged. This inability of TF-initiated “hemophilia blood” to drive the formation of the prothrombin activating potential to levels sufficient to generate a burst of thrombin generation in response to a resupply event may represent part of the explanation for why hemophiliacs bleed.
Collectively the results of this study and our previous work argue that there is no active TF in the blood of healthy individuals (30;31) and that such a reservoir of TF is not needed to sustain coagulation. This is because the required duration of TF function to achieve a propagating phase of thrombin generation is brief and because the termination phase of TF-initiated blood coagulation represents a quiescent state that requires resupply not re-initiation.
Acknowledgments
We thank Drs. S.L. Liu, R. Lundblad, U. Hedner, K. Johnson and W. Ruf for providing us with recombinant proteins and M. Gissel, M. Whelihan, R. Cooley and C. Partin for their technical assistance.
Footnotes
Portions of this work were presented at the 46th annual meeting of the American Society of Hematology, San Diego, CA, December 4–7, 2004.
This work was supported by National Institutes of Health grant to K.G.M.: PPG HL46703 (Project 1 from NIH).
References
- 1.Spicer EK, Horton R, Bloem L, Bach R, Williams KR, Guha A, Kraus J, Lin TC, Nemerson Y, Konigsberg WH. Proc Natl Acad Sci USA. 1987;84:5148–5152. doi: 10.1073/pnas.84.15.5148. [DOI] [PMC free article] [PubMed] [Google Scholar]
- 2.Ruf W, Rehemtulla A, Morrissey JH, Edgington TS. J Biol Chem. 1991;266:16256. [PubMed] [Google Scholar]
- 3.Komiyama Y, Pedersen AH, Kisiel W. Biochemistry. 1990;29:9418–9425. doi: 10.1021/bi00492a016. [DOI] [PubMed] [Google Scholar]
- 4.Bjoern S, Foster DC, Thim L, Wiberg FC, Christensen M, Komiyama Y, Pedersen AH, Kisiel W. J Biol Chem. 1991;266:11051–11057. [PubMed] [Google Scholar]
- 5.Nemerson Y. Blood. 1988;71:1–8. [PubMed] [Google Scholar]
- 6.Morrissey JH. Thromb Haemost. 2001;86:66–74. [PubMed] [Google Scholar]
- 7.Edgington TS, Mackman N, Brand K, Ruf W. Thromb Haemost. 1991;66:67–79. [PubMed] [Google Scholar]
- 8.Mann KG, Butenas S, Brummel KE. Arterioscler Thromb Vasc Biol. 2003;23:17–25. doi: 10.1161/01.atv.0000046238.23903.fc. [DOI] [PubMed] [Google Scholar]
- 9.Butenas S, van’t Veer C, Mann KG. J Biol Chem. 1997;272:21527–21533. doi: 10.1074/jbc.272.34.21527. [DOI] [PubMed] [Google Scholar]
- 10.Brummel KE, Paradis SG, Butenas S, Mann KG. Blood. 2002;100:148–152. doi: 10.1182/blood.v100.1.148. [DOI] [PubMed] [Google Scholar]
- 11.Lawson JH, Kalafatis M, Stram S, Mann KG. J Biol Chem. 1994;269:23357–23366. [PubMed] [Google Scholar]
- 12.van’t Veer C, Mann KG. J Biol Chem. 1997;272:4367–4377. doi: 10.1074/jbc.272.7.4367. [DOI] [PubMed] [Google Scholar]
- 13.Rand MD, Lock JB, van’t Veer C, Gaffney DP, Mann KG. Blood. 1996;88:3432–3445. [PubMed] [Google Scholar]
- 14.van’t Veer C, Mann KG. J Biol Chem. 1997;272:4367–4377. doi: 10.1074/jbc.272.7.4367. [DOI] [PubMed] [Google Scholar]
- 15.Wun TC, Kretzmer KK, Girard TJ, Miletich JP, Broze GJ., Jr J Biol Chem. 1988;263:6001–6004. [PubMed] [Google Scholar]
- 16.Novotny WF, Palmier M, Wun TC, Broze GJ, Jr, Miletich JP. Blood. 1991;78:394–400. [PubMed] [Google Scholar]
- 17.Broze GJ, Jr, Warren LA, Novotny WF, Higuchi DA, Girard JJ, Miletich JP. Blood. 1988;71:335–343. [PubMed] [Google Scholar]
- 18.Jesty J, Wun TC, Lorenz A. Biochemistry. 1994;33:12686–12694. doi: 10.1021/bi00208a020. [DOI] [PubMed] [Google Scholar]
- 19.Baugh RJ, Broze GJ, Jr, Krishnaswamy S. J Biol Chem. 1998;273:4378–4386. doi: 10.1074/jbc.273.8.4378. [DOI] [PubMed] [Google Scholar]
- 20.Huang ZF, Higuchi D, Lasky N, Broze GJ., Jr Blood. 1997;90:944–951. [PubMed] [Google Scholar]
- 21.Diamant M, Nieuwland R, Pablo RF, Sturk A, Smit JW, Radder JK. Circulation. 2002;106:2442–2447. doi: 10.1161/01.cir.0000036596.59665.c6. [DOI] [PubMed] [Google Scholar]
- 22.Siddiqui FA, Desai H, Amirkhosravi A, Amaya M, Francis JL. Platelets. 2002;13:247–253. doi: 10.1080/09537100220146398. [DOI] [PubMed] [Google Scholar]
- 23.Giesen PL, Rauch U, Bohrmann B, Kling D, Roque M, Fallon JT, Badimon JJ, Himber J, Riederer MA, Nemerson Y. Proc Natl Acad Sci USA. 1999;96:2311–2315. doi: 10.1073/pnas.96.5.2311. [DOI] [PMC free article] [PubMed] [Google Scholar]
- 24.Takahashi H, Satoh N, Wada K, Takakuwa E, Seki Y, Shibata A. Am J Hematol. 1994;46:333–337. doi: 10.1002/ajh.2830460414. [DOI] [PubMed] [Google Scholar]
- 25.So AK, Varisco PA, Kemkes–zMatthes B, Herkenne-Morard C, Chobaz-Peclat V, Gerster JC, Busso N. J Thromb Haemost. 2003;1:2510–2515. doi: 10.1111/j.1538-7836.2003.00462.x. [DOI] [PubMed] [Google Scholar]
- 26.Bogdanov VY, Balasubramanian V, Hathcock J, Vele O, Lieb M, Nemerson Y. Nat Med. 2003;9:458–462. doi: 10.1038/nm841. [DOI] [PubMed] [Google Scholar]
- 27.Falati S, Liu Q, Gross P, Merrill-Skoloff G, Chou J, Vandendries E, Celi A, Croce K, Furie BC, Furie B. J Exp Med. 2003;197:1585–1598. doi: 10.1084/jem.20021868. [DOI] [PMC free article] [PubMed] [Google Scholar]
- 28.Santucci RA, Erlich J, Labriola J, Wilson M, Kao KJ, Kickler TS, Spillert C, Mackman N. Thromb Haemost. 2000;83:445–454. [PubMed] [Google Scholar]
- 29.Berckmans RJ, Neiuwland R, Boing AN, Romijn FP, Hack CE, Sturk A. Thromb Haemost. 2001;85:639–646. [PubMed] [Google Scholar]
- 30.Butenas S, Mann KG. Nat Med. 2004;10:1155–1156. doi: 10.1038/nm1104-1155b. [DOI] [PubMed] [Google Scholar]
- 31.Butenas S, Bouchard BA, Brummel-Ziedins KE, Parhami-Seren B, Mann KG. Blood. 2005;105:2764–2770. doi: 10.1182/blood-2004-09-3567. [DOI] [PubMed] [Google Scholar]
- 32.Day SM, Reeve JL, Pedersen B, Farris DM, Myers DD, Im M, Wakefield TW, Mackman N, Fay WP. Blood. 2005;105:192–198. doi: 10.1182/blood-2004-06-2225. [DOI] [PubMed] [Google Scholar]
- 33.Jones KC, Mann KG. J Biol Chem. 1994;269:23367–23373. [PubMed] [Google Scholar]
- 34.Hockin MF, Jones KC, Everse SJ, Mann KG. J Biol Chem. 2002;277:18322–18333. doi: 10.1074/jbc.M201173200. [DOI] [PubMed] [Google Scholar]
- 35.Bajaj SP, Rapaport SI, Prodanos C. Prep Biochem. 1981;11:397–412. doi: 10.1080/00327488108065531. [DOI] [PubMed] [Google Scholar]
- 36.Katzmann JA, Nesheim ME, Hibbard LS, Mann KG. Proc Natl Acad Sci USA. 1981;78:162–166. doi: 10.1073/pnas.78.1.162. [DOI] [PMC free article] [PubMed] [Google Scholar]
- 37.Griffith MJ, Noyes CM, Church FC. J Biol Chem. 1985;260:2218–2225. [PubMed] [Google Scholar]
- 38.Cawthern KM, van’ V, Lock JB, DiLorenzo ME, Branda RF, Mann KG. Blood. 1998;91:4581–4592. [PubMed] [Google Scholar]
- 39.Higgins DL, Mann KG. J Biol Chem. 1983;258:6503–6508. [PubMed] [Google Scholar]
- 40.Butenas S, Orfeo T, Gissel MT, Brummel KE, Mann KG. J Biol Chem. 2004;279:22875–22882. doi: 10.1074/jbc.M400531200. [DOI] [PubMed] [Google Scholar]
- 41.Mustard JF, Perry DW, Ardlie NG, Packham MA. Br J Haematol. 1972;22:193–204. doi: 10.1111/j.1365-2141.1972.tb08800.x. [DOI] [PubMed] [Google Scholar]
- 42.Lundblad RL, Kingdon HS, Mann KG. Methods Enzymol. 1976;45:156–176. doi: 10.1016/s0076-6879(76)45017-6. [DOI] [PubMed] [Google Scholar]
- 43.Lu G, Broze GJ, Jr, Krishnaswamy S. J Biol Chem. 2004;279:17241–17249. doi: 10.1074/jbc.M312827200. [DOI] [PubMed] [Google Scholar]
- 44.Hojima Y, Pierce JV, Pisano JJ. Thromb Res. 1980;20:149–162. doi: 10.1016/0049-3848(80)90381-3. [DOI] [PubMed] [Google Scholar]
- 45.Brummel-Ziedins KE, Pouliot RL, Mann KG. J Thromb Haemost. 2004;2:281–288. doi: 10.1046/j.1538-7933.2003.00576.x. [DOI] [PubMed] [Google Scholar]
- 46.Orfeo, T., Brufatto, N., Nesheim, M. E., Xu, H., Butenas, S., and Mann, K. G. (2004) J.Biol.Chem. [DOI] [PubMed]
- 47.Miletich JP, Jackson CM, Majerus PW. J Biol Chem. 1978;253:6908–6916. [PubMed] [Google Scholar]
- 48.van’t Veer C, Golden NJ, Kalafatis M, Mann KG. J Biol Chem. 1997;272:7983–7994. doi: 10.1074/jbc.272.12.7983. [DOI] [PubMed] [Google Scholar]
- 49.Ahmad SS, Walsh PN. Biochemistry. 2002;41:11269–11276. doi: 10.1021/bi025785v. [DOI] [PubMed] [Google Scholar]
- 50.Esmon CT, Owen WG. Proc Natl Acad Sci USA. 1981;78:2249–2252. doi: 10.1073/pnas.78.4.2249. [DOI] [PMC free article] [PubMed] [Google Scholar]
- 51.Busch C, Owen WG. J Clin Invest. 1982;69:726–729. doi: 10.1172/JCI110502. [DOI] [PMC free article] [PubMed] [Google Scholar]
- 52.Broze GJ., Jr Thromb Haemost. 1995;74:90–93. [PubMed] [Google Scholar]
- 53.Moncada S, Higgs EA, Vane JR. Lancet. 1977;1:18–20. doi: 10.1016/s0140-6736(77)91655-5. [DOI] [PubMed] [Google Scholar]
- 54.Radomski MW, Palmer RM, Moncada S. Biochem Biophys Res Commun. 1987;148:1482–1489. doi: 10.1016/s0006-291x(87)80299-1. [DOI] [PubMed] [Google Scholar]
- 55.Esmon CT. Chest. 2003;124:26S–32S. doi: 10.1378/chest.124.3_suppl.26s. [DOI] [PubMed] [Google Scholar]
- 56.Esmon CT. J Biol Chem. 1989;264:4743–4746. [PubMed] [Google Scholar]
- 57.Chuang YJ, Swanson R, Raja SM, Olson ST. J Biol Chem. 2001;276:14961–14971. doi: 10.1074/jbc.M011550200. [DOI] [PubMed] [Google Scholar]
- 58.Bedsted T, Swanson R, Chuang YJ, Bock PE, Bjork I, Olson ST. Biochemistry. 2003;42:8143–8152. doi: 10.1021/bi034363y. [DOI] [PubMed] [Google Scholar]
- 59.Butenas S, Brummel KE, Paradis SG, Mann KG. Arterioscler Thromb Vasc Biol. 2003;23:123–129. doi: 10.1161/01.atv.0000042081.57854.a2. [DOI] [PubMed] [Google Scholar]
- 60.Butenas S, Brummel KE, Branda RF, Paradis SG, Mann KG. Blood. 2002;99:923–930. doi: 10.1182/blood.v99.3.923. [DOI] [PubMed] [Google Scholar]