

Abstract
To test the impact of environments on genome evolution, we analysed the relative abundance of the nucleotides guanine and cytosine (‘GC content') of large numbers of sequences from four distinct environmental samples (ocean surface water, farm soil, an acidophilic mine drainage biofilm and deep-sea whale carcasses). We show that the GC content of complex microbial communities seems to be globally and actively influenced by the environment. The observed nucleotide compositions cannot be easily explained by distinct phylogenetic origins of the species in the environments; the genomic GC content may change faster than was previously thought, and is also reflected in the amino-acid composition of the proteins in these habitats.
Keywords: ecology, environment, evolution, GC content, metagenomics
Introduction
The relative abundance of the nucleotides guanine and cytosine (‘GC content') varies widely between genomes of different species and even between entire phyla (Sueoka, 1962). However, it is unclear whether this is due to intrinsic, organism-specific mechanisms or external factors, and whether it is the result of neutral processes or selection. Several hypotheses have been put forward to explain variations in the GC content of organisms, some of which are controversial (discussed by Bentley & Parkhill, 2004). These hypotheses are often based on observed, simple correlations of GC content with another (intrinsic or extrinsic) measure. One of the intrinsic correlations is a tendency of large genomes to be GC rich and small genomes to be GC poor (Heddi et al, 1998; Moran, 2002; Rocha & Danchin, 2002). Because large genomes are presumably found in more complex, variable environments, there could be an indirect link between GC content and niche complexity. One possible reason for this is the higher cost of synthesis of ATP than of UDP (in complex environments, growth and ATP synthesis are presumed to be slower). The need for being able to quickly mobilize ATP may also have a role in the case of small genomes (Rocha & Danchin, 2002). As random mutations of DNA are mainly the conversion from C to T and from G to A, the lack of repair mechanisms in reduced genomes could also be a reason for small genomes being AT rich (Glass et al, 2000). Another factor could be the preferred growth temperature of an organism, which has been proposed to correlate with GC content (Musto et al, 2004), but this is under debate (Marashi & Ghalanbor, 2004; Musto et al, 2005). Growth temperature is known to correlate with polypurine (AG) tracts in messenger RNAs (Lobry & Chessel, 2003; Paz et al, 2004). Although this alone does not preclude a correlation with GC, it would disfavour extreme GC levels in thermophilic organisms. It has been observed that genomes of some nitrogen-fixing organisms contain a higher fraction of guanine and cytosine than the genomes of nonfixing species of the same genus (McEwan et al, 1998). Likewise, Naya et al (2002) put forward a connection between an aerobic lifestyle and an increased GC content.
However, most of the above correlations are not very strong, and could obviously be merely indirect consequences of other, as yet unknown, factors that influence genomic GC content more directly. Another complication is that, so far, the field has focused on available genome sequences, which are derived from single isolates from a wide variety of environments. This has precluded the analysis of community effects (in natural settings, microbes may live in large communities of hundreds or thousands of different species), and of global influences of the environment. In addition, it neglects the large fraction of environmental microbes that resist cultivation in the laboratory (Staley & Konopka, 1985). Only recently, random shotgun sequence data from environmental DNA preparations have become available, allowing an unbiased view on the genomic characteristics of an entire environmental community. Here we show, using the large-scale data from Sargasso Sea surface water (Venter et al, 2004), from a biofilm in an underground acid drainage mine (Tyson et al, 2004) as well as from farm soil and deep-sea whale carcasses (Tringe et al, 2005), that the environment indeed has a considerable impact on GC content and implicitly also on the amino-acid composition of the proteins in a habitat.
Results
Unexpected GC-content distributions in environments
To obtain a representative, quantitative estimate of the environmental GC-content distribution, raw sequencing reads were analysed (not the assembled contigs). However, analysis of raw sequencing reads may generate some inaccuracies, as they can contain regions of poor sequencing quality. Therefore, consistency checks of increasing stringency were executed, invariably confirming the initial GC-content distributions, whether by limiting the analysis to open reading frames with clear homology, or even to a restricted set of translation-related marker genes (see Methods for details).
Owing to the large amounts of DNA (numerous independent reads totalling more than 100 Mbp for each of the four habitats), the GC-content patterns are very robust, and (sub)samples from similar environments tend to have similar GC-content patterns (Fig 1A). Surprisingly, the samples from farm soil and ocean surface water—both of which contain DNA from more than 1,000 diverse, non-abundant species (Venter et al, 2004; Tringe et al, 2005)—are very different, with the surface water sample having a GC-content median of around 34% and the soil sample around 61%. To test whether these differences are simply the result of distinct phylogenetic compositions of the samples, we estimated the GC-content distribution that the environments were expected to have, on the basis of the known abundances of the various phyla and the GC content of previously known genomes from these phyla. Both water and soil samples deviated strongly from expectations (Fig 1B; supplementary Fig 1 online; expected distributions were estimated by re-creating the communities from known genomes and matching the reported phylogenetic compositions). Strikingly, the GC content in these two complex environments is more narrowly distributed than that of most bacterial phyla, which is unexpected as the environments contain species from many phyla and should therefore have an even broader distribution than the 162 completely sequenced genomes known today (see bottom of Fig 1A for comparison). In addition, we observe that GC-content differences exist even for closely related sequences (Fig 2B), suggesting an active, continuing process.
Figure 1.

Guanine and cytosine content of environmental sequences. Guanine and cytosine content distributions and predicted frequencies of amino acids in four environments (eight subsamples in total, all containing >90% prokaryotic species), compared with completely sequenced prokaryotic genomes grouped into phyla and subphyla. The trees depict the relationships between the samples (Tringe et al, 2005), and between phyla and subphyla to which the genomes belong. The number of sequenced genomes available for each taxonomic group is given in parentheses. Only phyla with at least three completely sequenced genomes have been included, and only those environmental sequence fragments that contain at least one predicted open reading frame with significant similarity to a known gene (60 bits or better) are shown. (A) Relative distributions of Guanine and cytosine (GC) content values, averaged over individual sequence reads. For comparability, virtual reads were generated for completely sequenced genomes. The darker the colour, the higher the number of reads with the respective GC content. Vertical dashed lines denote the average value of each sample/group. (B) Comparison of the GC distribution of Sargasso Sea reads (subsamples #2–#4) with (i) a subset that contains only translation genes occurring once per genome and (ii) with a simulated sample derived from completely sequenced genomes and selected to contain the same distribution of phyla. Translation genes show a distribution similar to the whole set, indicating that no bias is introduced by gene content (larger genomes may contain many genes with unusual GC content); the deviation from the simulated sample shows that GC content is apparently not always a simple function of the broad phylogenetic distribution of the species in an environment. (C) Frequencies of the amino acids lysine and alanine among encoded proteins. Notice the dependency on GC content (for other amino acids, as well as a compound index, see supplementary Table 1 online).
Figure 2.
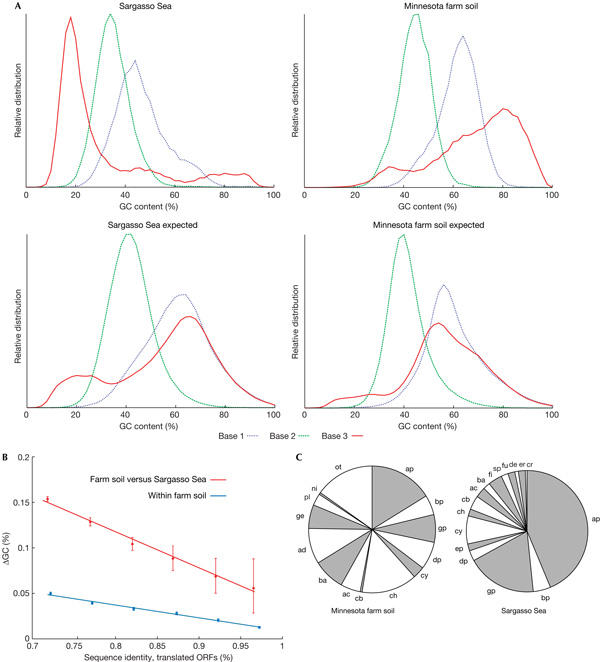
Guanine and cytosine content analysis of open reading frames. (A) Deviation from expectation. Guanine and cytosine (GC) content distributions are shown for each environmental sample, separately for each codon position. The curves are compared with the expected distributions; the latter were derived from known genomes by sampling their DNA in amounts matching the overall phylogenetic compositions reported for the samples. (B) GC-content differences for paired open reading frames (ORFs) of high sequence similarity (that is, recent divergence). ORFs were paired on the basis of reciprocal best matches in BLAST searches (see supplementary Figure 3 online for more details). Error bars denote 90% confidence intervals of the mean. (C) Phylogenetic distributions of organisms, as reported from 16S ribosomal RNA analysis, for two principal samples. Note the wide range of phyla present. ac, Actinobacteria; ad, Acidobacteria; ap, α-Proteobacteria; ba, Bacteriodetes; bp, β-Proteobacteria; cb, Chlorobi; ch, Chloroflexi; cr, Crenarchaeota; cy, Cyanobacteria; de, Deinococcus-Thermus; dp, δ-Proteobacteria; ep, ɛ-Proteobacteria; er, Eryarchaeota; fi, Firmicutes; fu, Fusobacteria; ge, Gemmatimonadetes; gp, γ-Proteobacteria; ni, Nitrospira; ot, others; pl, Planctomycetes; sp, Spirochaetes.
The above trends are weaker for the acidic biofilm and the whale carcasses, but these environments are much younger (far less than 100 years old; Tyson et al, 2004; Tringe et al, 2005), and seem to contain only a few species.
Unconstrained nucleotides show the largest differences
To avoid possible biases due to habitat-specific, perhaps unusual, features of non-coding DNA and to measure functional constraints, we restricted the analysis to the open reading frames themselves (of length 150 codons or longer; Fickett, 1995), and analysed the GC-content distribution separately for each of the three codon positions. We found that the third codon position is even more extreme with respect to GC distribution than the average of all three positions (Fig 2, the median in farm soil is 74%, versus 24% in the ocean surface water). The third codon position is relatively free to evolve (owing to the degeneracy of the genetic code), and its extreme GC-content distribution suggests that the process that drives GC-content changes is (at least to some extent) kept in check by coding requirements.
Global differences in amino-acid usage in proteins
The overall frequencies of the various amino acids in encoded proteins are known to vary with changes in overall GC content in microbial genomes (Sueoka, 1961). To confirm and assess this dependency in the case of environmental communities, we globally counted amino acids in predicted proteins, and computed the relative fraction of each amino acid in the various samples (Fig 1C; supplementary Table 1 online). The following amino acids are encoded by AT-rich codons, and are thus expected to be over-represented in low-GC environments: F, Y, M, I, N and K. Conversely, the following amino acids are expected to be over-represented in high-GC environments: G, A, R and P. The abundance ratio of the two groups (the so-called ‘FYMINK/GARP' index; Foster et al, 1997) correlates inversely with overall GC content, as expected (supplementary Table 1 online).
Discussion
Environmental microbial communities seem to show distinct, and unexpectedly narrow, GC-content distributions. The observed GC patterns are not simply a result of differing species compositions in each environment, as simulations of these compositions using sequenced genomes with the same phylogenetic distribution results in distinct GC patterns (see Fig 1B for a striking example; also see supplementary Fig 1 online). Even closely related sequences, when they are from different environments, show marked differences in GC content, more so than when they are from the same environment (Fig 2B). We can exclude an impact of certain enriched gene families, because the differences remain when the analysis is restricted to a set of essential genes that occur only once per genome and are present in each environment (Fig 1B; supplementary Fig 1 online). However, we cannot completely rule out effects due to differences in experimental protocols (such as DNA preparation or cloning). A weak correlation between genome size and GC content (Moran, 2002; supplementary Fig 2 online) might reflect one possible environmental impact: genomes in ocean surface water are smaller than in soil (Venter et al, 2004; Tringe et al, 2005). In any case, the narrow distributions of the GC content in complex habitats indicate that mainly external environmental factors influence the GC nucleotide composition of a community, either selectively or by causing a directed, mechanistic mutational bias. These factors have to be more global than the previously suggested lifestyle influences (Bentley & Parkhill, 2004), such as the use of oxygen as an energy source (Naya et al, 2002), the ability to fix nitrogen (McEwan et al, 1998) or differences in effective population size (Moran, 1996; also see supplementary Fig 4 online). One possibility would be ultraviolet irradiation, which is particularly high in surface water, to the extent that it influences bacterioplankton productivity (Herndl et al, 1993). Whatever is causing the differences in GC content, it could either actively change the GC content of the existing organisms in an environment, or alternatively, it could limit the type of microbes that can successfully populate an environment in the first place. Genome-wide changes of GC content are thought to occur on relatively slow timescales—1% of change in CG content is projected to require about 3 Mio years (Haywood-Farmer & Otto, 2003). In contrast, microbial communities are presumably broken up and re-assembled on much shorter timescales (open oceans, for example, have strong water currents—with global ocean mixing occurring fast, in only a few centuries; Stuiver et al, 1984). This would argue that community GC-content patterns originate at the time of community assembly, by selective pressures restricting the set of appropriate organisms from a larger pool of available organisms. Supporting this, we observe (in all environments tested) that the distribution of GC content is much more narrow than the GC content of a simple, unbiased mix of all prokaryotes known at present (Fig 1A).
The observed GC-content differences have a direct impact on the amino-acid composition of proteins in the respective environments (Fig 1C), a correlation (Sueoka, 1961) that is well established for individual genomes (Bharanidharan et al, 2004), and that can now be extended to the genetic material of whole communities. GC-rich communities contain more amino acids encoded by GC-rich codons, whereas the opposite is true for GC-poor communities (Fig 1C; supplementary Table 1 online). Considering the relatively young age of any given microbial community, it seems that the local amino-acid usage fluctuates rapidly, complementary to a drift at evolutionary timescales that has been observed recently (Jordan et al, 2005).
Methods
Data. At the time of this study, four distinct environments had been analysed through cultivation-independent, large-scale DNA shotgun sequencing (‘large scale' being arbitrarily defined as more than 100 Mbp of raw sequence): surface sea water from the Sargasso Sea (Venter et al, 2004); a pair of deep-sea whale carcasses (‘whale fall') from distinct geographic locations (Tringe et al, 2005); an acidophilic biofilm from an underground mine drainage flow (Tyson et al, 2004); and agricultural surface soil from a farm in Minnesota (Tringe et al, 2005). Collectively, more than 2 Gbp of sequence data are available, and they provide the first opportunity for an unbiased assessment of the nucleotide composition of community DNA, because previous DNA collections (PCR based or cultivation dependent) can be assumed to have substantial experimental bias (Suzuki & Giovannoni, 1996). For all four environments, most of the sequences found (>90%) were from prokaryotic organisms, together with an unknown fraction of associated bacteriophages (but phage DNA did not influence the results; see below for specific tests).
Sargasso Sea surface ocean water. For this environment, a total of 1,986,782 raw sequencing reads are available (Venter et al, 2004) from seven different water samples (∼2 Gbp of raw sequence). We chose to limit the analysis to samples #2–#4, constituting about 51% of the data, for two reasons: sample #1 is somewhat controversial (Delong, 2005), being the only sample that contains several dominating species—large fractions of their complete genomes could actually be assembled from the data. These dominating species showed a suspiciously low number of polymorphisms, and were not re-discovered in an independent sample from the same site. Therefore, it cannot be excluded that sample #1 has a certain fraction of clonally expanded, contaminating microbes—which is why it was omitted here. Samples #5–#7 were omitted because they had undergone various changes in filtering regimes (some selecting for large particle sizes only), and because they were not used for the assembly in the original publication.
Minnesota farm surface soil. This data set consists of 198,529 raw sequencing reads (220 Mbp). However, the library preparation procedure that was applied to this sample included an amplification step, resulting in several clones with identical inserts. After removal of this redundancy, 149,139 sequencing reads remained, which were used for the present analysis.
Acidic mine drainage biofilm. In all, 124,805 raw sequencing reads have been generated for this sample (Tyson et al, 2004), totalling about 124 Mbp of sequence. The original publication focused mainly on those reads that contributed to genome assembly, but for this study all reads were considered, independent of assembly.
Deep-sea whale carcasses (‘whale fall'). Three subsamples have been analysed (Tringe et al, 2005), from two distinct carcasses, generating a total of 116,464 raw sequencing reads. The two carcasses are from distinct geographic locations, several thousand miles apart.
All four environments vary with respect to the relative abundance and diversity of the bacterial species they contain. This leads to marked differences in the extent to which the raw reads could be assembled into larger contigs. The most extensive assembly was reported for the acid mine drainage community—here, more than two-thirds of the sequencing reads could be assembled into contigs (enabling the almost complete assembly of five genomes). At the other extreme, less than 1% of the soil sequences could be assembled (arguing for a very large diversity of species in the soil). The other two environments were between these two extremes: assembly rates were about 60% and 45% for the Sargasso Sea data and the whale-fall data, respectively.
GC-content distributions. Generally, GC content was measured separately for each read, and all the values for an entire sample were then binned and plotted as a relative distribution of GC content. This indicates that the ‘window size' of the GC-content measurement was equivalent to the average read length (between 900 and 1,100 bp, depending on sample). As a first consistency check, the analysis was limited to reads that showed an unequivocal homology to a known protein (scoring at least 60 bits in BLAST searches), or had been properly assembled into a longer contig that showed such homology (Fig 1A,B; supplementary Fig 1 online). This procedure filtered out reads of overall poor quality. As a second check, the analysis was further restricted to sequences that were clearly homologous to a set of 61 marker genes known to be present in all prokaryotic genomes studied so far, usually as single-copy genes (Fig 1B; supplementary Fig 1 online). This ensured that the result was not influenced by gene families of unknown or peripheral function that are potentially more amenable to horizontal transfer. The check also excluded any influence of bacteriophages, because the set of 61 marker genes—mainly ribosomal and translation-related genes—is usually absent from phages and viruses.
Expected GC-content distributions. For each environmental data set, the approximate phylogenetic distribution of organisms was known (from marker genes or ribosomal RNA sequences). This allowed the computation of an expected GC-content distribution on the basis of traditional genome sequences, as follows: expected distributions were generated by sampling—from the 163 complete prokaryotic genome sequences in the STRING database (von Mering et al, 2005)—DNA fragments of lengths comparable with raw sequencing reads (a further two recent genomes were included to cover phyla that are not yet represented in STRING). The various phyla to be sampled were weighted to match the phylum distribution of the environmental sample studied (within each phylum, genomes were sampled evenly). From the sampled reads, the GC-content distributions were derived exactly in the same way as for the environments (Fig 1B; supplementary Fig 1 online).
Supplementary information is available at EMBO reports online (http://www.emboreports.org).
Supplementary Material
Supplementary Information
Acknowledgments
This work was supported by the European Union, grant no. LSHG-CT-2003-503265. S.D.H. was supported by the Knut and Alice Wallenberg foundation.
References
- Bentley SD, Parkhill J (2004) Comparative genomic structure of prokaryotes. Annu Rev Genet 38: 771–792 [DOI] [PubMed] [Google Scholar]
- Bharanidharan D, Bhargavi GR, Uthanumallian K, Gautham N (2004) Correlations between nucleotide frequencies and amino acid composition in 115 bacterial species. Biochem Biophys Res Commun 315: 1097–1103 [DOI] [PubMed] [Google Scholar]
- Delong EF (2005) Microbial community genomics in the ocean. Nat Rev Microbiol 6: 459–469 [DOI] [PubMed] [Google Scholar]
- Fickett JW (1995) ORFs and genes: how strong a connection? J Comput Biol 2: 117–123 [DOI] [PubMed] [Google Scholar]
- Foster PG, Jermiin LS, Hickey DA (1997) Nucleotide composition bias affects amino acid content in proteins coded by animal mitochondria. J Mol Evol 44: 282–288 [DOI] [PubMed] [Google Scholar]
- Glass JI, Lefkowitz EJ, Glass JS, Heiner CR, Chen EY, Cassell GH (2000) The complete sequence of the mucosal pathogen Ureaplasma urealyticum. Nature 407: 757–762 [DOI] [PubMed] [Google Scholar]
- Haywood-Farmer E, Otto SP (2003) The evolution of genomic base composition in bacteria. Evol Int J Org Evol 57: 1783–1792 [DOI] [PubMed] [Google Scholar]
- Heddi A, Charles H, Khatchadourian C, Bonnot G, Nardon P (1998) Molecular characterization of the principal symbiotic bacteria of the weevil Sitophilus oryzae: a peculiar G+C content of an endocytobiotic DNA. J Mol Evol 47: 52–61 [DOI] [PubMed] [Google Scholar]
- Herndl GJ, Mullerniklaus G, Frick J (1993) Major role of ultraviolet-B in controlling bacterioplankton growth in the surface-layer of the ocean. Nature 361: 717–719 [Google Scholar]
- Jordan IK, Kondrashov FA, Adzhubei IA, Wolf YI, Koonin EV, Kondrashov AS, Sunyaev S (2005) A universal trend of amino acid gain and loss in protein evolution. Nature 433: 633–638 [DOI] [PubMed] [Google Scholar]
- Lobry JR, Chessel D (2003) Internal correspondence analysis of codon and amino-acid usage in thermophilic bacteria. J Appl Genet 44: 235–261 [PubMed] [Google Scholar]
- Marashi SA, Ghalanbor Z (2004) Correlations between genomic GC levels and optimal growth temperatures are not ‘robust'. Biochem Biophys Res Commun 325: 381–383 [DOI] [PubMed] [Google Scholar]
- McEwan CE, Gatherer D, McEwan NR (1998) Nitrogen-fixing aerobic bacteria have higher genomic GC content than non-fixing species within the same genus. Hereditas 128: 173–178 [DOI] [PubMed] [Google Scholar]
- Moran NA (1996) Accelerated evolution and Muller's rachet in endosymbiotic bacteria. Proc Natl Acad Sci USA 93: 2873–2878 [DOI] [PMC free article] [PubMed] [Google Scholar]
- Moran NA (2002) Microbial minimalism: genome reduction in bacterial pathogens. Cell 108: 583–586 [DOI] [PubMed] [Google Scholar]
- Musto H, Naya H, Zavala A, Romero H, Alvarez-Valin F, Bernardi G (2004) Correlations between genomic GC levels and optimal growth temperatures in prokaryotes. FEBS Lett 573: 73–77 [DOI] [PubMed] [Google Scholar]
- Musto H, Naya H, Zavala A, Romero H, Alvarez-Valin F, Bernardi G (2005) The correlation between genomic G+C and optimal growth temperature of prokaryotes is robust: a reply to Marashi and Ghalanbor. Biochem Biophys Res Commun 330: 357–360 [DOI] [PubMed] [Google Scholar]
- Naya H, Romero H, Zavala A, Alvarez B, Musto H (2002) Aerobiosis increases the genomic guanine plus cytosine content (GC%) in prokaryotes. J Mol Evol 55: 260–264 [DOI] [PubMed] [Google Scholar]
- Paz A, Mester D, Baca I, Nevo E, Korol A (2004) Adaptive role of increased frequency of polypurine tracts in mRNA sequences of thermophilic prokaryotes. Proc Natl Acad Sci USA 101: 2951–2956 [DOI] [PMC free article] [PubMed] [Google Scholar]
- Rocha EP, Danchin A (2002) Base composition bias might result from competition for metabolic resources. Trends Genet 18: 291–294 [DOI] [PubMed] [Google Scholar]
- Staley JT, Konopka A (1985) Measurement of in situ activities of nonphotosynthetic microorganisms in aquatic and terrestrial habitats. Annu Rev Microbiol 39: 321–346 [DOI] [PubMed] [Google Scholar]
- Stuiver M, Quay PD, Ostlund HG (1984) Abyssal water carbon-14 distribution and the age of the world oceans. Science 219: 849–851 [DOI] [PubMed] [Google Scholar]
- Sueoka N (1961) Correlation between base composition of deoxyribonucleic acid and amino acid composition of protein. Proc Natl Acad Sci USA 47: 1141–1149 [DOI] [PMC free article] [PubMed] [Google Scholar]
- Sueoka N (1962) On the genetic basis of variation and heterogeneity of DNA base composition. Proc Natl Acad Sci USA 48: 582–592 [DOI] [PMC free article] [PubMed] [Google Scholar]
- Suzuki MT, Giovannoni SJ (1996) Bias caused by template annealing in the amplification of mixtures of 16S rRNA genes by PCR. Appl Environ Microbiol 62: 625–630 [DOI] [PMC free article] [PubMed] [Google Scholar]
- Tringe SG et al. (2005) Comparative metagenomics of microbial communities. Science 308: 554–557 [DOI] [PubMed] [Google Scholar]
- Tyson GW, Chapman J, Hugenholtz P, Allen EE, Ram RJ, Richardson PM, Solovyev VV, Rubin EM, Rokhsar DS, Banfield JF (2004) Community structure and metabolism through reconstruction of microbial genomes from the environment. Nature 428: 37–43 [DOI] [PubMed] [Google Scholar]
- Venter JC et al. (2004) Environmental genome shotgun sequencing of the Sargasso Sea. Science 304: 66–74 [DOI] [PubMed] [Google Scholar]
- von Mering C, Jensen LJ, Snel B, Hooper SD, Krupp M, Foglierini M, Jouffre N, Huynen MA, Bork P (2005) STRING: known and predicted protein–protein associations, integrated and transferred across organisms. Nucleic Acids Res 33: D433–D437 [DOI] [PMC free article] [PubMed] [Google Scholar]
Associated Data
This section collects any data citations, data availability statements, or supplementary materials included in this article.
Supplementary Materials
Supplementary Information