

Abstract
The catalase reaction of catalase-peroxidases involves catalase-specific features built into a peroxidase core. An arginine, 20 Å from the active-site heme, acts as a molecular switch moving between two conformations, one that activates heme oxidation and one that activates oxoferryl heme reduction by H2O2, facilitating the catalatic pathway in a peroxidase. The influence of the arginine is imparted to the heme through its association with or dissociation from a tyrosinate that modulates reactivity through a Met-Tyr-Trp crosslinked adduct and a π electron interaction of the heme with the adduct Trp.
Keywords: catalase-peroxidase, molecular switch, crystal structure, oxyferryl species
Introduction
Catalase-peroxidases, also called KatGs after the encoding gene katG (Loewen et al, 1985), are found in bacteria, archaebacteria and a few fungi, and are fascinating in their complexity. The enzyme is named for its catalase and peroxidase activities, but low levels of NADH oxidase, isonicotinoyl hydrazide INH lyase and isonicotinoyl-NAD synthase activities have recently been characterized (Singh et al, 2004), and it is the latter two that are responsible for the activation of isoniazid as an anti-tubercular drug in Mycobacterium tuberculosis (Zhang et al, 1992; Johnsson et al, 1995). Each subunit in the dimer has two distinct but sequence-related domains that seem to have evolved in a gene duplication and fusion event (Welinder, 1991), and are related to peroxidases from higher organisms, both in sequence and structure. Evolution of KatG or its progenitor into the smaller, mono-functional peroxidase (Klotz & Loewen, 2003) included the loss of structural features and residues that impart catalase activity to the peroxidase core of KatG. The mechanistic significance of these catalase-specific features is described in this report.
The catalase and peroxidase reactions involve a common path for oxoferryl compound I formation (reaction 1), but differ in the path for compound I reduction back to resting state. Compound I initially has the heme oxidized to the oxoferryl state  and a porphyrin cation π-radical (Por°+). Some peroxidases also form a Tyr (or Trp)-based protein radical by intramolecular electron transfer to the porphyrin. For example, KatG from Synechocystis PCC6803 forms a porphyrin radical as well as Trp and Tyr radicals in the absence of reducing substrate (reaction 2; Ivancich et al, 2003). In catalases, compound I is reduced in a single two-electron transfer from H2O2 (reaction 3), whereas peroxidases undergo two sequential one-electron transfers, usually from organic donors (AH), and involve an intermediate called compound II (reactions 4 and 5).
![]()
![]()
![]()
![]()
![]()
The identification of catalase-specific features in KatGs has been the focus of several recent studies aided by the recently reported crystal structures of KatGs from Haloarcula marismortui (Yamada et al, 2002), Burkholderia pseudomallei (Carpena et al, 2003), Synecococcus sp (Wada et al, 2002) and Mycobacterium tuberculosis (Bertrand et al, 2004). Three active-site residues on the distal side of the heme, including Arg 108, Trp 111 and His 112 (numbering in B. pseudomallei KatG, BpKatG, is used throughout), are invariant among catalase-peroxidases, and the equivalent His and Arg are invariant in mono-functional peroxidases. The catalase-specific role of the active-site Trp 111 was demonstrated (Hillar et al, 2000; Regelsberger et al, 2000) and extended to the adjacent Tyr 238 and Met 264, part of an unusual crosslinked adduct with Trp 111 found in all catalase-peroxidases (Wada et al, 2002; Yamada et al, 2002; Carpena et al, 2003; Bertrand et al, 2004; Deemagarn et al, 2005). Similar to changes to the Trp, changes to the Tyr or Met, or even Arg 426 associated with Tyr 238, inhibited the catalase reaction, with little or no effect on the peroxidase reaction (Jakopitsch et al, 2003, 2004; Yu et al, 2003; Singh et al, 2004). A mechanism attempting to explain why these residues are essential for the catalase reaction has been postulated (Mo et al, 2004), but is incompatible with recent data.
Results and Discussion
Electron density maps (Fig 1; Table 1) from crystals of BpKatG soaked with peroxoacetate show two areas of change compared with the native enzyme. In the vicinity of the heme iron, the continuous density extending from the heme iron to a second atom is best explained by formation of an oxoferryl species. Using data from a single crystal, the iron–oxygen distance was 2.2 Å, which is longer than that expected for a compound I or II oxoferryl species. However, the composite data set from three different crystals (Table 1) showed an iron–oxygen bond length of 1.88 Å (Fig 1), a value between the expected lengths of compounds I and II reported for horseradish peroxidases (Chance et al, 1984; Berglund et al, 2002) and very similar to the 1.87 Å observed in the structure of compound I of yeast cytochrome c peroxidase (Bonagura et al, 2003). The temperature factor of the coordinated oxygen, with full occupancy, was similar to the temperature factors of neighbouring atoms. These observations might be interpreted as the result of decay of the oxoferryl species due to X-ray exposure (Berglund et al, 2002) or of compound I having a Fe–O single-bond nature in peroxidases with one oxidation equivalent delocalized to a protein radical (Bonagura et al, 2003). The second change caused by peroxoacetate soaking is the side chain of Arg 426 predominantly adopting conformation R, placing the guanidinium group in close proximity to both Arg 497 and Arg 492, with none in ionic association with Tyr 238 (conformation Y; Fig 2). The location of Arg 426 was not affected by prolonged X-ray exposure and remained in conformation R. The striking conclusion is that the conformation of the side chain of Arg 426, well removed from the heme, is sensitive to the oxidation state of the heme, and this must be modulated through the Met-Tyr-Trp adduct.
Figure 1.
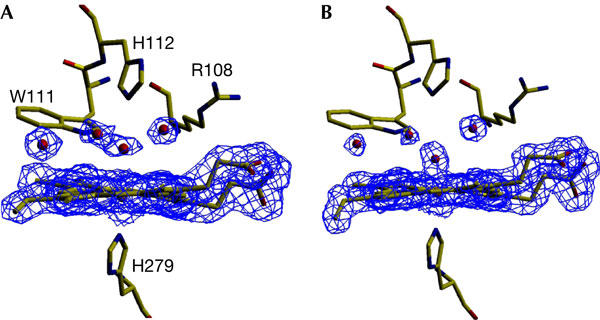
View of the 2Fo−Fc electron density map modelled at σ=1.0. Maps are shown corresponding to the heme and adjacent water molecules in crystals of native BpKatG (A) before and (B) after soaking with 1 mM peroxoacetate at pH 5.6. The continuous density between the heme iron and adjacent oxygen in (B) confirms the existence of an oxoferryl species.
Table 1.
Data collection and structural refinement statistics, with data for the highest resolution shell shown in parentheses
| BpKatG_7.5a | BpKatG_8.0a | OF_5.6a | OF_7.5a | |
|---|---|---|---|---|
| (a) Data collection | ||||
| Unit cell parameter | ||||
| a (Å) | 100.3 | 100.8 | 100.2 | 100.4 |
| b (Å) | 114.9 | 116.0 | 114.7 | 114.9 |
| c (Å) | 174.8 | 174.9 | 174.4 | 174.6 |
| Resolution (Å) | 50–2.0 (2.10–2.05) | 30–1.9 (1.94–1.9) | 30–1.9 (1.97–1.9) | 30–2.0 (2.07–2.00) |
| Completeness (%) | 99.2 (94.4) | 99.8 (99.9) | 98.9 (97.9) | 98.0 (99.9) |
| Rsym (%) | 11.6 (48.1) | 8.7 (43.8) | 9.5 (42.7) | 13.5 (50.6) |
| 〈I/σ〉 | 8.0 (2.2) | 8.5 (2.8) | 9.0 (4.4) | 7.1 (2.0) |
| Redundancy | 4.4 (3.4) | 4.1 (3.1) | 7.3 (7.3) | 3.7 (3.6) |
| (b) Refinement | ||||
| Number of reflections | 119,529 (8,147) | 152,864 (11,704) | 114,316 (7,306) | 120,509 (8,986) |
| Rwork (%) | 16.1 (22.9) | 15.9 (20.7) | 14.9 (16.7) | 16.8 (22.0) |
| Rfree (%) | 19.6 (30.0) | 18.7 (25.0) | 18.5 (21.8) | 19.9 (25.0) |
| Number of residues | 1428 | 1428 | 1428 | 1428 |
| Number of water molecules | 1516 | 1722 | 1419 | 1543 |
| R.m.s.d. bond length (Å) | 0.01 | 0.01 | 0.01 | 0.01 |
| R.m.s.d. angles (deg) | 1.3 | 1.6 | 1.1 | 1.1 |
| Averaged B-factor (Å2) | ||||
| Protein atoms | 23.8 | 20.2 | 14.9 | 26.8 |
| Water molecules | 32.8 | 34.0 | 25.3 | 37.6 |
aBpKatG_7.5, crystal at pH 7.5; BpKatG_8.0, crystal at pH 8.0; OF_5.6, oxyferryl species at pH 5.6; OF_7.5, oxyferryl species (generated at pH 5.6 and shifted to pH 7.5) from the composite data set described in Methods.
Figure 2.
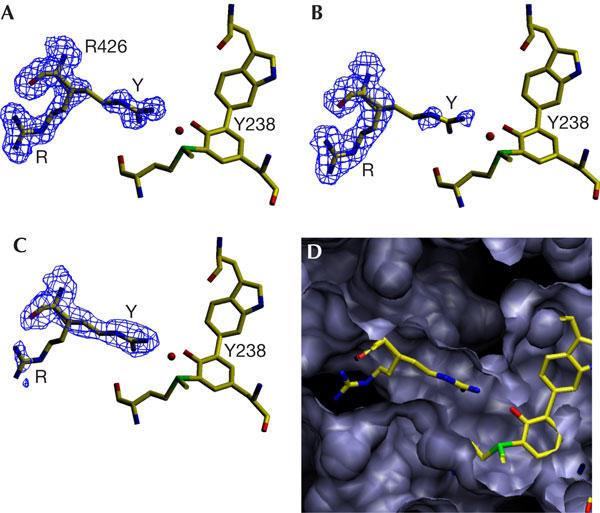
View of the 2Fo−Fc electron density maps in the vicinity of Arg 426 modelled at σ=1.0. (A) BpKatG at pH 5.6 exhibits conformations R and Y at a ratio of approximately 70:30. (B) BpKatG soaked with peroxoacetic acid as in Figure 1 exhibits 100% conformation R. (C) Native BpKatG at pH 8.0 exhibits 100% conformation Y. Panel (D) shows the cavity containing Arg 426 including the two conformations of the Arg 426 side chain.
At physiological pH, Tyr 238 probably exists as a tyrosinate ion stabilized through resonance charge delocalization in a zwitterion structure with the adjacent positively charged sulphur of Met 264 (Fig 3), which is further stabilized by adjacent main-chain carbonyl oxygens (Fig 4A). While favouring a lower than normal pKa for Tyr 238, resonance delocalization of electrons to Met 264 will also reduce the effective negative charge on the tyrosinate oxygen and weaken its association with Arg 426, thereby facilitating movement of the arginine side chain between conformations Y and R (Fig 2). Changing between conformations Y and R would be expected to modulate inductive effects in the adduct and, because the indole of Trp 111 is stacked 3.4 Å above ring II of the heme (Fig 4B), also the heme. With Arg 426 in conformation Y, associated with Tyr 238, electrons in the adduct will be pulled towards the tyrosine, lowering the electron density on Trp 111 and the heme, thereby making heme oxidation more difficult and heme reduction easier. Conversely, with Arg 426 in conformation R, dissociated from Tyr 238, electrons will move away from the tyrosine towards the heme, making its oxidation easier, but hindering compound I reduction (Figs 4C, 5). This predicted influence of Arg 426 on heme reactivity is mirrored in the changes in Km values for H2O2 (Table 2) among variants changed in Arg 426 and adduct residues. In particular, the replacement of Arg 426 (with residues other than the positively charged lysine) should enhance electron density on the heme and favour compound I formation. The decreased Km for H2O2, which is used only for compound I formation in the peroxidase reaction, is consistent with this prediction. At the same time, the enhanced electron density on the heme should hinder compound I reduction, and this prediction is supported by the increased Km for H2O2 in the catalase reaction, indicative of a more difficult compound I reduction. Thus, Arg 426 can be viewed as a molecular switch that favours compound I formation when toggled to conformation R and favours catalatic compound I reduction when toggled to conformation Y (Fig 4C). The adduct is an integral part of the switch as a relay to the heme reaction centre, and changes to any of Trp 111, Tyr 238 or Met 264 disrupt the circuit, acting similarly to changes in Arg 426 itself (Table 2), facilitating compound I formation and hindering its reduction.
Figure 3.
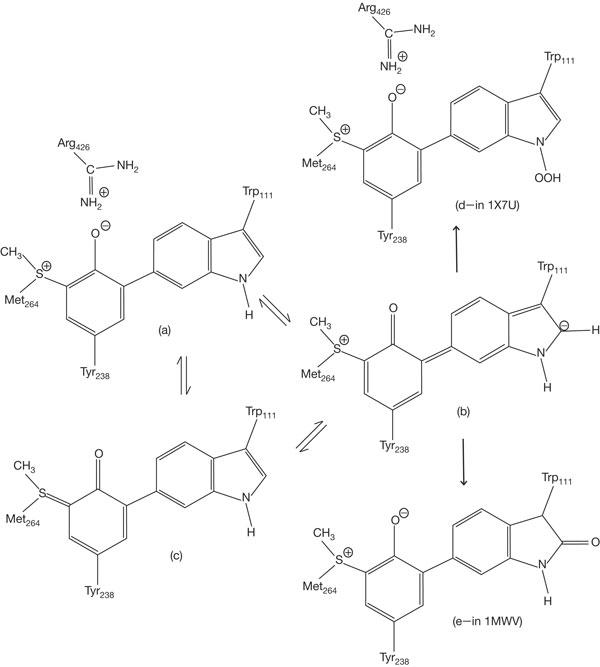
Scheme showing the resonance delocalization of electrons in the adduct among structures (a, b and c). The reduction in charge on the tyrosinate is shown in structure (b) and the enhancement of negative charge on the indole ring is shown in structure (c). Two examples of the enhanced reactivity of Trp 111 arising from this shift of electron density include the perhydroxy-modified indole, structure (d), observed in the S324T variant of BpKatG (1X7U) and the oxidized indole, structure (e), observed in one preparation of native BpKatG (1MWV).
Figure 4.
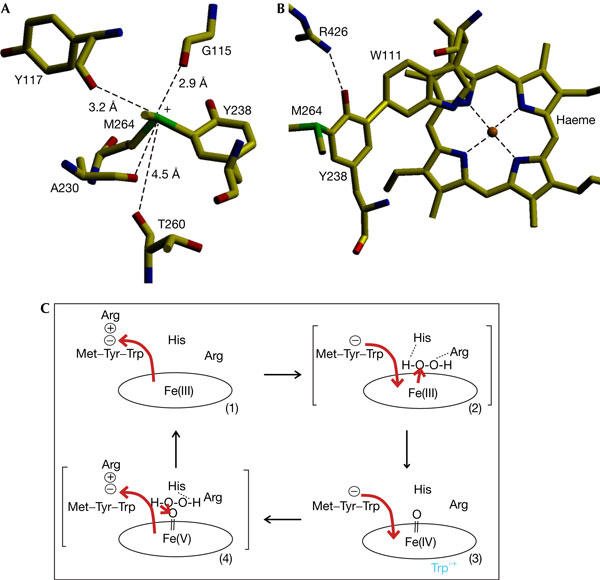
Factors contributing to electron flux in the adduct and heme. (A) View of residues surrounding and interacting with the positively charged sulphur of Met 264. (B) View showing the stacking of the indole ring of Trp 111 3.4 Å above ring II of the heme. Arg 426 is shown in conformation Y to explain its linkage with the heme through the covalent adduct. (C) Scheme describing the influence on electron flux and heme reactivity of changes between conformation Y and R in Arg 426. Situation C(1) shows the resting state with conformation Y polarizing electrons towards Y238 (red arrow). Situation C(2) shows the intermediate in heme oxidation leading to compound I. Arg 426 is in conformation R, allowing electron flux towards the heme to promote oxidation by substrate H2O2 bound to His 112 and Arg 108. Situation C(3) shows the intermediate formed by intramolecular electron transfer between a protein residue (Trp°+) and the porphyrin. Situation C(4) shows the intermediate leading to compound I reduction with H2O2 bound to Trp 111 and His 112. Movement of Arg 426 between conformations Y and R induces electron flux in and out of the heme to promote its oxidation and reduction. Dissociation of the phorphyrin radical to a protein radical occurs primarily in the peroxidatic process, and the oxoferryl species being reduced by H2O2 is shown as having reverted to the Fe+5 state. Characterization of the path of radical generation and reduction must await identification of the radical site in BpKatG and of the influence of Arg 426 on radical formation and reduction.
Figure 5.
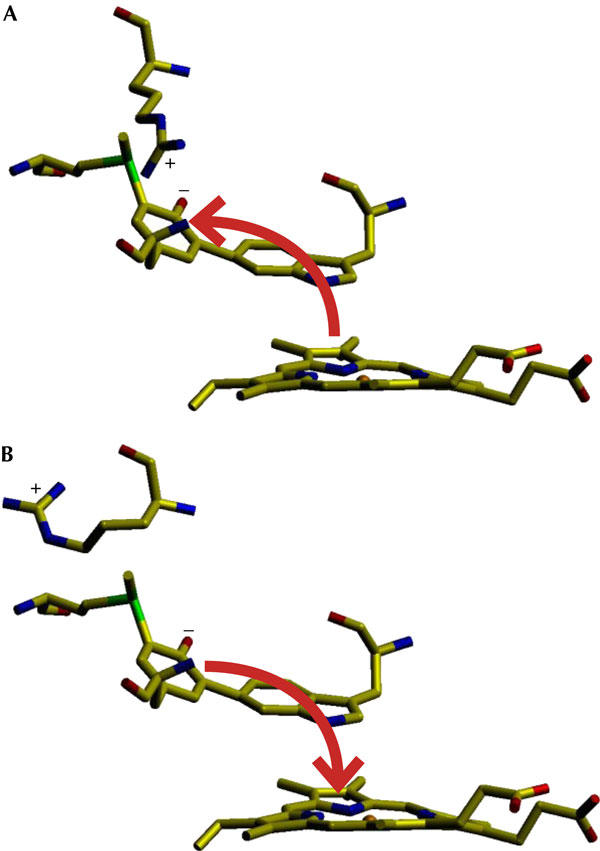
Scheme showing changes in electron flux in the adduct and heme under the influence of Arg 426 in conformations Y (A) and R (B). Conformation Y induces electron flux (red arrow) away from the heme, favouring its reduction, whereas conformation R induces electron flux towards the heme, favouring its oxidation.
Table 2.
Kinetic constants for catalase and peroxidase activities of BpKatG and its variants
| |
Catalase |
Peroxidase |
|||
|---|---|---|---|---|---|
| Vmaxa | appKmb | Vmaxc | Kmd | Kme | |
| BpKatG | 4,300 | 3.7 | 10.9 | 310 | 140 |
| Y238A | 7.7 | 139 | 3.7 | 3.9 | 45 |
| M264A | 34.8 | 259 | 3.7 | 16 | 11 |
| W111F | 4.6 | 59 | 2.5 | 62 | 19 |
| R426A | 185 | 36 | 10.8 | 2.5 | 200 |
| R426L | 173 | 30 | 11.0 | 3.0 | 145 |
| R426E | 214 | 30 | 10.3 | 7.5 | 200 |
| R426K | 3,025 | 3.3 | 10.6 | 190 | 140 |
aVmax, μM H2O2 min−1 mg−1.
bappKm, apparent Km determined as [H2O2] at 0.5Vmax, mM.
cVmax, mM ABTS min−1 mg−1.
dKm, [H2O2] μM.
eKm, [ABTS] μM.
The unusual modifications in the active site of BpKatG, including the perhydroxy modifications on the heme (1MWV) and the indole nitrogen (1X7U), and indole Cδ1 oxidation (1MWV) are consistent with the previously reported enhanced reactivity of the equivalent Trp in a modified cytochrome c peroxidase active site (Bhaskar et al, 2003). The large number of modifications in the BpKatG active site is consistent with there being an element of hyper-reactivity, which may be modulated by the movement of Arg 426, such that, in conformation R, electron density and, therefore, reactivity in the adduct and heme are enhanced (Fig 3).
The facile nature of the Arg 426 side-chain equilibrium between conformations Y and R is also demonstrated in its sensitivity to pH. Of the four KatGs so far crystallized, MtKatG (Bertrand et al, 2004), with 0% conformation Y, was crystallized at pH 4.5; BpKatG (Carpena et al, 2003), with 30% conformation Y, was crystallized at pH 5.6; SyKatG (Wada et al, 2002), with 80% conformation Y, was crystallized at pH 6.3; and HmKatG (Yamada et al, 2002), with 100% conformation Y, was crystallized at pH 8.0. This apparent correlation of increased conformation Y with higher pH was directly confirmed in crystals of native BpKatG with 30%, 70% and 100% conformation Y at pH values of 5.6, 7.5 and 8.0, respectively (Fig 2). In contrast, the 100% conformation R in the oxoferryl species did not suffer a similar pH-induced change even at pH 7.5 (Fig 2), showing that the oxidized heme has a significant inductive influence on the charge on Tyr 238, thereby controlling its interaction with Arg 426. Facile movement of the Arg 426 side chain is consistent with the absence of any hindering residues in its cavity (Fig 2D), but the switch-like nature of the movement is reflected in the movement being limited to just two conformations, providing settings for oxidation and reduction of the heme. The apparent correlation between the conformation of Arg 426 and pH may also explain the different pH optima for the peroxidase (pH 4.5) and catalase (pH 6.5) reactions (Singh et al, 2004). The peroxidatic process is facilitated at low pH at which Arg 426, in conformation R, favours heme oxidation to compound I, and the two-electron catalatic reduction of compound I by H2O2 is facilitated at higher pH at which Arg 426 is in conformation Y. The influence of other factors, such as peroxidatic substrate binding, protein radical location and the protonation state of active-site residues, is superimposed on the influence of Arg 426 to generate the final pH optimum patterns.
The regulation of inductive effects over a long distance by the switch-like movement of an arginine side chain explains many aspects of the multifunctionality of catalase-peroxidases. Not only is this new molecular device operating in an important class of enzymes involved in anti-tubercular drug activation, but the catalytic implications probably allow a re-evaluation of catalytic mechanisms, in particular, in other heme-containing enzymes.
Methods
The plasmid pBpKatG (Carpena et al, 2002) was used as the source of catalase-peroxidase from B. pseudomallei. Variants of BpKatG were prepared, purified and crystallized, as described previously (Carpena et al, 2003; Singh et al, 2004). Crystals of BpKatG were soaked with 1 mM peroxoacetate in crystallization buffer for 1 min before pH change, flash cooling and data collection. For pH change, crystals were soaked for 1 min in 100 mM Tris–HCl, pH 7.5 or 8.0, before flash cooling for data collection. The composite data set following peroxoacetate treatment and change to pH 7.5 (OF_7.5 in Table 1) was obtained by merging 90° of data from three different crystals treated equivalently. Data processing and scaling involved DENZO and SCALEPACK (Otwinowski & Minor, 1996; Table 1). Structure determination was carried out with MOLREP (CCP4, 1994) using BpKatG (1MWV) as the searching model, and refinement was completed using REFMAC (Murshudov et al, 1997) and the graphics program O (Jones et al, 1991). The visualization of molecular cavities was carried out with VMD (Humphrey et al, 1996). The figures were prepared using VMD and SETOR (Evans, 1993).
Catalase activity was determined by the method of Rørth & Jensen (1967) in a Gilson oxygraph equipped with a Clark electrode. One unit of catalase is defined as the amount that decomposes 1 μmol of H2O2 in 1 min in a 60 mM H2O2 solution at pH 7.0 and 37°C. Peroxidase activity was determined using 2,2′-azinobis(3-ethylbenzothiazolinesulphonic acid) (ABTS; Childs & Bardsley, 1975). One unit of peroxidase is defined as the amount that decomposes 1 μmol of ABTS in 1 min in a solution of 0.3 mM ABTS (ɛ=36,800 M−1 cm−1) and 2.5 mM H2O2 at pH 4.5 and 25°C. Protein was estimated according to the methods outlined by Layne (1957).
Protein Data Bank accession numbers. Structure factors and coordinates have been submitted to the Protein Data Bank under the following accession numbers: BpKatG at pH 7.5, 2B2Q; BpKatG at pH 8.0, 2B2O; BpKatG treated with peracetate at pH 5.6, 2B2R; BpKatG treated with peracetate and shifted to pH 7.5, 2B2S.
Acknowledgments
This work was supported by grant BIO2002-04419 from Ministerio de Ciencia y Technologia, Spain (to I.F.), by grant OGP9600 from the Natural Sciences and Engineering Research Council of Canada (to P.C.L.), by the Canada Research Chair Program (to P.C.L.) and by fellowship EX-2003-0866 from the Ministerio de Educación Cultura y Deporte, Spain (to X.C.).
References
- Berglund GI, Carlsson GH, Smith AT, Szoke H, Henriksen A, Hajdu J (2002) The catalytic pathway of horseradish peroxidase at high resolution. Nature 417: 463–468 [DOI] [PubMed] [Google Scholar]
- Bertrand T, Eady NAJ, Jones JN, Nagy JM, Jamart-Grégoire B, Raven EL, Brown KA (2004) Crystal structure of Mycobacterium tuberculosis catalase-peroxidase. J Biol Chem 279: 38991–38999 [DOI] [PubMed] [Google Scholar]
- Bhaskar B, Immoos CE, Shimizu H, Suic F, Farmer PJ, Poulos TL (2003) A novel heme and peroxide-dependent tryptophan–tyrosine cross-link in a mutant of cytochrome c peroxidase. J Mol Biol 328: 157–166 [DOI] [PubMed] [Google Scholar]
- Bonagura CA, Bhaskar B, Shimizu H, Li H, Sundaramoorthy M, McRee DE, Goodin DB, Poulos TL (2003) High resolution crystal structures and spectroscopy of native and compound I cytochrome c peroxidase. Biochemistry 42: 5600–5608 [DOI] [PubMed] [Google Scholar]
- Carpena X, Switala J, Loprasert S, Mongkolsuk S, Fita I, Loewen PC (2002) Crystallization and preliminary X-ray analysis of the catalase-peroxidase KatG from Burkholderia pseudomallei. Acta Crystallogr D 58: 2184–2186 [DOI] [PubMed] [Google Scholar]
- Carpena X, Loprasert S, Mongkolsuk S, Switala J, Loewen PC, Fita I (2003) Catalase-peroxidase KatG of Burkholderia pseudomallei at 1.7 Å resolution. J Mol Biol 327: 475–489 [DOI] [PubMed] [Google Scholar]
- Chance B, Powers L, Ching Y, Poulos T, Schonbaum GR, Yamazaki I, Paul KG (1984) X-ray absorption studies of intermediates in peroxidase activity. Arch Biochem Biophys 235: 596–611 [DOI] [PubMed] [Google Scholar]
- Childs RE, Bardsley WG (1975) The steady-state kinetics of peroxidase with 2,2′-azino-di-(3-ethyl-benzthiazoline-6-sulphonic acid) as chromagen. Biochem J 145: 93–103 [DOI] [PMC free article] [PubMed] [Google Scholar]
- Collaborative Computational Project Number 4 (1994) The CCP4 suite: programs for protein crystallography. Acta Crystallogr A 50: 760–763 [DOI] [PubMed] [Google Scholar]
- Deemagarn T, Carpena X, Singh R, Wiseman B, Fita I, Loewen PC (2005) Structural characterization of the Ser324Thr variant of the catalase-peroxidase (KatG) from Burkholderia pseudomallei. J Mol Biol 345: 21–28 [DOI] [PubMed] [Google Scholar]
- Evans S (1993) SETOR: hardware lighted three-dimensional solid model representations of macromolecules. J Mol Graphics 11: 134–138 [DOI] [PubMed] [Google Scholar]
- Hillar A, Peters B, Pauls R, Loboda A, Zhang H, Mauk AG, Loewen PC (2000) Modulation of the activities of catalase-peroxidase HPI of Escherichia coli by site-directed mutagenesis. Biochemistry 39: 5868–5875 [DOI] [PubMed] [Google Scholar]
- Humphrey W, Dalke A, Schulten K (1996) VMD—visual molecular dynamics J. Mol Graphics 14: 33–38 [DOI] [PubMed] [Google Scholar]
- Ivancich A, Jakopitsch C, Auer M, Un S, Obinger C (2003) Protein-based radicals in the catalase-peroxidase Synchocystis PCC6803: a multifrequency EPR investigation of wild-type and variants on the environmen of the heme active site. J Am Chem Soc 125: 14093–14102 [DOI] [PubMed] [Google Scholar]
- Jakopitsch C, Auer M, Ivancich A, Ruker F, Furtmuller PG, Obinger C (2003) Total conversion of bifunctional catalase-peroxidase (KatG) to monofunctional peroxidase by exchange of a conserved distal side tyrosine. J Biol Chem 278: 20185–20191 [DOI] [PubMed] [Google Scholar]
- Jakopitsch C, Ivancich A, Schmuckenschlager F, Wanasinghe A, Pöltl G, Furtmüller P, Rükert F, Obinger C (2004) Influence of the unusual covalent adduct on the kinetics and formation of radical intermediates in Synechocystis catalase peroxidase. J Biol Chem 279: 46082–46095 [DOI] [PubMed] [Google Scholar]
- Johnsson K, King DS, Schultz PG (1995) Studies on the mechanism of action of isoniazid and ethionamide in the chemotherapy of tuberculosis. J Am Chem Soc 117: 5009–5010 [Google Scholar]
- Jones TA, Zou JY, Cowan SW, Kjeldgaard M (1991) Improved methods for building protein models in electron density maps. Acta Crystallogr A 47: 1100–1119 [DOI] [PubMed] [Google Scholar]
- Klotz MG, Loewen PC (2003) The molecular evolution of catlatic hydroperoxidases: evidence for multiple lateral transfer of genes between prokaryota and from bacteria into eukaryota. Mol Biol Evol 20: 1098–1112 [DOI] [PubMed] [Google Scholar]
- Layne E (1957) Spectrophotometric and turbidimetric methods for measuring proteins. Methods Enzymol 3: 447–454 [Google Scholar]
- Loewen PC, Triggs BL, George CS, Hrabarchuk BE (1985) Genetic mapping of katG, a locus that affects synthesis of the bifunctional catalase-peroxidase hydroperoxidase I in Escherichia coli. J Bacteriol 162: 661–667 [DOI] [PMC free article] [PubMed] [Google Scholar]
- Mo L, Zhang W, Wang J, Weng XH, Chen S, Shao LY, Pang MY, Chen Z (2004) Three-dimensional model and molecular mechanism of Mycobacterium tuberculosis catalase-peroxidase (KatG) and isonizid-resistant katG mutants. Microbial Drug Resist 10: 269–279 [DOI] [PMC free article] [PubMed] [Google Scholar]
- Murshudov GN, Vagin AA, Dodson EJ (1997) Refinement of macromolecular structures by the maximum likelihood method. Acta Crystallog D 53: 240–255 [DOI] [PubMed] [Google Scholar]
- Otwinowski Z, Minor W (1996) Processing of X-ray diffraction data collected in oscillation mode. Methods Enzymol 276: 307–326 [DOI] [PubMed] [Google Scholar]
- Regelsberger G, Jakopitsch C, Ruker F, Krois D, Peschek GA, Obinger C (2000) Effect of distal cavity mutations on the formation of compound I in catalase-peroxidases. J Biol Chem 275: 22854–22861 [DOI] [PubMed] [Google Scholar]
- Rorth HM, Jensen PK (1967) Determination of catalase activity by means of the Clark electrode. Biochim Biophys Acta 139: 171–173 [DOI] [PubMed] [Google Scholar]
- Singh R, Wiseman B, Deemagarn T, Donald LJ, Duckworth HW, Carpena X, Fita I, Loewen PC (2004) Catalase-peroxidases (KatG) exhibit NADH oxidase activity. J Biol Chem 279: 43098–43106 [DOI] [PubMed] [Google Scholar]
- Wada K, Tada T, Nakamura Y, Kinoshita T, Tamoi M, Sigeoka S, Nishimura K (2002) Crystallization and preliminary X-ray diffraction studies of catalase-peroxidase from Synechococcus PCC7492. Acta Crystallogr D 58: 157–159 [DOI] [PubMed] [Google Scholar]
- Welinder K (1991) Bacterial catalase-peroxidases are gene duplicated members of the plant peroxidase superfamily. Biochim Biophys Acta 1080: 215–220 [DOI] [PubMed] [Google Scholar]
- Yamada Y, Fujiwara T, Sato T, Igarashi N, Tanaka N (2002) The 2.0 Å structure of catalase-peroxidase from Halarcula marismortui. Nat Struct Biol 9: 691–695 [DOI] [PubMed] [Google Scholar]
- Yu S, Girotto S, Zhao X, Magliozzo RS (2003) Rapid formation of compound II and a tyrosyl radical in the Y229F mutant of M. tuberculosis KatG disrupts catalase but not peroxidase function. J Biol Chem 278: 44121–44127 [DOI] [PubMed] [Google Scholar]
- Zhang Y, Heym B, Allen B, Young D, Cole ST (1992) The catalase-peroxidase gene and isoniazid resistance of Mycobacterium tuberculosis. Nature 358: 591–593 [DOI] [PubMed] [Google Scholar]