Abstract
High-throughput gene trapping is a random approach for inducing insertional mutations across the mouse genome. This approach uses gene trap vectors that simultaneously inactivate and report the expression of the trapped gene at the insertion site, and provide a DNA tag for the rapid identification of the disrupted gene. Gene trapping has been used by both public and private institutions to produce libraries of embryonic stem (ES) cells harboring mutations in single genes. Presently, ∼66% of the protein coding genes in the mouse genome have been disrupted by gene trap insertions. Among these, however, genes encoding signal peptides or transmembrane domains (secretory genes) are underrepresented because they are not susceptible to conventional trapping methods. Here, we describe a high-throughput gene trapping strategy that effectively targets secretory genes. We used this strategy to assemble a library of ES cells harboring mutations in 716 unique secretory genes, of which 61% were not trapped by conventional trapping, indicating that the two strategies are complementary. The trapped ES cell lines, which can be ordered from the International Gene Trap Consortium (http://www.genetrap.org), are freely available to the scientific community.
INTRODUCTION
High-throughput gene trapping is a random approach for inducing insertional mutations across the mouse genome. This approach uses gene trap vectors whose principal element is a gene trapping cassette consisting of a promoterless reporter and/or selectable marker gene flanked by an upstream 3′ splice site [splice acceptor (SA)] and a downstream transcriptional termination sequence [polyadenylation sequence (polyA)]. When inserted into an intron of an expressed gene, the gene trap cassette is transcribed from the endogenous promoter in the form of a fusion transcript in which the exon(s) upstream of the insertion site is spliced to the reporter/selectable marker gene. Since transcription is terminated prematurely at the inserted polyadenylation site, the processed fusion transcript encodes a truncated and non-functional version of the cellular protein and the reporter/selectable marker (1). Thus, gene traps simultaneously inactivate and report the expression of the trapped gene at the insertion site and provide a DNA tag [gene trap sequence tag (GTST)] for the rapid identification of the disrupted gene.
Gene trap approaches have been used successfully in the past by both academic and private organizations to create libraries of ES cell lines harboring mutations in single genes that can be used for making mice (2–5). Presently, the existing public resources put together by the International Gene Trap Consortium (IGTC) contain over 40 000 ES cell lines covering ∼40% of the protein coding genes expressed in the mouse genome (6). While most functional gene classes are represented, these libraries are biased against mutations in secretory pathway genes because the acquisition of a signal sequence by a gene trap induced fusion protein leads to its secretion and failure to report the trapping event. The mutational analysis of secretory pathway genes is highly desirable for two main reasons. First, they control intercellular communications and play a major role in most known signal transduction pathways and are, therefore, frequently involved in the pathogenesis of human disease. Second, the proteins are easily accessible by exogenous compounds and are, hence, preferred targets for drug development.
To mutate secretory genes more effectively in mammalian cells, we and others have developed gene trap vectors that are activated only after capturing a signal sequence or a transmembrane domain from an endogenous gene (7–9). Typically, these vectors contain a transmembrane domain (TM) upstream of a marker gene, which anchors the gene trap fusion protein in the cell membrane.
We have previously shown that the retroviral gene trap vector -U3Ceo- traps secretory genes with high efficiency in somatic cells (9). Here, we show that this vector and its conditional variant -FlipRosaCeo- (10) trap secretory genes with similar efficiency in ES cells and induce null mutations with a frequency comparable to other gene trap vectors. We have used these vectors to assemble the largest library of ES cell lines with mutations in secretory genes yet assembled, presently totaling 717 unique genes. Most importantly, more than half of these genes have not been trapped before, underscoring the utility of secretory trapping for the cost-effective saturation mutagenesis of the mouse genome (11,12).
MATERIALS AND METHODS
Plasmids
The U3Ceo gene trap vector was obtained as previously described by inserting a CD2/neomycin-phosphotransferase fusion gene (Ceo) into the U3 region a promoter- and enhancerless Moloney murine leukemia virus (9,10). To obtain Ceo cassettes specific for each translational reading frame, the original pU3Ceo vector specific for the second reading frame (U3Ceo2) (9,10) was modified as follows: to obtain U3Ceo1 for trapping the first reading frame, the oligonucleotides 5′-acgaatgcc-3′ and 5′-cattcgtgt-3′ were annealed and cloned into the unique BsmI and BsgI sites of pU3Ceo. To obtain U3Ceo3 for trapping the third reading frame, pU3Ceo was cleaved with BsmI and re-ligated after removing the 3′ overhangs with T4-DNA polymerase (New England Biolabs, Frankfurt am Main, Germany). FlipRosaCeo vectors were derived from FlipRosaβgeo (10) by replacing the SAβgeo cassette with the frame-specific Ceo cassettes.
ES cell cultures and infections
The [C57BL/6J × 129S6/SvEvTac]F1 and [129/SvPas] TBV-2 ES cell lines were grown on irradiated or mitomycin C-treated MEF feeder layers in the presence of 1000–1500 U/ml leukemia inhibitory factor (LIF) (Esgro, Chemicon, Hofheim, Germany) as described previously (4,10).
For mutational analysis, ES cells were trypsinized and seeded onto gelatinized plates. After incubating for 1 h, the slower sedimenting and less adherent feeder cells were removed by gentle washing followed by a medium change. This procedure was repeated for three passages before RNA extraction.
For embryoid body cultures, ES cells were grown for 8 days in bacterial culture dishes without LIF and feeder layers. Embryoid bodies were recovered by centrifugation, trypsinized and grown on gelatinized tissue culture plates for a further 2–3 days before RNA extraction.
Gene trap retrovirus was produced in Phoenix-Eco helper cells by using the transient transfection strategy described previously (10). ES cells were infected with the virus-containing supernatants at a multiplicity of infection of <0.5. Gene trap expressing ES cell lines were selected in 130 µg/ml (F1) or in 150 µg/ml (TBV-2) G418 (Invitrogen, Karlsruhe, Germany), manually picked, expanded and stored frozen in liquid nitrogen.
Gene expression analyses
RT–PCRs were performed according to the standard protocols by using 75 ng of reverse-transcribed total RNA in a total volume of 50 µl. Real-time RT–PCR analysis of gene expression in ES cells was performed using SYBR green chemistry (ABgene, Epsom, UK) and an iCycler (Biorad) machine. cDNA was synthesized from total RNA using random priming and Superscript II (Invitrogen) reverse transcriptase. Primers (20–22mer) flanking the gene trap insertion site were designed to span at least one intron and to amplify fragments between 100 and 250 nt. PCRs were run as triplicates on 96-well plates, with each reaction containing cDNA derived from 7.5 to 15 ng of total RNA, 5 pmol of each primer and 1× ABsolute SYBR fluorescein mix (ABGene) in a 25 µl volume. The temperature profile was 10 min at 95°C and then 40 cycles at 94°C for 15 s, 61°C for 30 s and 72°C for 30 s. Gene-specific primer sequences are listed in Supplementary Table 3. Generic primers are available on request.
For northern blotting, total RNA was extracted from tissue by using the RNeasy Mini Kit (Qiagen, Hilden, Germany) according to the manufacturer's instructions. The RNA (20 µg) was fractionated on 1% formaldehyde/agarose gels, blotted onto Hybond N+ (Amersham Biosciences) nylon membranes and hybridized to 32P-labeled cDNA probes (Hartmann Analytic, Braunschweig, Germany) in ULTRAhyb hybridization solution (Ambion, Austin, TX) according to the manufacturer's instructions. The C030019F02Rik-cDNA probe was obtained by asymmetric RT–PCR using an antisense primer complementary to exon 7 of the C030019F2Rik gene (10).
Semiautomated 5′-rapid amplification of cDNA ends (5′-RACE) and sequencing were performed as described by Hansen et al. (4).
CD2 antibody staining and FACS analysis
A total of 106 cells were suspended in 50 µl phosphate-buffered saline (PBS) (Invitrogen, Karlsruhe, Germany) and incubated for 30 min at 4°C with 2.5 µg/ml of CD2-specific mouse monoclonal antibody Leu-5b (Becton Dickinson, Heidelberg, Germany). Subsequently, the cells were incubated for 30 min at 4°C in 50 µl PBS containing 10% (v/v) fluorescein isothiocyanate (FITC)-conjugated sheep anti-mouse-Fab′2 antibody (Chemicon, Limburg, Germany). Finally, cells were suspended in 500 µl of 2% formaldehyde in PBS and analyzed in a FACScan(Becton Dickinson) flow cytometer.
GTST analysis
GTSTs were analyzed as described previously (4) by using the following databases: BayGenomics (http://baygenomics.ucsf.edu), GenBank (release 150), Unigene (built 150), RefSeq (release 13) (all at http://www.ncbi.nlm.nih.gov), ENSEMBL v33.34 (http://www.ensembl.org), MGI (www.informatics.jax.org), GeneOntology (October 2005 release) (http://www.geneontology.org), SMART version 4.1 (http://smart.embl-heidelberg.de) and TargetP version 1.1 (http://www.cbs.dtu.dk).
ES cell injections, breeding and genotyping
M076C04 (TBV-2; 129SvPas) and G033C05 (F1; C57BL6/j × 129S6/SvEvTac) ES cell derived chimeras were generated by injecting C57Bl/6 blastocysts. The resulting male chimeras were bred to C57Bl/6 females, and F1 agouti offspring containing the disrupted transgene were intercrossed to obtain homozygous F2 mice. Genotyping was performed on mouse tail DNA by PCR using primers against the sequences flanking the gene trap insertion previously identified in ES cells by inverse PCR and sequencing.
RESULTS
Assembly of an ES cell library with mutations in secretory genes
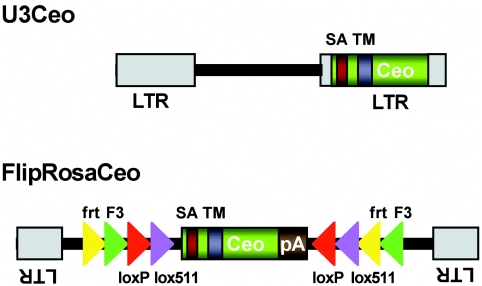
We used the retroviral gene trap vectors U3Ceo and FlipRosaCeo (Figure 1) to transduce the promoterless reporter gene -Ceo- into mouse ES cells in all three translational reading frames. Both vectors are promoter and enhancerless Moloney murine leukemia viruses with the -Ceo- gene inserted either in the U3 region of the retroviral LTR (U3Ceo) or in the body of the virus between the LTRs (FlipRosaCeo) (Figure 1) (10). The Ceo gene is an in-frame fusion between an ATG-less, C-terminally truncated human CD2 receptor cDNA and the neomycinphosphotransferase gene (neo). The CD2 moiety of the fusion gene provides a type II transmembrane domain (TM) and an N-terminal cryptic splice acceptor sequence, which has been shown to effectively induce splicing when inserted into an intron of an expressed gene (13). Productive insertions into secretory genes require capture of a signal sequence or a transmembrane domain to invert the default inside/out (type II) transmembrane orientation of the Ceo protein so that its catalytic C-terminus is placed into the cytosol where it confers G418 resistance.
Figure 1.
Schematic representation of the secretory gene trap vectors. LTR, long terminal repeat; Ceo, CD2/neomycinphosphotransferase fusion gene; SA, splice acceptor; TM, transmembrane domain; frt (yellow triangles) and F3 (green triangles) heterotypic target sequences for FLPe recombinase; loxP (red triangle) and lox511 (purple triangles), heterotypic target sequences from Cre recombinase.
To test the trapping efficiency of the three frame-specific U3Ceo vectors, we initially used them individually to produce 783 cell lines with U3Ceo1, 831 with U3Ceo2 and 463 with U3Ceo3, yielding insertions in the first, second and third translational reading frame, respectively. GTST recovery by 5′-RACE (4) and database analysis revealed that of the 439 genes recovered, 332 (76%) were trapped in one frame only. Moreover, an equal fraction of unique genes were trapped in each frame-specific library (i.e. ∼30%), suggesting that reading frames are evenly distributed between secretory genes. Overall, only 24% of the genes were trapped in more than one reading frame. Thus, a substantial number of trappable genes are missed by each of the frame-specific vectors and therefore we used pools of all three to complete the library production.
Overall, we isolated 4569 ES cell lines with secretory trap insertions and recovered 4167 GTSTs, of which 3260 were derived from U3Ceo- and 907 from FlipRosaCeo insertions.
In silico analysis employing a combination of SMART (http://smart.embl-heidelberg.de) and TargetP (http://www.cbs.dtu.dk) software revealed that 80% of all insertions were in secretory genes. Of these, 33% encoded a signal peptide, 24% a signal peptide and a transmembrane domain, 11% a type II transmembrane domain and 12% a mitochondrial protein. The remaining 20% encoded neither a signal peptide nor a transmembrane domain. RT–PCR analysis of several non-secretory trap events revealed that in each case the CD2 transmembrane domain was either partly or completely lost from the cell-provirus fusion transcript as a result of aberrant splicing (data not shown).
Ninety-six percent of the U3Ceo- and 99% of the FlipRosaCeo GTSTs belonged to known genes. A total of 717 unique genes were trapped, of which 440 have not been trapped by any of the conventional strategies applied by the IGTC or by the biotechnology company -Lexicon Genetics- (2,6) (Table 1).
Table 1.
Summary of results obtained with the secretory gene trap vectorsa
| Gene trap vector | U3Ceo | FlipRosaCeo | Total |
|---|---|---|---|
| Number of ES cell lines | 3620 | 949 | 4569 |
| Number of GTSTs | 3260 | 907 | 4167 |
| Number of insertions into annotated genes | 3144 | 898 | 4042 (97.0%) |
| Number of unique genes trapped | 618 | 276 | 717c |
| Number of ‘hot spots’b | 281 | 95 | 343 (45%)c |
aAnalysis based on NCBI mouse genome build 34 and RefSeq release 13.
bAll genes with ≥2 insertions were classified as hot spots.
cGenes and hot spots trapped by both vectors have been counted only once.
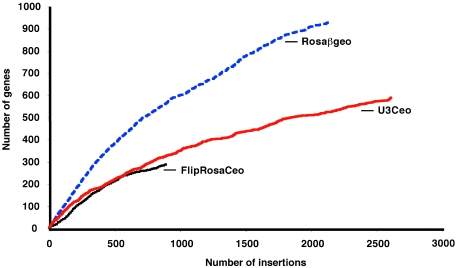
Secretory gene trapping rates were consistently inferior to the conventional trapping rates and decreased more quickly with accumulating integrations (6). On average, the Ceo vectors needed more than twice as many insertions to trap a novel gene than, for example, the conventional gene trap vector Rosaβgeo (14) (Figure 2). This inferior secretory trapping rate is due to significantly smaller genomic and intragenic integration targets: genomic, because only 1/3 of all coding genes encode secretory proteins according to the ENSEMBL database; intragenic, because productive insertions are restricted to introns downstream of signal peptide- or transmembrane domain encoding exons.
Figure 2.
Comparison of the rates of trapping of secretory and standard gene trap vectors. GTSTs matching unique genes (e ≤ 10−6) were identified by using the RefSeq database (rel. 13) and the BlastN algorithm. The number of novel genes hit by accumulating insertions was traced chronologically.
Secretory trap insertions are not entirely random
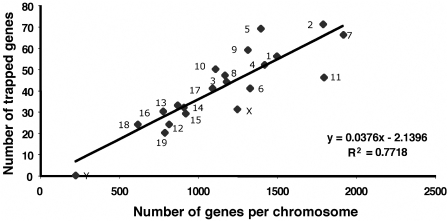
Secretory traps insert into all chromosomes except the Y chromosome and have a preference for chromosomes with a high density of genes. As shown in Figure 3, the number of secretory trap insertions per chromosome is correlated with the number of genes on that chromosome, which is similar to the previously reported insertion pattern of conventional gene trap vectors (4).
Figure 3.
Correlation between secretory trap insertions and the number of individual genes per chromosome.
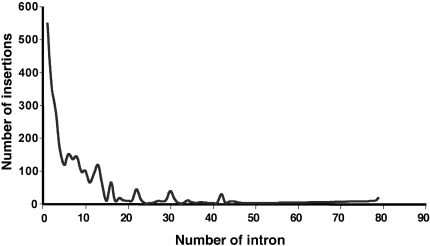
As expected from the reported preference of retroviral integrations near the 5′ end of genes and from observations made in previous trapping screens, the majority of the secretory trap insertions occurred into the first or second intron of a gene (Figure 4) (4,15).
Figure 4.
Distribution of gene trap insertions according to the position of the trapped intron within genes. The data are based on NCBI mouse genome build 34 and RefSeq database release 13.
Similar to their conventional counterparts, secretory gene traps have several preferred insertion sites or integration ‘hot spots’ across the mouse genome. Almost half of the trapped secretory genes contained two or more insertions, and some were hit up to 50 times. Examples include the serine carboxypeptidase 1 (Scpep1/Accession no. NM_029023) with 50 insertions, cadherin 1 (Cdh1/Accession no. NM_009864) with 42, the protein tyrosine phosphatase receptor type F (Ptprf/Accession no. NM_011213) with 39- and the A disintegrin and metalloprotease domain 19 (Adam19/Accession no. NM_009616) with 35 insertions. Presumably owing to the smaller integration target and to the need for productive insertions to occur downstream of signal sequences or transmembrane domains, the secretory gene trap hot spots were twice as frequent and averaged twice as many insertions per hot spot as the conventional gene trap hot spots (data not shown) (4). Interestingly, although secretory hot spots were not related to gene size, in a given hot spot, insertions tended to cluster in the larger introns, confirming their higher susceptibility to trapping (data not shown) (16).
Trapped ES cells express CD2
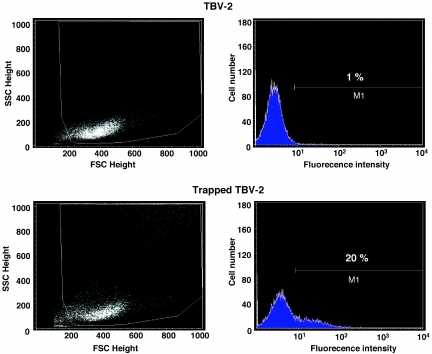
Acquisition of a signal sequence by the Ceo fusion protein predicts that trapped ES cells resistant to G418 should also express CD2. To test this assumption, 104 ES cells were infected with the U3Ceo virus and selected in G418. Surviving cells were treated with a monoclonal anti-CD2- antibody and analyzed by flow cytometry. Figure 5 shows that only 20% of the trapped ES cells expressed CD2, a frequency not entirely unexpected since other gene trap screens employing the classic β-galactosidase-neomycinphosphotransferase (βgeo) fusion gene yielded similar results. Accordingly, in most screens only about 30% of the cell lines isolated in G418 expressed β-galactosidase (β-gal) (4,16). Collectively, these results indicate that the detection of a reporter protein in the context of a neo fusion requires higher levels of expression than the induction of G418 resistance. Nevertheless, as has been shown previously for β-gal, the CD2 marker may be useful for monitoring gene expression in transgenic mice.
Figure 5.
CD2 expression by U3Ceo trapped ES cells. A total of 5 × 10⁴ cells were infected with U3Ceo retrovirus selected in G418. A total of 1 × 10⁶ NeoR cells (trapped TBV-2) were treated with the Leu-5b monoclonal mouse anti-human CD2 antibody. Similarly treated wild-type (TBV-2) cells served as a negative control. CD2 expression was estimated by flow cytometry after treating the cells with a FITC-conjugated sheep anti-mouse Fab′2 antibody.
Secretory traps are highly mutagenic
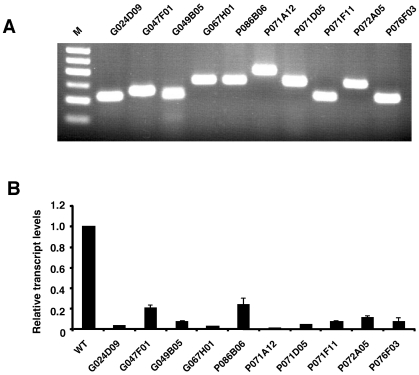
To test the quality of Ceo trap induced mutations, we selected 10 ES cell lines with insertions in X-chromosomal genes (Table 2). As the parental ES cell line is male derived, these cell lines provided a haploid background for the mutational analysis. As expected, all genes were expressed in ES cells and in each case the trapped cell lines expressed a fusion transcript as a result of splicing the upstream exons to the gene trap cassette (Figure 6A). Quantitative (q)PCR analysis (Supplementary Table 1) revealed that in eight cell lines the endogenous transcripts were reduced to about 5% or less of wild-type levels. The residual wild-type gene activity in most of these clones most likely reflects the presence of some contaminating feeder cells. Indeed, as exemplified in Supplementary Figure 1 for the G024D09 and G067H01 cell lines, endogenous transcripts could be reduced further by growing the cells in feederless differentiation cultures. Collectively, the results suggest that in most cases the Ceo trap insertions induce null mutations. However, in two instances the trapped alleles were clearly hypomorphic as they continued to express relatively high levels (>20%) of endogenous transcript (Figure 6). Hypomorphic alleles may also result from insertions into downstream introns: for example in the 8th and 9th intron of the ATPaseH+ transporting, lysosomal accessory protein 2 and the pyruvate dehydrogenase E1 alpha 1 genes, respectively (Supplementary Table 1 and Supplementary Figure 2). In these instances, the truncated endogenous proteins may retain some function. Conversely, such proteins could exert a dominant negative effect.
Table 2.
List of the used ES cell lines harboring gene trap insertions in X-chromsomal genes
| ES-cell line | Vector | Gene symbol | Accession number | Name | Intron | Captureda sequence |
|---|---|---|---|---|---|---|
| G024D09 | U3Ceo | Idh3g | NM_008323 | Isocitrate dehydrogenase 3 (NAD+), gamma | 1 | Mitochondr. |
| G047F01 | U3Ceo | Tmem32 | NM_146234 | Transmembrane protein 32 | 1 | Signal |
| G049B05 | U3Ceo | Ndufa1 | NM_019443 | NADH dehydrogenase (ubiquinone) 1 alpha subcomplex, 1 | 1 | Signal |
| G067H01 | U3Ceo | 2610529C04Rik | NM_025952 | RIKEN cDNA 2610529C04 gene | 1 | Signal |
| P071A12 | FlipRosaCeo | Pdha1 | NM_008810 | Pyruvate dehydrogenase E1 alpha 1 | 9 | Mitochondr. |
| P071D05 | FlipRosaCeo | Prdx4 | NM_016764 | Peroxiredoxin 4 | 5 | Signal. |
| P071F11 | FlipRosaCeo | Ndufb11 | NM_019435 | NADH dehydrogenase (ubiquinone) 1 beta subcomplex, 11 | 1 | Signal |
| P072A05 | FlipRosaCeo | Atp6ap2 | NM_027439 | ATPase, H+ transporting, lysosomal accessory protein 2 | 8 | Signal |
| P076F03 | FlipRosaCeo | Gla | NM_013463 | Galactosidase, alpha | 5 | Signal |
| P086B06 | FlipRosaCeo | 2610529C04Rik | NM_025952 | RIKEN cDNA 2610529C04 gene | 1 | Signal |
aAccording to SmartP (version 4.1).
Figure 6.
Transcriptional analysis of X-linked mutations in trapped ES cell lines. (A) RT–PCR of fusion transcripts induced by the gene trap insertions using trapped gene- and vector- specific primers. M, molecular weight marker (50 bp ladder). (B) Quantitative RT–PCR of wild-type transcripts expressed in the trapped ES cell lines. Gene-specific primers were chosen in exons flanking the insertion sites (Supplementary Table 1 and Supplementary Figure 1). Results are means from three independent experiments ± SD.
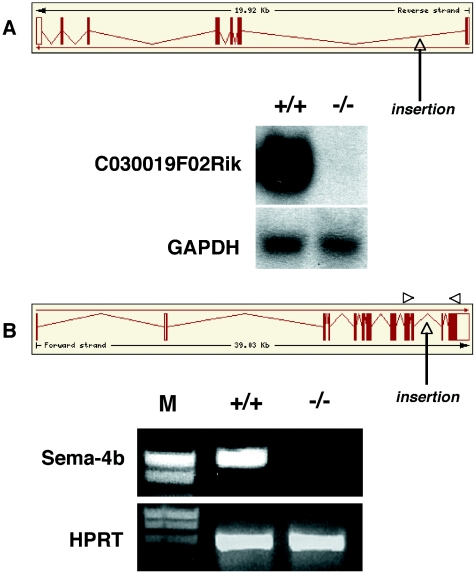
To investigate this further, we transferred the M076C04 and G033C05 ES cell lines to the mouse germline by blastocyst injection. The M076C04 and G033C05 cell lines contain U3Ceo insertions in the first and 11th intron of the C030019F02Rik and semaphorin-4B genes, respectively (Figure 7A and B, top panels). In both cases, intercrossing F1 heterozygous offspring yielded homozygous offspring at a frequency consistent with a Mendelian inheritance pattern of the disrupted transgenes. As shown in Figure 7, neither of the homozygous F2 mice expressed wild type transcripts, which should be equivalent to a null mutation. However, although the mutated semaphorin-4B protein lost its entire intracellular domain, we cannot exclude the possibility that the truncated protein had retained some residual function. In summary, the mutagenicity of Ceo traps is comparable to that of other gene trap vectors (4,8).
Figure 7.
Secretory gene disruption in transgenic mice. (A) Top: structure of the C030019F02Rik gene as annotated by ENSEMBL and position of the gene trap insertions (arrow). Bottom: northern blot analysis of C030019F02Rik transcripts expressed in homozygous mice. 20 µg total RNAs extracted from the brains of wild type (+/+) and mutant (−/−) mice were fractionated on 1% formaldehyde/agarose gels and hybridized to a 32P-labeled full-length C030019F02Rik c-DNA probe. (B) Top: structure of the semaphorin-4B gene as annotated by ENSEMBL and position of the gene trap insertion (arrow). Bottom: RT–PCR of transcripts expressed in wild type (+/+) and homozygous mutant (−/−) embryos using primers complementary to the 11th and 14th exon of the semaphorin-4B gene. M, molecular weight marker (smart ladder).
DISCUSSION
In the present study, we have validated a gene trap strategy for inducing genome wide mutations in secretory pathway genes. By employing a CD2/neomycinphosphotransferase fusion gene (Ceo) in a retroviral gene trap vector, we have selected for productive gene trap events that are largely dependent on the acquisition of a signal sequence and/or a transmembrane domain from an endogenous gene. Of the ES cell lines isolated with these gene traps, 80% had insertions in secretory pathway genes. Analysis of several insertions in X-chromosomal genes and the passage of two trapped autosomal genes to the mouse germline revealed that the secretory Ceo traps are highly mutagenic in vitro and in vivo.
A similar strategy involving gene trap vectors that encode a βgeo fusion protein along with a CD4 transmembrane domain has been used previously to isolate ES cell lines with mutations in secretory genes (8). However, the plasmid vectors employed in that screen were not particularly efficient due to a high background of non-productive trapping events. Indeed, <1 in 10 cell lines recovered after electroporation and G418 selection harbored insertions in secretory genes (16), a frequency almost an order of magnitude below that achieved by the current vectors. While the reasons for the different trapping efficiencies are not entirely clear, two factors could have played a crucial role in generating the non-productive trapping events. First, βgeo is about three times larger than Ceo and is likely to be less stable in combination with a signal sequence. Second, plasmid vectors delivered by electroporation are sensitive to nucleases and undergo truncations that may lead to improper splicing (16). Moreover, unlike the retroviruses, plasmid vectors can induce deletions within the target DNA. Nevertheless, the secretory plasmid traps were used by the BayGenomics consortium to assemble a library of ∼1200 ES cell lines with mutations in secretory genes (3) (http://baygenomics.ucsf.edu). Of the ∼400 unique genes trapped, 159 overlap with the Ceo library. By adding the BayGenomics effort to the 717 unique genes trapped in this screen, a total of 958 different genes were trapped in the public domain, corresponding to ∼10% of all secretory genes predicted by the ENSEMBL database. Most importantly, 525 (55%) of these genes have not been previously trapped by conventional strategies, indicating that secretory and conventional strategies are complementary. All trapped lines are freely available to the scientific community and can be ordered directly over the IGTC's web page (http://www.genetrap.org).
Analysis of the existing gene trap resources indicates that gene trapping is more efficient than gene targeting only up to ∼40% of all mouse genes, after which the mutation rate falls to a level comparable to gene targeting (6). However, a recently published strategy involving the insertion of a gene trap cassette into a target gene by homologous recombination promises to be more efficient than gene trapping even before it reaches 40% saturation (17,18). As with gene trapping, the selection of recombinants relies on gene expression, yielding over 50% of correctly targeted events (18). In addition to its efficiency, the strategy is attractive because it uses generic cassettes that simplify the design of targeting vectors.
We conclude that the gene traps described in this study are well suited for both random and targeted mutagenesis of secretory genes that are expressed in ES cells. Furthermore, we believe that a balance between targeting and trapping will be the most efficient and cost-effective strategy for generating a complete collection of null and conditional mutations in mice. This balance needs to take into account the progressively decreasing trapping rates on one hand, and the effort required for designing and cloning individual targeting vectors on the other.
SUPPLEMENTARY DATA
Supplementary Data are available at NAR Online.
Supplementary Material
Acknowledgments
The authors thank Dr William C. Skarnes for helpful discussions and for reviewing the final manuscript. The authors also thank Julia Schmidt, Corinna Strolz, Silke Garkisch, Carsta Werner, Beata Thalke and Dorotha German for excellent technical assistance. This work was supported by grants from the Bundesministerium für Bildung und Forschung (BMBF) to the German Gene Trap Consortium and the Deutsche Forschungsgemeinschaft to H.v.M. Funding to pay the Open Access publication charges for this article was provided by BMBF.
Conflict of interest statement. None declared.
REFERENCES
- 1.Stanford W.L., Cohn J.B., Cordes S.P. Gene-trap mutagenesis: past, present and beyond. Nature Rev. Genet. 2001;2:756–768. doi: 10.1038/35093548. [DOI] [PubMed] [Google Scholar]
- 2.Zambrowicz B.P., Abuin A., Ramirez-Solis R., Richter L.J., Piggott J., BeltrandelRio H., Buxton E.C., Edwards J., Finch R.A., Friddle C.J., et al. Wnk1 kinase deficiency lowers blood pressure in mice: A gene-trap screen to identify potential targets for therapeutic intervention. Proc. Natl Acad. Sci. USA. 2003;100:14109–14114. doi: 10.1073/pnas.2336103100. [DOI] [PMC free article] [PubMed] [Google Scholar]
- 3.Stryke D., Kawamoto M., Huang C.C., Johns S.J., King L.A., Harper C.A., Meng E.C., Lee R.E., Yee A., L'Italien L., et al. BayGenomics: a resource of insertional mutations in mouse embryonic stem cells. Nucleic Acids Res. 2003;31:278–281. doi: 10.1093/nar/gkg064. [DOI] [PMC free article] [PubMed] [Google Scholar]
- 4.Hansen J., Floss T., Van Sloun P., Fuchtbauer E.M., Vauti F., Arnold H.H., Schnutgen F., Wurst W., von Melchner H., Ruiz P. A large-scale, gene-driven mutagenesis approach for the functional analysis of the mouse genome. Proc. Natl Acad. Sci. USA. 2003;100:9918–9922. doi: 10.1073/pnas.1633296100. [DOI] [PMC free article] [PubMed] [Google Scholar]
- 5.Wiles M.V., Vauti F., Otte J., Fuchtbauer E.M., Ruiz P., Fuchtbauer A., Arnold H.H., Lehrach H., Metz T., von Melchner H., et al. Establishment of a gene-trap sequence tag library to generate mutant mice from embryonic stem cells. Nature Genet. 2000;24:13–14. doi: 10.1038/71622. [DOI] [PubMed] [Google Scholar]
- 6.Skarnes W.C., von Melchner H., Wurst W., Hicks G., Nord A.S., Cox T., Young S.G., Ruiz P., Soriano P., Tessier-Lavigne M., et al. A public gene trap resource for mouse functional genomics. Nature Genet. 2004;36:543–544. doi: 10.1038/ng0604-543. [DOI] [PMC free article] [PubMed] [Google Scholar]
- 7.Skarnes W.C., Moss J.E., Hurtley S.M., Beddington R.S. Capturing genes encoding membrane and secreted proteins important for mouse development. Proc. Natl Acad. Sci. USA. 1995;92:6592–6596. doi: 10.1073/pnas.92.14.6592. [DOI] [PMC free article] [PubMed] [Google Scholar]
- 8.Mitchell K.J., Pinson K.I., Kelly O.G., Brennan J., Zupicich J., Scherz P., Leighton P.A., Goodrich L.V., Lu X., Avery B.J., et al. Functional analysis of secreted and transmembrane proteins critical to mouse development. Nature Genet. 2001;28:241–249. doi: 10.1038/90074. [DOI] [PubMed] [Google Scholar]
- 9.Gebauer M., von Melchner H., Beckers T. Genomewide trapping of genes that encode secreted and transmembrane proteins repressed by oncogenic signaling. Genome Res. 2001;11:1871–1877. doi: 10.1101/gr.202601. [DOI] [PMC free article] [PubMed] [Google Scholar]
- 10.Schnutgen F., De-Zolt S., Van Sloun P., Hollatz M., Floss T., Hansen J., Altschmied J., Seisenberger C., Ghyselinck N.B., Ruiz P., et al. Genomewide production of multipurpose alleles for the functional analysis of the mouse genome. Proc. Natl Acad. Sci. USA. 2005;102:7221–7226. doi: 10.1073/pnas.0502273102. [DOI] [PMC free article] [PubMed] [Google Scholar]
- 11.Austin C.P., Battey J.F., Bradley A., Bucan M., Capecchi M., Collins F.S., Dove W.F., Duyk G., Dymecki S., Eppig J.T., et al. The knockout mouse project. Nature Genet. 2004;36:921–924. doi: 10.1038/ng0904-921. [DOI] [PMC free article] [PubMed] [Google Scholar]
- 12.Auwerx J., Avner P., Baldock R., Ballabio A., Balling R., Barbacid M., Berns A., Bradley A., Brown S., Carmeliet P., et al. The European dimension for the mouse genome mutagenesis program. Nature Genet. 2004;36:925–927. doi: 10.1038/ng0904-925. [DOI] [PMC free article] [PubMed] [Google Scholar]
- 13.Andreu T., Beckers T., Thoenes E., Hilgard P., von Melchner H. Gene trapping identifies inhibitors of oncogenic transformation. The tissue inhibitor of metalloproteinases-3 (TIMP3) and collagen type I alpha2 (COL1A2) are epidermal growth factor-regulated growth repressors. J. Biol. Chem. 1998;273:13848–13854. doi: 10.1074/jbc.273.22.13848. [DOI] [PubMed] [Google Scholar]
- 14.Friedrich G., Soriano P. Promoter traps in embryonic stem cells: a genetic screen to identify and mutate developmental genes in mice. Genes Dev. 1991;5:1513–1523. doi: 10.1101/gad.5.9.1513. [DOI] [PubMed] [Google Scholar]
- 15.Bushman F.D. Targeting survival: integration site selection by retroviruses and LTR-retrotransposons. Cell. 2003;115:135–138. doi: 10.1016/s0092-8674(03)00760-8. [DOI] [PubMed] [Google Scholar]
- 16.Skarnes W.C. Gene trapping methods for the identification and functional analysis of cell surface proteins in mice. Methods Enzymol. 2000;328:592–615. doi: 10.1016/s0076-6879(00)28420-6. [DOI] [PubMed] [Google Scholar]
- 17.Skarnes W.C. Two ways to trap a gene in mice. Proc. Natl Acad. Sci. USA. 2005;102:13001–13002. doi: 10.1073/pnas.0506279102. [DOI] [PMC free article] [PubMed] [Google Scholar]
- 18.Friedel R.H., Plump A., Lu X., Spilker K., Jolicoeur C., Wong K., Venkatesh T.R., Yaron A., Hynes M., Chen B., et al. Gene targeting using a promoterless gene trap vector (‘targeted trapping’) is an efficient method to mutate a large fraction of genes. Proc. Natl Acad. Sci. USA. 2005;102:13188–13193. doi: 10.1073/pnas.0505474102. [DOI] [PMC free article] [PubMed] [Google Scholar]
Associated Data
This section collects any data citations, data availability statements, or supplementary materials included in this article.


