Abstract
A crystal structure has been obtained for a 26-nucleotide RNA that contains the loop E sequence from Chromatium minutissimum. Rather than having a loop E-like conformation, it consists of an A-form helix that splits into two separate strands following a sheared A–G base pair. The backbone of the strand containing the G of the A–G pair makes a turn of almost 180° in the space of two nucleotides, and then interacts with the minor groove of the helix from which it originates. Similar structures, which we call hook-turns, occur in 16S and 23S rRNAs. They are found at places where the two strands of a helix separate at an A/G juxtaposition to interact with other sequences.
Keywords: RNA structure, X-ray crystallography, structural motif
INTRODUCTION
A surprising amount has been learned about the conformation of nucleic acids from the crystal structures of small oligonucleotides. The crystal structure of the Dickerson dodecamer, for example, which contains only 12 base pairs, has had a huge impact on our understanding of the conformational properties of DNA double helices (Wing et al. 1980), and the most accurate information now available about the conformation of the loop E region of Escherichia coli 5S rRNA emerged from the crystal structure of an RNA duplex that also contained only 24 nucleotides (Correll et al. 1997).
Although oligonucleotide crystal structures can be useful, it is important to remember that the energies of the interactions that stabilize crystals are of the same order as the energies of the intramolecular interactions that control oligonucleotide conformation. Furthermore, small oligonucleotides are often ambiguous conformationally, which is to say that the number of low energy conformations accessible to them is greater than one. Hence, the conformations adopted by oligonucleotides in crystals are frequently not those expected (Holbrook and Kim 1997).
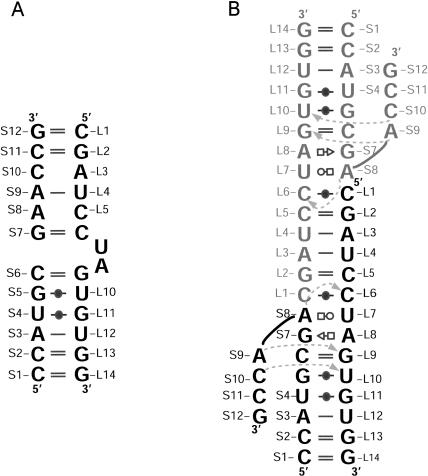
Here we report the crystal structure of a 26-nucleotide RNA duplex (called BCh12), which has been solved to 2.5-Å resolution. The strands of BCh12 include the loop E sequence from the 5S rRNA of Chromatium minutissimum, the conformation of which is interesting because it deviates significantly from the eubacterial consensus (Fig. 1 ▶, left). In most eubacterial 5S rRNAs, loop E is a symmetric internal loop; in C. minutissimum, the 5S rRNA loop E is asymmetric. Although BCh12 migrates on native gels as a duplex of the expected molecular weight, as we shall shortly see, it dimerizes under crystallization conditions, and its conformation in the crystals obtained is irrelevant to that of the 5S rRNA of C. minutissimum.
FIGURE 1.
Sequence schematics for BCh12. (Left) The sequence of BCh12 with the two stands shown in a secondary structure they might adopt if they formed a loop E-like structure. (Right) The secondary structure of the dimeric molecules found in the crystals of BCh12. The two monomers in the dimer are shown in black and gray to help with their identification. Dotted arrows indicate hydrogen bonds that are not base pairings. Base pairings are encoded in the figure and those that follow according to Leontis et al. (2002). Interactions G—(closed circle)—U, standard G–U wobble pair; G = C, standard Watson-Crick base pair; A–U, standard Watson Crick base pair; A (open square)—(open circle) U, A(N6)–U(O2), A(N7)–U(N3); C—(closed circled)—C, C(N3)–C(N4), C(O2)–C(N3-H+); A (open square)—(open sideways triangle) G, A(N7)–G(N2), A(N6)–G(N3), A(N6)–G(2′O), G—(sideways open triangle)—A, A(N3)–G(N2), A(N2)–G(N3), A(N2)–G(2′O).
The crystal structure of the BCh12 duplex is interesting nevertheless. One of its strands, the shorter strand, or S strand, folds back on itself, so that the direction of its backbone changes almost 180° in the space of two nucleotides. The second strand, longer strand or L-strand, remains mostly straight in the A-form. Turns having similar backbone trajectories occur in both 23S and 16S rRNAs, and a consensus sequence for such turns has been identified. We suggest that turns of this general kind be called hook-turns.
RESULTS
Solving the structure of BCh12
In the course of this work, seven RNAs that include the loop E sequence from C. minutissimum were tested for crystallization. Two of them crystallized, but only one, BCh12 (Fig. 1 ▶, left), yielded crystals that diffract to atomic resolution. BCh12 crystallizes at 19°C in 1.8 M ammonium sulfate, 5 mM MgCl2, 1 mM sperimidine, 50 mM Tris-HCL, and pH 7.5. The largest crystals obtained were roughly 100 × 50 × 50 μm. They were stabilized in 2.2 M ammonium sulfate, 5 mM MgCl2, 1 mM spermidine, 50 mM Tris-HCl, and pH 7.5, and frozen in the same buffer with 20% sucrose and 10% xylitol added as cryoprotectants.
The diffraction patterns given by these crystals invariably showed the simultaneous presence of two lattices, both of which could sometimes be indexed separately. The data indicate that these crystals belong to the monoclinic space group C2, and that the unit cell dimensions are: a = 29.9 Å, b = 62.4 Å, c = 50.7 Å, and β is 98.0°. The statistics for the data sets collected are given in Table 1 ▶. The Matthews coefficient of these crystals is 2.3 Å3/Dalton, which, allowing for the difference in partial specific volume between RNA and protein, suggests that there is one molecule per asymmetric unit and a solvent content of approximately 60%.
TABLE 1.
Statistics of the X-ray data collection
| BCh12 datasetb | Bch12-Br-S4 datasetc | |
| Resolution range (Å) | 16.0–2.5 | 15.0–2.5 |
| Wavelength (Å) | 1.5418 (CuKα) | 0.91939 (Bromine fluorescent peak) |
| Space group | C2 | C2 |
| Unit cell | ||
| a (Å) | 29.858 | 29.89 |
| b (Å) | 62.353 | 62.465 |
| c (Å) | 50.658 | 50.778 |
| β (°) | 97.973 | 98.22 |
| Total observations | 20977 | 56979 |
| Unique reflections | 2531 | 3175 |
| Intensity/σ intensity | 4.63 | 10.35 |
| (Last shell) | 1.24 | 2.55 |
| Completeness (%) | ||
| Overall | 78.6 | 98.6 |
| (Last shell) | 76.4 | 98.5 |
| Rsyma | ||
| Overall | 0.121 | 0.128 |
| (Last shell) | 0.555 | 0.342 |
| Rcross (with native dataset) | 0.120 | |
| Assymetric unit | 1 molecule |
aRsym = Σ|I − ≤I>|/ΣI
bData collected using a Rigaku RU200 rotating anode X-ray source equipped with focusing mirrors and R-Axis IIc detector.
cData collected at NSLS beam-line X25 using a Brandeis CCD detector.
Table 1 ▶ also reports the statistics for data obtained from a Br derivative (BCh12–Br-S4), that ultimately was used to verify initial molecular replacement results. In this derivative, the U at the fourth position of the shorter strand, U(S4), was replaced by a 5-bromouridine. BCh12–Br-S4 crystallized in 1.9 M ammonium sulfate under conditions otherwise the same as those described for BCh12, and a data set was collected from a BCh12–Br-S4 crystal at the wavelength corresponding to the bromine fluorescence peak using beamline X-25 at the National Synchrotron Light Source (Brookhaven National Laboratory). Br-S4 was the only one of the five brominated derivatives of BCh12 tested that yielded crystals isomorphous with the native ones.
A single wavelength anomalous difference (SAD) Patterson map computed using the Br-S4 data had unmistakable positive peaks in its Harker section, which appeared at the same positions as peaks seen in the Harker section of an isomorphous difference Patterson map computed using the Br-S4 and native data (data not shown). This confirms that an isomorphous derivative had indeed been obtained. However, the intrinsic mirror symmetry of single-site derivatives in the space group of C2 means that SIR or SAD electron density maps computed using such data will be uninterpretable because they are superpositions of the image of the molecule of interest and its mirror image. The mirror image electron density can be suppressed only by including in phase calculations data obtained from a second derivative containing a heavy atom, the y coordinate of which is different from the heavy atom y coordinate of the first derivative. Because at this stage we had not been able to find a second derivative, we attempted to solve the structure of these crystals by molecular replacement.
In an initial set of molecular replacement computations, 6 to 12 base pair A-form RNA helices were generated using the program NAMOT (Tung and Carter 1994), which allows the base pair twist, roll, and tilt to be varied. Rotation and translation searches were done using AMoRe (Navaza 2001) to position a large number of NAMOT models in the unit cell, and the initial models so identified refined by energy minimization (Brunger et al. 1998). In some trials, models were placed in the unit cell so that the position of C5 of U(S4) would be consistent with the position found for the bromine atom in Br-S4 difference Patterson maps. None of these partial solutions could be further refined.
Ultimately, the structure was solved by molecular replacement starting with a shorter, five-base pair RNA helix consisting entirely of A–U pairs, and there might be two reasons why this approach worked better than the one just described. First, the secondary structure predicted for BCh12 suggested that it would almost certainly contain an A-form double-helix five-base pairs long, but that it might not contain a double helix longer than that. Second, the native Patterson map computed using the data between 3.4- and 2.5-Å resolution gave ladders of stripes at the spacing characteristic of the base-to-base separation in nucleic acid double helices, and the ladders had five strong “rungs” and 1 weak “rung”, consistent with the presences of a double helix containing five or six base pairs. The orientation of that ladder, of course, indicated the orientation of the helix. Similar striping in the Patterson maps obtained for crystals containing helical oligonucleotides have been reported in the past (Klosterman 1998).
The initial molecular replacement solution found using this five-base pair model, was subjected to rigid body refinement, followed by cycles of simulated annealing and individual B-factor refinement in CNS (Brunger et al. 1998), using the data from 16.0- to 3.0-Å resolution. This model included the U at S4, the base that is brominated in BCh12–Br-S4, and the position of that U in the molecular replacement solution found was consistent with the location determined for the bromine atom in Br-S4 crystals by difference Patterson methods. The free R-factor for this model was 48.7%, and a composite-omit map generated using model phases revealed the position of an additional base pair. A six-base pair model was constructed on the basis of this information, and the process just described repeated. The molecular replacement solution that emerged from the second iteration had a significantly lower free R-factor than the first (43.0%), and the map computed using phases obtained from this molecular replacement solution included electron density for a seventh base pair. A seven-base pair model was accordingly constructed, the sequence of which was made to correspond to the sequence of BCh12, and after a few more cycles, a map emerged that included electron density for the entire molecule. Table 2 ▶ gives the statistics for the final, refined structure, which was computed using the Br-S4 data set, which is more complete and better measured than the native data set used in the initial analysis.
TABLE 2.
Refinement statistics
| Resolution (Å) | 15–2.5 |
| R-factor | 24.3 |
| Rfree | 27.7 |
| Number of atoms | 549 |
| Number of water molecules | 21 |
| Average B-factor, RNA atoms (Å2) | 55.8 |
| r.m.s. deviation bond lengths (Å) | 0.006 |
| r.m.s. deviation bond angles (°) | 1.1 |
R factor = Σ∥Fo| − |Fc∥/Σ|Fo| where |Fo| and |Fs| are the observed and calculated structure factors, respectively.
Free R-factor is the same as R-factor determined for the 10% of the reflections excluded from refinement.
The conformation of BCh12
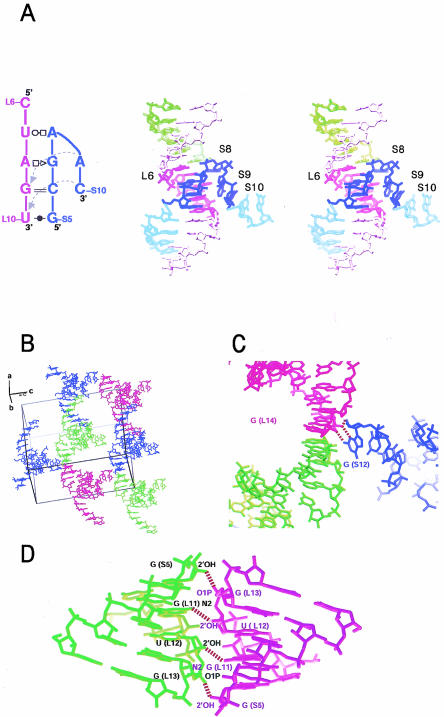
Had BCh12 crystallized in a loop E-like conformation, the S strand would have been paired with the L strand over most of its length, as Figure 1 ▶, left, suggests. Figure 2A ▶ shows that this is not the case. The S strand pairs with the L strand from S1 through S7, but then bends sharply back on itself. The reason it adopts this conformation is that the sequence of the L strand is self-complementary from L2 to L5. Thus, BCh12 can form a dimer in which the base pairs formed between the G(L2)–C(L5) sequences of adjacent molecules keep the S strand from interacting with the L strand in that region (Fig. 1 ▶, right).
FIGURE 2.
The structure of BCh12 and its crystal packing interactions. (A) Stereodiagram of the structure of BCh12, secondary structure of the turn region shown on the left. Blue: the S (shorter) strand of a monomer. Purple: the L (longer) strand that forms a helix with the blue S strand. Green: the portion of the L strand of the neighboring monomer that forms a double helix with the L1–L6 region of the purple stand (see Fig. 1 ▶). (B) A global view of the unit cell in the BCh12 crystal, with monomers shown in different colors to aid in distinguishing them. (C) The blunt end stacking contact that aligns successive BCh12 dimers in the crystal along the crystallographic b-axis, and the S12–L14 contact that fixes the relative positions of parallel dimers in the c-axis direction. (D) The interaction between the adjacent dimer helices that positions neighbors in the a-axis direction.
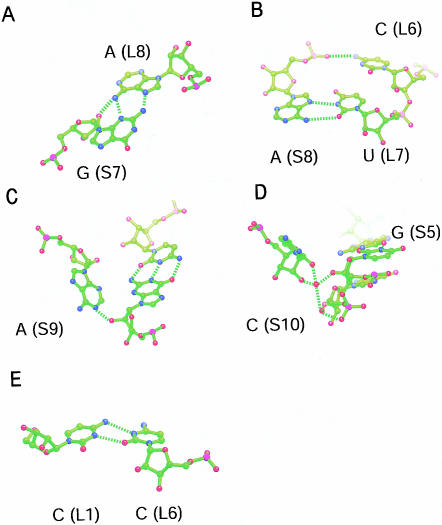
The backbone of the L strand of a BCh12 monomer follows an A-form-like trajectory over its entire length, but its S strand does not. The backbone of the 5′ half of the S strand is A-form-like, with its first six nucleotides forming Watson-Crick or wobble GU base pairs with L9–L14. The first deviation from standard geometry in the S strand occurs at G(S7), which forms a sheared GA pair with A(L8) (Fig. 3A ▶). The following nucleotide, A(S8), makes a reversed Hoogsteen pair with U(L7) (Fig. 3B ▶) that is made possible by a 107° change in the backbone direction of the S strand and is additionally stabilized by a hydrogen bond between the phosphate group of A(S8) and the exocyclic amino group of C(L6) (distance: 3.22 Å) (Fig. 3B ▶). An additional 98° change in backbone direction occurs at A(S9), which makes a type I A-minor interaction with the C(S6)–G(L9) base pair (Nissen et al. 2001) (Fig. 3C ▶). The final interaction between the S strand and the L strand is a water-mediated interaction between the 2′OH groups of C(S10) and U(L10) (Fig. 3D ▶).
FIGURE 3.
Non-Watson-Crick base interactions in BCh12. (A) The sheared G(S7)–A(L8) pair. (B) The reversed-Hoogsteen pairing of A(S8) and U(L7), showing the interaction of the phosphate group of A(S8) with N4 of C(L6). (C) The A-minor interaction between A(S9) and the G(L9)–C(S6) base pair. (D) The water-mediated interaction of C(S10) with U(L10). (E) The C(L1)–C(L6) base pair in the dimerization helix.
The last base base interaction of interest is the C(L1)–C(L6) pair formed as a consequence of the dimerization of BCh12 monomers. As Figure 3E ▶ indicates, the pairing juxtaposes the N4 of C(L1) with the N3 of C(L6) (distance: 2.93 Å), and the N3 of C(L1) with the O2 of C(L6) (distance: 3.02 E). The N3 of C(L1) must be protonated in this structure.
Crystal packing
In addition to forming dimers, the four BCh12 molecules in each unit cell make three other kinds of contacts (Fig. 2B ▶). First, adjacent dimers stack coaxially, end to end, with the S1–L14 CG pair of one molecule stacking on the S1–L14 CG pair of a neighbor (Fig. 2C ▶). This interaction creates long rods of imperfect double helix that extend indefinitely through the crystal. Second, a weaker interaction, which involves hydrogen bonding between the 3′ terminal nucleotide of the S strand, G(S12), and the dimerization region of a neighboring dimer, stabilizes the relationship between parallel helical rods, organizing them into planar sheets. N3 of G(S12) hydrogen bonds with the 2′OH of G(L7), and 2′OH of G(S12) forms a hydrogen bond with the O2 of G(L15) (Fig. 2C ▶). A third interaction stabilizes the relationship between adjacent sheets of helices. In the dimerization region, the helices of two molecules interact with each other between the 2′OH of G(S5) and the O1P of G(L13) and between the N2 of G(L11) and the 2′OH of U(L12) (Fig. 2D ▶).
The identification of rRNA substructures resembling BCh12
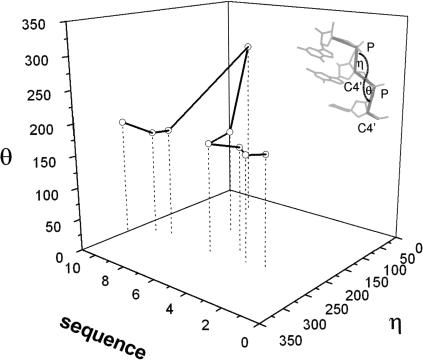
Are there turns in other RNAs that resemble the S-strand turn described here? To answer this question we initially used PRIMOS, a computer program for analyzing nucleic acid conformation written by Duarte and Pyle (1998). In this program the backbone conformation of each nucleotide in a large nucleic acid is represented using two pseudo torsion angles, η and θ, as shown in Figure 4 ▶ (insert). Using this convention, the backbone conformation of a nucleic acid chain can be represented as a point in the three-dimensional graph, the axes of which are sequence number, η and θ. Figure 4 ▶ is the η/θ graph that corresponds to nucleotides S2–S11 of BCh12. Using reduced representations like this, PRIMOS rapidly identifies regions in large RNA structures that match whatever template the user chooses.
FIGURE 4.
The sequential η/θ plot for the S strand of BCh12. Insert: the definitions of the backbone pseudo-angles η and θ (Duarte and Pyle 1998).
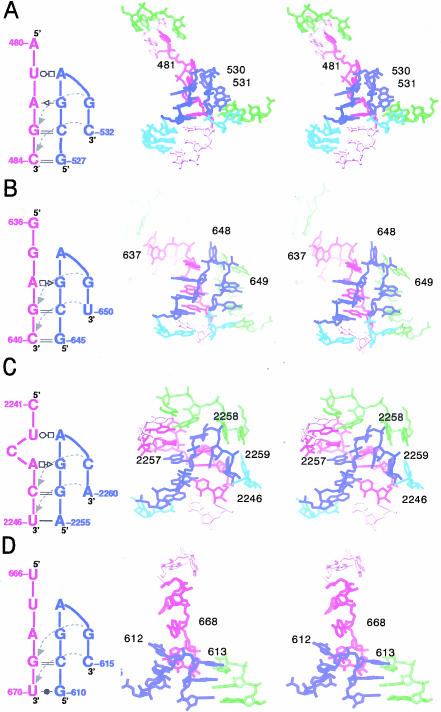
A PRIMOS search of the coordinates of 23S rRNA from Haloarcula marismortui (pdb access code: 1jj2; Klein et al. 2001), 23S rRNA from Deinococcus radiodurans (pdb access code: 1kc9; Harms et al. 2001), and 16S rRNA from Thermus thermophilus (pdb access codes: 1fka, 1j5e; Schluenzen et al. 2000; Wimberly et al. 2000) identified four sequences that have backbone trajectories resembling that of the S6–S9 sequence in BCh12 (shown in Fig. 2 ▶). One such sequence was found in T. thermophilus 16S rRNA, two more were found in the 23S rRNA of D. radiodurans, and a fourth was located in the 23S rRNA of H. marismortui. Figure 5A–D ▶ shows the structures of the BCh12-like substructures found in these RNAs. Table 3 ▶ gives the rmsd difference between phosphorus atoms of the test sequence, S6–S9, and the corresponding nucleotides of the structures found in the three rRNAs searched (Table 3 ▶, upper right), and between phosphorus atoms of the heart of the BCh12 structure, S6–S10/ L7–L10, and the corresponding atoms in those rRNA substructures (Table 3 ▶, lower left).
FIGURE 5.
Stereodiagrams of some hook-turns found in rRNAs. The secondary structure of each turn is shown to the left of the stereodiagram of the structure to which it corresponds. The sequences that correspond to the blue and purple strands in each secondary structure diagram are colored blue and purple in the stereodiagram. Light red and cyan sequences are the continuations of the purple and blue sequences, respectively. Green sequences represent other sequences that contact with the turn in question. (A) T. thermophilus 16S rRNA; (C527–C532 and A480–C484) pdb: 1i94. (B) D. radiodurans 23S rRNA; (C645–U650 and G636–C640) pdb: 1kc9. (C) H. marismortui 23S rRNA; (G2255–A2260 and C2241–U2246) pdb: 1jj2. (D) D. radiodurans 23S rRNA; (C610–C615 and U666–U670) pdb: 1kc9.
TABLE 3.
Root-mean-square deviation between ribosomal hook-junctions and BCh12 calculated using the phosphorus atom positionsa
| BCh12 | A | B | C | D | |
| BCh12 | 1.66 | 1.30 | 2.14 | 2.73 | |
| A | 2.23 | 1.03 | 3.09 | 2.25 | |
| B | 2.61 | 1.18 | 2.55 | 2.62 | |
| C | 1.86 | 3.18 | 3.38 | 4.47 | |
| D | 3.13 | 2.13 | 2.40 | 4.48 |
Nucleotides compared: BCh12 (S5–S10 and L7–L10); A, T. thermophilus 16S rRNA (G527–C532 and U481–C484), pdb: li94; B, D. radiodurans 23S rRNA (G645–U650 and G637–C640), pdb: 1kc9; C, H. marismortui 23S rRNA (A2255–A2260 and U2242– U2246); pdb: 1jj2; D, D. radiodurans 23S rRNA (C610–C615 and U667–U670) pdb: 1kc9.
aRight side of table shows values for only the turning strand (corresponding to S5–S10 of BCh12), left side show overlay of the complete junction (S5–S10 and L7–L10).
On the 5′ side of the turn, all of the substructures identified by the PRIMOS search have a segment of double helix that ends with a G on the S-strand side and an A on the L-strand side, just like BCh12, immediately following the G and A, the two strands separate at an A, with the equivalent of the S strand bending back on itself. Figure 5A,B ▶shows the two segments found that most closely resemble BCh12 and the interactions they make with neighboring sequences. It is evident that the S-strand turn in these molecules is not stabilized the same way as in BCh12. Furthermore, in none of these structures does the L strand continue in an A-form-like trajectory as it does in BCh12, and hence, they all lack an equivalent to the A(S8)–U(L7) and A(S8)–G(L9) pairings described above. In addition, in none of these structures does the sheared GA seen in BCh12 actually form, even though their sequences all include an appropriately juxtaposed G and A. The third and fourth structures in this series (Fig. 5C,D ▶) deviate from BCh12 even more. Clearly, sharp turns like that seen in the S strand of BCh12 can occur in many different contexts.
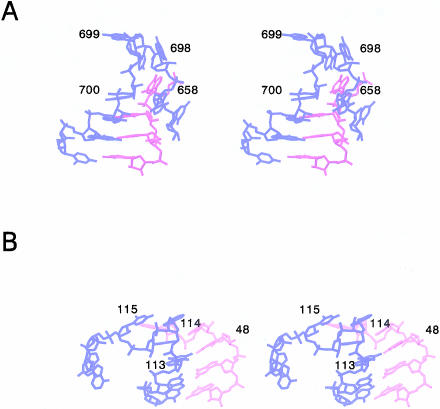
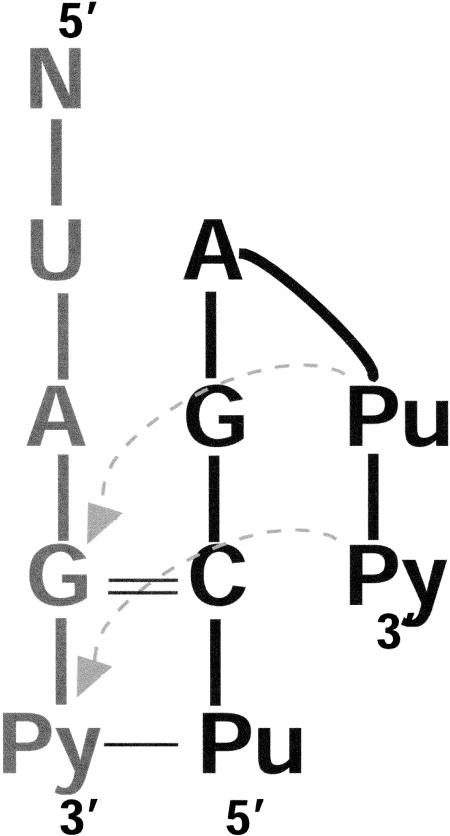
Structures resembling the S strand of BCh12 were also sought in rRNAs using a simpler technique that looked for successive phosphorus–phosphorus angles in the backbone of a large RNA that matched the phosphorus–phosphorus angles of the turning nucleotides (S7–S10 in BCh12), within some predetermined tolerance. Not only was it required that the S7–S8–S9, and S8–S9–S10 phosphorus–phosphorus angles of these substructures (α[S8] and α[S9], respectively) be similar, but that the angle between the S7–S8 and S9–S10 vectors, β(S8), be similar also. As expected, this search identified a larger set of turns than the PRIMOS search had done. Using as the search template a set of phosphorus–phosphorus angles within 10° of those of the average for BCh12 and the two PRIMOS-identified substructures that most closely resemble BCh12 (α2 = 112 ± 10°, α3 = 80 ± 10°, β1 = 155 ± 10°), seven new substructures were identified in the 23S rRNA from H. marismortui, and one more was found in the 16S rRNA from T. thermophilus. Figure 6A,B ▶shows two such structures, one of which is similar to the BCh12 turn in a generic sense (Fig. 6A ▶), and in the other (Fig. 6B ▶) the turn is clockwise, as shown, rather than counterclockwise! Nevertheless, despite these variations in geometry and local hydrogen bonding interactions, these turns appear to have a consensus sequence (Fig. 7 ▶). It should be noted that if the tolerance in the angles used to search existing rRNA structures is expanded, additional sharp turns can be found that are hook-like in conformation. Although they all occur at the ends of helical segments, the further their angles deviate from the BCh12 standard, the more their sequences vary from the consensus shown in Figure 7 ▶.
FIGURE 6.
Stereodiagram of hook-turn relatives and their regions found by phosphate angle search. (A) T. thermophilus 16S rRNA (A696–C703 and G655–G658) pdb: 1i94. (B) H. marismortui 23S rRNA (U111–A117 and G47–G50) pdb: 1jj2.
FIGURE 7.
Consensus secondary structure derived for the hook-turn motif.
DISCUSSION
We refer to the sharp bend in the S strand of BCh12 as a “hook-turn”, and have come to believe that a case can be made for considering hook-turns an RNA motif. A motif is any small RNA substructure that is found in larger RNA molecules at a frequency high enough so that it can be recognized as being distinctive. Some motifs have sequences unique enough so that they can be reliably identified in RNAs of unknown three-dimensional structure, once their secondary structures have been worked out (e.g., GNRA tetraloops), but others do not (e.g., the ribose zipper).
The one feature all of the hook-turns identified so far share is a distinctive backbone trajectory. On the 5′ side of the turn, the conformation of the hooked strand, that is, the S strand is A-form-like, and it is invariably part of a double helix. The ∼180° change in backbone direction characteristic of hook-turns is accomplished in two nucleotides, and in BCh12-like hook-turns, the Watson-Crick faces of the bases immediately following the turn are oriented in about the same direction as the Watson-Crick faces of the bases immediately preceding it. In many cases, a few bases after the turn, the S strand becomes part of a double helix that involves a partner strand from some other part of the larger RNA in which it is embedded. 5′ to the helix it forms with the S strand, the conformation of the L strand varies enormously from one hook-turn to the next, but it, too, is usually paired with sequences that are only distantly connected with the S strand.
Only two of the rRNA structural elements identified so far have sugar-phosphate backbones that closely match BCh12 (Table 3 ▶). Thus, one is led to ask how close a pair of substructures must be, as judged by RMSD criteria, to be reasonably considered examples of the same motif. The experience obtained with the K-turn motif is instructive in this regard (Klein et al. 2001). The K-turn is a helix-loop-helix element, representatives of which are seen in both 16S and 23S rRNA, and they tend to be involved in protein–RNA interactions. The smallest RMSD value obtained between the phosphate atoms of two different K-turn elements was 1.3 Å (D. Klein, pers. comm.), and the average RMSD value for all K-turns is 1.7 Å. The average RMSD value of the two best-matched ribosomal hook-turns together with the BCh12 structure is 2.0 Å, and the two elements found in ribosomal RNA that correspond best to the Bch12 motif superimpose on each other with a phosphorus atom RMSD of 1.03 Å (Table 3 ▶). Thus, BCh12 and structures A and B superimpose about as accurately as the structures identified as K-turns. Thus, there is a quantitative case for considering hook-turns a motif.
There are, of course, other RNA motifs known that result in ∼180° changes in the general direction of the backbone, for example, GNRA tetraloops (Moore 1999). However, the phosphorus–phosphorus angles associated with the two turning phosphate atoms at the end of these other loops are very different from those seen in hook-turns. For example, bases in the GNRA tetraloops in H. marismortui 23S rRNA (Klein et al. 2001) have the following angles associated with them: α2 = 95°–104°, α3 = 128°–137°, β1 = 98°–110°.
All of the hook-turns identified so far occur in regions of ribosomal RNA where the strands of a duplex separate so that they can interact with other RNA regions. They are never “used” to cap a helical segment. Given the variability in geometry and base pairing they display, it is surprising that they appear to be associated with a consensus sequence. So far, almost all of the hook-turns identified start at the end of a Watson-Crick helix that terminates with a G on the S-strand side, and an A on the L-strand side, and the probability is high that the nucleotide following the initiating G in the S strand will be an A. In addition, the last base pair in the helix before the G–A juxtaposition is almost always a GC with the C in the S strand.
It has been noted in the past that helices ending with GA juxtapositions are more abundant in RNA secondary structures than expected statistically (Limmer 1997). One wonders whether they are abundant in RNAs because the three-dimensional structures of rRNA include so many hook-turns, or whether hook-turns appear to have the consensus sequence they do because helices that end with GA pairs are hyperabundant in rRNA for other reasons.
MATERIALS AND METHODS
Single-stranded RNA oligonucleotides of the desired sequence were synthesized chemically by Dharmacon Research. The purity of all samples was tested over 99% on a denaturing 20% acrylamide/8.3 M urea/1X TBE gel. Nucleotide deprotection was then done according to the protocol and the deprotection buffer (100 mM TEMED-Acetate pH 3.8) supplied by Dharmacon. The resulting samples were gel purified according to Correll et al. (1998), and dialyzed against water for three 4-h periods prior to use.
Equimolar amounts of complementary strands each at a concentration of 0.1 mM were prepared in 1 mL 5 mM MgCl2, 25 mM MES, pH 6.5. These mixtures were heated to 65°C in a large water bath, which was then allowed to cool to room temperature over 1–2 h. The resulting duplexes were concentrated to 0.5 mM. Small amounts of all complexes were run on native 20% acrylamide gels in the annealing buffer described to ensure that samples contained only a single component, and that the desired duplex had formed. Crystals were grown using the sitting drop method.
The equipment used for home-source data collection was a Rigaku RU200 rotating anode X-ray source equipped with focusing mirrors and R-Axis IIc dectector. The data obtained using this equipment as well as data obtained at NSLS were indexed and merged using the DENZO/SCALEPACK package (Otwinowski 1997). The native and the anomalous derivative datasets were scaled together using the SCALEIT program package (Bailey 1994) of the CCP4 program suite, and both an anomalous difference Patterson and an isomorphous difference Patterson map were calculated using the FFT program of the CCP4 package. Figures were generated by RIBBONS (Carson 1991). Coordinates for the structure of BCh12 have been deposited in the Protein Data Bank (PDB #1mhk).
Acknowledgments
We thank C. Duarte for useful discussions and allowing us to use the PRIMOS search program prior to public release to identify ribosomal representatives of our motif. This work was supported by a grant from the NIH (GM2278).
The publication costs of this article were defrayed in part by payment of page charges. This article must therefore be hereby marked “advertisement” in accordance with 18 USC section 1734 solely to indicate this fact.
Article and publication are at http://www.rnajournal.org/cgi/doi/10.1261/rna.2107303.
REFERENCES
- Bailey, S. 1994. The CCP4 Suite—Programs for protein crystallography. Acta Crystallogr. D Biol. Crystallogr. 50: 760–763. [DOI] [PubMed] [Google Scholar]
- Brunger, A.T., Adams, P.D., Clore, G.M., DeLano, W.L., Gros, P., Grosse-Kunstleve, R.W., Jiang, J.S., Kuszewski, J., Nilges, M., Pannu, N.S., et al. 1998. Crystallography & NMR system: A new software suite for macromolecular structure determination. Acta Crystallogr. D Biol. Crystallogr. 54: 905–921. [DOI] [PubMed] [Google Scholar]
- Carson, M. 1991. Ribbons 2.0. J. Appl. Crystallogr. 24: 958–961. [Google Scholar]
- Correll, C.C., Freeborn, B., Moore, P.B., and Steitz, T.A. 1997. Metals, motifs, and recognition in the crystal structure of a 5S rRNA domain. Cell 91: 705–712. [DOI] [PubMed] [Google Scholar]
- Duarte, C.M. and Pyle, A.M. 1998. Stepping through an RNA structure: A novel approach to conformational analysis. J. Mol. Biol. 284: 1465–1478. [DOI] [PubMed] [Google Scholar]
- Harms, J., Schluenzen, F., Zarivach, R., Bashan, A., Gat, S., Agmon, I., Bartels, H., Franceschi, F., and Yonath, A. 2001. High resolution structure of the large ribosomal subunit from a mesophilic eubacterium. Cell 107: 679–688. [DOI] [PubMed] [Google Scholar]
- Holbrook, S.R. and Kim, S.H. 1997. RNA crystallography. Biopolymers 44: 3–21. [DOI] [PubMed] [Google Scholar]
- Klein, D.J., Schmeing, T.M., Moore, P.B., and Steitz, T.A. 2001. The kink-turn: A new RNA secondary structure motif. EMBO J. 20: 4214–4221. [DOI] [PMC free article] [PubMed] [Google Scholar]
- Klosterman, P. 1998. Crystal structures of two plasmid copy control related RNA duplexes: An 18 base pair duplex at 1.2 A resolution and a 19 base-pair duplex at 1.55 A resolution. Ph.D. thesis. Yale University, New Haven, CT. [DOI] [PubMed]
- Leontis, N.B., Stombaugh, J., and Westhof, E. 2002. The non-Watson-Crick base pairs and their associated isostericity matrices. Nucleic Acids Res. 30: 3497–3531. [DOI] [PMC free article] [PubMed] [Google Scholar]
- Limmer, S. 1997. Mismatch base pairs in RNA. Progr. Nucl. Acid Res. Mol. Biol. 57: 1–39. [DOI] [PubMed] [Google Scholar]
- Moore, P.B. 1999. Structural motifs in RNA. Annu. Rev. Biochem. 68: 287–300. [DOI] [PubMed] [Google Scholar]
- Nissen, P., Ippolito, J.A., Ban, N., Moore, P.B., and Steitz, T.A. 2001. RNA tertiary interactions in the large ribosomal subunit: The A-minor motif. Proc. Natl. Acad. Sci. 98: 4899–4903. [DOI] [PMC free article] [PubMed] [Google Scholar]
- Otwinowski, O. and Minor, W. 1997. Processing of X-ray diffraction data collected in oscillation mode. Meth. Enzymol. 276: 307–326. [DOI] [PubMed] [Google Scholar]
- Schluenzen, F., Tocilj, A., Zarivach, R., Harms, J., Gluehmann, M., Janell, D., Bashan, A., Bartels, H., Agmon, I., Franceschi, F., et al. 2000. Structure of functionally activated small ribosomal subunit at 3.3 angstroms resolution. Cell 102: 615–623. [DOI] [PubMed] [Google Scholar]
- Tung, C.S. and Carter, 2nd, E.W. 1994. Nucleic acid modeling tool (NAMOT): An interactive graphic tool for modeling nucleic acid structures. Comput. Appl. Biosci. 10: 427–433. [DOI] [PubMed] [Google Scholar]
- Wimberly, B.T., Brodersen, D.E., Clemons, Jr., W.M., MorganWarren, R.J., Carter, A.P., Vonrhein, C., Hartsch, T., and Ramakrishnan, V. 2000. Structure of the 30S ribosomal subunit. Nature 407: 327–339. [DOI] [PubMed] [Google Scholar]
- Wing, R., Drew, H., Takano, T., Broka, C., Tanaka, S., Itakura, K., and Dickerson, R.E. 1980. Crystal structure analysis of a complete turn of B-DNA. Nature 287: 755–758. [DOI] [PubMed] [Google Scholar]


