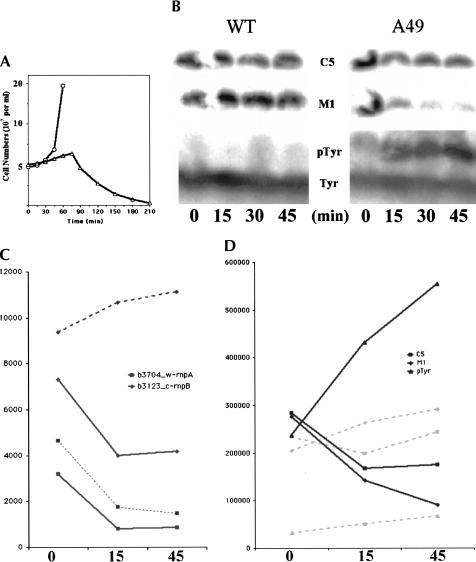
FIGURE 1.
Growth curve and analysis of M1 RNA, C5 protein and precursor to tRNATyr (pTyr RNA) of wild type (WT), and A49 strains. (A) Time course of strains WT and A49 at 43°C. The y-axis stands for the number of living cells in the media. (○) Wild type (WT); (▵) A49. (B) Northern blot of M1 RNA, C5 protein, and pTyr. The same nylon membrane was probed by different oligonucleotides complementary to the M1 RNA, C5 protein, and pTyr RNA sequences, respectively. (C) Lines with marks indicate graphic representation of M1 RNA and C5 protein from the microarray. The solid lines denote samples from A49, and the dashed lines are those from the WT strain (squares, rnpA; diamonds, rnpB). It should be noted the singlet tRNATyr gene is not present in the genome of E. coli K-12 strain MG1655 on which the Affymetrix chips were based. Therefore, there is no probe in the array for the precursor sequence to this tRNA. The y-axis is the scaled average value (the signal) of each probe after normalization and scaling from the arbitrary fluorescence units. The signal could be regarded as the relative amount of each transcript. (D) Graphic representation of M1 RNA, C5 protein, and pTyr RNA from B (solid lines, A49; dashed lines, WT; squares, C5 protein; diamonds, M1 RNA; triangles, pTyr RNA). The y-axis is the calibrated radioactivity value of bands in the gel as determined by Image Gauge 3.3 (Fuji film).

