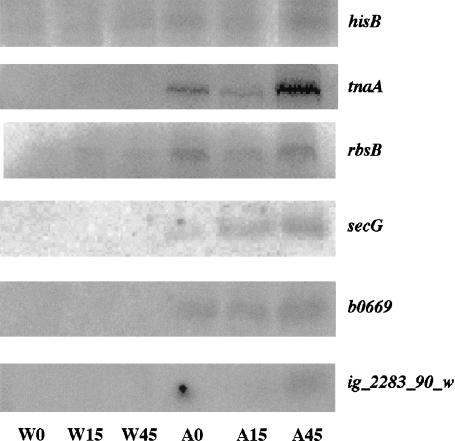
FIGURE 8.
Northern blot analysis of expression of genes from several gene clusters. RNAs, 10 μg from each of six samples (W0, W15, W45, A0, A15, A45), were loaded on a 4% polyacrylamide or a 3% agarose gels and transferred to nylon membranes. The membranes were probed by oligonucleotides complementary to the (putative) mRNA sequences of hisB, tnaA, rbsB, secG and ig_2283_90_w.

