

Abstract
Replication of human immunodeficiency virus type 1 (HIV-1) is regulated in part through an interaction between the virally encoded trans-activator protein Tat and the trans-activator responsive region (TAR) of the viral RNA genome. Because TAR is highly conserved and its interaction with Tat is required for efficient viral replication, it has received much attention as an antiviral drug target. Here, we report a 2-aminopurine (2-AP) fluorescence-based assay for evaluating potential TAR inhibitors. Through selective incorporation of 2-AP within the bulge (C23 or U24) of a truncated form of the TAR sequence (Δ TAR-ap23 and Δ TAR-ap24), binding of argininamide, a 24-residue arginine-rich peptide derived from Tat, and Neomycin has been characterized using steady-state fluorescence. Binding of argininamide to the 2-AP ΔTAR constructs results in a four- to 11-fold increase in fluorescence intensity, thus providing a sensitive reporter of that interaction (KD ~ 1 mM). Similarly, binding of the Tat peptide results in an initial 14-fold increase in fluorescence (KD ~ 25 nM), but is then followed by a slight decrease that is attributed to an additional, lower-affinity association(s). Using the ΔTAR-ap23 and TAR-ap24 constructs, two classes of Neomycin binding sites are detected; the first molecule of antibiotic binds as a noncompetitive inhibitor of Tat/argininamide (KD ~ 200 nM), whereas the second, more weakly bound molecule(s) becomes associated in a presumably nonspecific manner (KD ~ 4 μM). Taken together, the results demonstrate that the 2-AP fluorescence-detected binding assays provide accurate and general methods for quantitatively assessing TAR interactions.
Keywords: HIV-1, TAR, 2-AP, fluorescence, RNA, conformation
INTRODUCTION
In human immunodeficiency virus type 1 (HIV-1), replication is regulated in part through an interaction between the virally encoded trans-activator protein Tat and the trans-activator responsive region (TAR), a 59-nucleotide hairpin found at the 5′-end of the viral RNA genome. The secondary structure of TAR consists of two helical stem regions separated by three unpaired bases that form an internal bulge, and the terminal stem is capped by a 6-nt apical loop. Upon Tat binding to TAR, viral mRNA production is increased several hundredfold through a resulting increase in the elongation capacity of RNA polymerase (Harrich et al. 1996, 1997). Binding of Tat to TAR is mediated by a single arginine residue located in the basic portion of the protein (Calnan et al. 1991a,b). Moreover, modeling of the Tat•TAR interaction can be simplified by replacing Tat with argininamide, the amide derivative of arginine, as the same nucleotides are important for binding in both cases (Tao and Frankel 1992). High-resolution NMR studies indicate that TAR contains a specific arginine-binding site in its major groove, near base G261 (Puglisi et al. 1992), and that binding of either Tat peptides (Aboulela et al. 1995; Long and Crothers 1999), or argininamide (Puglisi et al. 1992; Aboulela et al. 1995), results in an extrusion of the 3-nt bulge that brings into coaxial alignment the previously kinked flanking stem helices (Fig. 1B, C). Changes in the bulge conformation upon binding argininamide or Tat peptides also reposition U22, such that it has the potential to form a base triple with A26 and U37 in the adjacent part of the upper helical stem (Puglisi et al. 1992).
FIGURE 1.

(A) ΔTAR sequence (Weeks and Crothers 1992). The two bulge bases (C23 and U24) that have been substituted with 2-AP are shown in red, and the bases identified as important for Tat peptide binding are shown in blue (Weeks and Crothers 1991, Weeks and Crothers 1992). (B) Schematic of the changes in stacking of the tri-nucleotide bulge upon binding argininamide or Tat peptide. (C) Solution structure of the TAR-argininamide complex [PDB 1ARJ (Aboulela et al. 1995)]. The phosphate backbone is represented by the ribbon, and the substituted bulge nucleotides (which have flipped outward with binding) are shown in yellow. Argininamide, bound in the major groove, is shown in blue.
RESULTS
Binding of argininamide to 2-AP-labeled ΔTAR
The binding of argininamide to ΔTAR could be directly monitored by 2-AP incorporated at either position 23 or 24 of the RNA sequence. In Figure 2A, the 2-AP emission intensities at 390 nm of ΔTAR-ap24 and ΔTAR-ap23 (inset) are shown as a function of total argininamide concentration. For both 2-AP probes, fluorescence is observed to increase in a saturable fashion with increasing argininamide concentration, with maximal changes of about 11- and fourfold, respectively. The direction of these fluorescence changes indicates that the ap24 and ap23 bases both become, on average, less stacked upon argininamide binding, which is consistent with their exposed positions as observed in NMR studies of the complex (Puglisi et al. 1992; Aboulela et al. 1995). The data shown in Figure 2A were analyzed by performing a nonlinear least-squares fit of the fluorescence intensity using a single site, two-state binding model (Eq. 1),
FIGURE 2.

(A) Results of a titration of ΔTAR-ap24 with argininamide. The sample temperature was 20°C. Fluorescence intensity (tens of thousands of counts per second) at 390 nm is plotted vs. total ligand concentration. Filled circles represent the experimental data, whereas the smooth line shows the fit of a single-binding-site model, which gave a KD of 1 mM. As can be seen, binding results in a >10-fold increase in fluorescence intensity, indicating that the label’s position in the bulge experiences a substantial change in environment upon association. (Inset) Argininamide titration results for the ΔTAR construct with a 2-AP label at position 23 (ΔTAR-ap23). The initial fluorescence intensity is about four times that of ΔTAR-ap24 (correcting for a factor of two difference in RNA concentration) and shows only about a threefold increase upon association. The KD is about 0.5 mM. (B) Results of a titration of ΔTAR-ap24 with a 24-amino acid fragment of the basic portion of Tat. The conditions were the same as those described above. The smooth line shows the fit of a two-nonidentical-independentsites binding model. The high affinity site has a KD of ~25 nM, and binding to it results in an apparent 11-fold increase in fluorescence intensity. The low-affinity site has a KD of several hundred nanomolar, and binding to it results in a moderate decrease in fluorescence intensity. For all of the experiments shown here, the standard deviation of the data points was typically ~0.2 %. Error bars are not shown in this (or subsequent) graphs, as they would not be visible, their range being much smaller than the diameter of the filled circles used to represent the data.
 |
(1) |
where arg denotes an argininamide molecule and for which the concentration of the TAR•arg complex is given by Eq. 2,
 |
(2) |
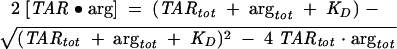
where TARtot and argtot are the total TAR and argininamide concentrations, respectively. The total fluorescence intensity F is then
 |
(3) |
where A and B are constants that give the unit fluorescence intensities for their respective species. The best fit for the case of argininamide binding to ΔTAR-ap24 is shown by the smooth line through the data, which yielded a KD of 1.01 mM and a value of 11.2 for the ratio B/A. Three separate measurements gave an average KD of 1.00 ± 0.01 mM and an average value for B/A of 10.5 ± 1.2. This KD is in good agreement with that previously estimated using an affinity column assay (Tao and Frankel 1992).
A fit of the data for titration of ΔTAR-ap23 with argininamide produced quite similar results (Fig. 2A, inset). Three separate experiments gave average values of 0.55 ± 0.02 for KD and 3.68 ± 0.08 for B/A. Clearly, argininamide binding to ΔTAR causes 2-AP to undergo a greater change in environment when substituted at position 24 rather than at position 23. In terms of absolute numbers, the unit fluorescence intensity of unliganded ΔTAR-ap23 was about three times that of ΔTAR-ap24, whereas the fluorescence intensities of their respective liganded species were almost the same. The factor of two differences in the two KD’s, which corresponds to a relatively small difference of ~0.4 kcal mole−1 in binding free energies, is perhaps due to different increases in stacking interactions that could result from substitution of a purine for a pyrimidine at these two positions. These differences in stacking interactions could, in turn, lead to slight differences in the extent to which the unliganded conformation of the bulge is stabilized and/or the liganded conformation destabilized.
Binding of an arginine-rich Tat Peptide to 2-AP-labeled ΔTAR
Results from a titration of ΔTAR-ap24 with an arginine-rich 24 amino acid fragment of the Tat protein are shown in Figure 2B. In this titration, initial addition of the Tat peptide causes an apparent ninefold increase in 2-AP fluorescence intensity that is followed by a much smaller decrease as higher Tat concentrations are attained. The direction of the initial fluorescence change indicates that ap24 becomes, on average, less stacked upon Tat peptide binding, which is again consistent with the exposed position of this base as observed in NMR studies of the complex (Aboulela et al. 1995; Long and Crothers 1999). The data for the binding reaction could be fit using a nonidentical two-independent sites model (Eq. 4):
 |
(4) |
where KD1 and KD2 are macroscopic-binding constants. The fluorescence intensity is then given by Eq. 5:
 |
(5) |
The best fit is shown by the smooth line through the data, which yielded a microscopic KD of 25.0 ± 2.8 nM for Tat binding to the high-affinity site, with an associated 14-fold increase in fluorescence intensity. Binding to the lower affinity site yielded an apparent microscopic KD of 300 ± 75 nM, and resulted in only a moderate decrease in fluorescence intensity. The observation of multiple binding events for Tat with ΔTAR is consistent with previous studies (Weeks et al. 1990; Weeks and Crothers 1992), and the observed KD’s fall within the range of those previously reported based on gel electrophoretic, filter, and fluorescence-binding assays performed under slightly different buffer, salt, and temperature conditions (Weeks et al. 1990; Weeks and Crothers 1992; Churcher et al. 1993; Arzumanov et al. 2000).
Titration of ΔTAR-ap23 with the Tat peptide gave results that were quite similar to those described above, except that only about a fourfold initial increase in fluorescence intensity was observed before the latter began to decrease with increasing ligand concentration (data not shown). As was seen in the titrations with argininamide, the fluorescence intensity of unliganded ΔTAR-ap23 was about three times that of unliganded ΔTAR-ap24, whereas the fluorescence intensities of the respective liganded species were about the same. This indicates that Tat binding causes the two different labeled positions to undergo changes in environment that are similar to those experienced upon argininamide binding, and confirms that with respect to induced changes in the bulge conformation of TAR, argininamide is a good mimic of Tat.
Binding of Neomycin to 2-AP-labeled ΔTAR
Figure 3A shows the results of a titration of ΔTAR-ap23 with the aminoglycoside antibiotic Neomycin over a range from 0 to 4 μM. As was the case for the Tat peptide, titration with Neomycin resulted in a biphasic isotherm that indicates the association of multiple ligand molecules. The smooth line through the data shows the fit of a nonidentical two-independent sites binding model (analogous to Eq. 4), which yielded microscopic KD’s of 240 nM and 3.6 μM for the high- and low-affinity sites, respectively. A simplified analysis of the initial (rising) portion of the binding isotherm (shown in the inset) using a single site model (Eq. 6) yielded a KD of ~130 nM for the high-affinity site, with an apparent 45% increase in fluorescence intensity.
FIGURE 3.

Fluorescence changes accompanying titration of 2-AP-labeled ΔTAR with Neomycin. (A) Titration of 100 nM ΔTAR-ap23, in which the relative fluorescence increase at 390 nm is plotted as a function of total Neomycin concentration. The best-fitting curve of a two-site binding model is shown (KD1 = 300 ± 75 nM, KD2 = 4 ± 1 μM). (Inset) Fit of a single-site binding model to the rising part of the isotherm which yields a KD of ~130 nM for the high-affinity site. (B) Relative fluorescence changes at 390 nm for the ΔTAR-ap24 construct as a function of total Neomycin concentration. The fit of a single-binding-site model (smooth line) gave an average KD of ~160 nM.
Figure 3B shows the results from a titration of ΔTAR-ap24 with Neomycin over a total ligand concentration range from 0 to 0.8 μM. There it can be seen that, in contrast to the response of ΔTAR-ap23, ΔTAR-ap24 fluorescence intensity decreases with increasing total ligand concentration over a similar titration range. The smooth line shows the fit of a single-site, two-state binding model
 |
(6) |
for which [TAR•neo] and the fluorescence intensity are given by expressions analogous to Eqs. 2 and 3. For the experiment shown, the fit gave a KD of ~160 nM and a liganded-to-unliganded fluorescence intensity ratio (B/A) of ~0.57. The results from five separate measurements gave average values of 160 ± 20 nM for KD and 0.60 ± 0.07 for B/A.
Further titration of ΔTAR-ap24 with Neomycin to a final concentration of ~40 μM yielded an additional decrease in fluorescence intensity beyond what was seen above (data not shown). This weaker and perhaps nonspecific association of the RNA with additional molecules of the antibiotic could be characterized by a dissociation constant of ~3.9 ± 0.2 μM and resulted in a final fluorescence intensity that was 44% ± 2% that of the unliganded species (averages of two measurements).
In summary, titrations of both ΔTAR-ap23 and ΔTAR-ap24 indicate that ΔTAR has at least two Neomycin-binding sites, with respective submicromolar and micromolar affinities. The results also indicate that the 23 and 24 positions in the bulge are affected by the initial binding event in opposite ways. The difference in fluorescence response between the two reporters is somewhat surprising, as a previous NMR structural analysis of the complex between TAR and Neomycin (Faber et al. 2000), although at relatively low resolution, indicated that the bases at positions 23 and 24 are both unstacked in the complex. Nonetheless, the binding of multiple molecules of this antibiotic to ΔTAR and the measured affinities are consistent with the results from other binding assays as reported in the literature (Mei et al. 1995; Wang et al. 1998; Sannes-Lowery et al. 1999), which indicates that this assay is quite sensitive to detecting multiple small molecule binding events.
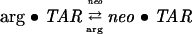
Competitive binding of argininamide and Neomycin to ΔTAR
Figure 4A shows the results from an experiment in which ΔTAR-ap24 was initially saturated with argininamide to a concentration of ~10 mM, and then titrated with Neomycin. The initial addition of argininamide caused about an 11-fold increase in sample fluorescence intensity, consistent with what was seen over the whole course of the titration in Figure 2A, whereas subsequent additions of Neomycin, over a range of from 0 to 18 μM, caused the fluorescence intensity to decrease to about twice that of free ΔTAR-ap24. The data were analyzed assuming the two ligands are competitive inhibitors:
FIGURE 4.

(A) Results of a competition assay in which ΔTAR-ap24 was preincubated with saturating (10 mM) argininamide and then titrated with Neomycin. The experimental conditions were the same as those described in Figure 2. As can be seen, the antibiotic was successful in displacing argininamide, with an apparent IC50 of ~4 μM. The smooth line shows the fit of a model (shown as an inset) that assumes inhibition is competitive and gave a KD for Neomycin of ~300 nM when the KD for argininamide was fixed at 1 mM. (B) Results of a competition assay in which ΔTAR-ap24 was preincubated with a substoichiometric amount (75 nM) of Tat peptide and then titrated with Neomycin. Experimental conditions were again the same as those described in Figure 2. As can be seen, the antibiotic was successful in displacing the Tat peptide. The smooth line, which shows the fit using a model (shown as an inset) that assumes inhibition is noncompetitive, yields a KD of 230 nM for the binding of Tat to the ΔTAR•Neomycin binary complex.
 |
(7) |
where the total fluorescence intensity is given by
 |
(8) |
To reduce the number of fitting parameters and their associated uncertainties, A in Eq. 8 was fixed from the initial ΔTAR fluorescence measurement (in the absence of ligands), the KD for ΔTAR-argininamide association was taken to be the average value of 1 mM reported above, and B was calculated (using A and a KD of 1 mM) from the fluorescence intensity following saturation with 10 mM argininamide. This left C and the KD for ΔTAR•Neomycin association to be determined by the analysis. The result of the fit is shown by the smooth line through the data and yielded a KD of ~300 nM for the binding of Neomycin to ΔTAR-ap24 and a value for C/A of 1.45. Three separate experiments gave average values of 300 ± 10 nM and 1.43 ± 0.03 for KD and the ratio C/A, respectively, when analyzed using this model. This value for the dissociation constant is in fairly good agreement with that measured for the high-affinity Neomycin site in the direct binding experiments.
The value for C/A, however, indicates that in the context of this model the ΔTAR-ap24•Neomycin complex is ~50% more fluorescent than the unliganded RNA. This is the opposite of what we observed above in the direct titration of ΔTAR-ap24 with Neomycin, and suggests that a simple model involving competitive inhibition is not adequate to describe the data. The fact that Neomycin is not a competitive inhibitor of argininamide might be inferred from the fact that the two molecules bind to TAR at different places (Wang et al. 1998). Instead of displacing argininamide, binding of the antibiotic presumably causes a conformational change in TAR that increases the koff of argininamide from a ΔTAR•argininamide•Neomycin ternary complex, as has been suggested from previous analysis of competitive binding experiments with Neomycin and Tat peptide (Wang et al. 1998). Because Neomycin and argininamide binding to ΔTAR-ap24 have opposite effects on the environment of the 2-AP probe, one might expect that a ΔTAR-ap24•Neomycin•argininamide ternary complex would exhibit a change in fluorescence intensity with respect to the unliganded RNA that is an average of the changes seen with the binding of the individual ligands. This would certainly be consistent with what was observed in these experiments, where the fluorescence intensity at high Neomycin concentrations was ~50% greater than that of the unliganded RNA and about three times that of the ΔTAR-ap24•Neomycin binary complex, but significantly less than that of the ΔTAR-ap24•arginina-mide complex. In any case, it is clear from the data that Neomycin acts to inhibit argininamide binding to ΔTAR, with an inhibition constant (IC50) of ~4 μM under these conditions.
A complimentary experiment was also carried out in which ΔTAR-ap24 was first incubated with 0.2 μM Neomycin and then titrated with argininamide (data not shown). At this initial antibiotic concentration, the sample should have contained almost equal concentrations of unliganded ΔTAR and ΔTAR with Neomycin bound to its high-affinity site. The small percentage of low-affinity, binary, and ternary complexes that would be present could presumably be safely ignored in the analysis. The initial addition of Neomycin caused about a 25% drop in fluorescence intensity, which is consistent with the previous results when considering this only half saturated the RNA. Subsequent additions of argininamide to a final total concentration of 7 μM caused the fluorescence intensity to increase by about a factor of eight. The increased amount of argininamide needed to saturate, as well as the attendant reduced fluorescence response are both consistent with Neomycin inhibition. The data were initially fit using a competitive model as described above (Eqs. 7 and 8), where A, C, and the KD for ΔTAR-ap24-argininamide association were fixed from direct and previous measurements. Under these constraints, the best fit gave values of ~180 nM as the KD for the binding of Neomycin and 10.4 for B/A. Both are in good agreement with the results of our direct measurements. Attempts to analyze the data using a noncompetitive model gave only a modest improvement in the fit and values for the fluorescence coefficient of the ternary complex and a KD for the binding of argininamide to the ΔTAR-ap24-Neomycin binary complex that had larger uncertainties.
Competitive binding of Tat peptide and Neomycin to ΔTAR
Figure 4B shows the results of a competitive binding experiment, similar to that performed with argininamide and Neomycin, which was carried out with Tat peptide and ΔTAR-ap24. In this case, 100 nM of ΔTAR-ap24 was pre-incubated with a slightly substoichiometric amount of Tat peptide (75 nM) and then titrated with Neomycin up to a total concentration of 1.2 μM. The initial addition of the peptide caused an apparent sixfold increase in sample fluorescence intensity (consistent with partial saturation), whereas subsequent additions of the antibiotic caused the fluorescence intensity to decrease to about twice that of the unliganded RNA. It is clear that Neomycin is serving to inhibit Tat binding, and the data also suggest that because the fluorescence intensity at Neomycin saturation is greater than that of the unliganded RNA, a ternary complex is being formed, as we argued above for the case of the Neomycin–argininamide competition.
The model that best fit the data and yielded the smooth line shown in Figure 4B was one that allowed for the formation of both low- and high-affinity ΔTAR•Neomycin binary and ternary complexes. Tat, however, was only allowed to form high-affinity binary complexes and ternary complexes with the high-affinity ΔTAR•Neomycin binary complex. Except for the KD of Tat binding to the high-affinity ΔTAR•Neomycin complex and the fluorescence coefficient of the resulting ternary complex, all other KD’s and coefficients were fixed on the basis of previous results. The analysis yielded a KD of ~230 nM for the binding of Tat to ΔTAR•Neomycin, with the resulting ternary complex being about twice as fluorescent as unliganded TAR, and indicating an averaging of the effects due to Tat or Neomycin binding singly. Repeat measurements gave consistent results, with an average KD of 240 ± 10 nM for the binding of Tat to the ΔTAR•Neomycin binary complex. On average, the Tat•ΔTAR•Neomycin ternary complex was ~1.8 times more fluorescent than unliganded ΔTAR.
Selectivity of Neomycin and argininamide binding to ΔTAR
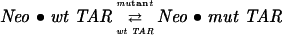
To demonstrate the use of the 2-AP assay in determining selectivity of ligand binding to TAR, we also performed experiments in which ΔTAR-ap23 competed for Neomycin binding with an unlabeled mutant ΔTAR that lacked the trinucleotide bulge (Fig. 5A). In carrying out these experiments, 100 nM of the labeled RNA was initially incubated with 400 nM of the unlabeled mutant ΔTAR. Neomycin was then titrated into the sample to a final concentration of ~600 nM (Fig. 5B). A titration of ΔTAR-ap23 with Neomycin in the absence of the bulgeless mutant (Fig. 5B) was also performed, so that both isotherms could be globally analyzed together to obtain a KD for the binding of Neomycin to the bulgeless-ΔTAR. The fact that the bulgeless mutant is acting as a competitive inhibitor of Neomycin binding to wild-type TAR can be seen from the way the presence of the mutant causes binding to the wild type to become more protracted. The data were analyzed with the following model:
FIGURE 5.

(A) Schematic of the bulgeless-ΔTAR sequence. (B) Competition assay in which 100 nM ΔTAR-ap23 was titrated with Neomycin either in the presence (•) or the absence (•) of 400 nM unlabeled bulgeless-ΔTAR. The two binding isotherms were globally analyzed with a competitive binding model (shown as an inset) and a KD for binding of Neomycin to the unlabeled mutant was obtained that was comparable to that of the labeled wild-type ΔTAR RNA. The resulting fits are shown by the smooth lines through the data points. (C) Simulation of the titration of 100 nM ΔTAR-ap23 with Neomycin (KD = 150 nM) in the absence (solid line) and presence of a competitor at a concentration of 400 nM. The long-dashed line shows the expected binding isotherm for a competitor with a KD of 150 nM for Neomycin, and the short-dashed line shows the expected binding isotherm for a competitor with a KD of 300 nM for Neomycin.
 |
(9) |
where wt TAR and mut TAR stand for labeled wild-type and unlabeled mutant ΔTAR, respectively, and Neo stands for a molecule of Neomycin. Because the mutant ΔTAR is silent, the total fluorescence intensity for either of the isotherms is given by
 |
(10) |
In the global analysis, both curves were fit simultaneously with the constraint that the same KD’s, and fluorescence coefficients be used to model each. Because the results from the ΔTAR-ap23 titration in the absence of the bulgeless mutant were sufficient to define the KD and fluorescence coefficients for binding to ΔTAR-ap23, the KD for Neomycin binding to the bulgeless mutant was the only remaining fitting parameter. The results are shown by the smooth lines through the data points in Figure 5B and gave a KD for the binding of Neomycin to bulgeless-ΔTAR that was comparable (KD ~130 nM) to that for binding to the labeled wild-type form. This is consistent with previous observations that localized the high-affinity binding site of Neomycin to the minor groove below the trinucleotide bulge of TAR (Wang et al. 1998; Faber et al. 2000), and that deletion of the bulge nucleotides has little effect on the binding of the antibiotic to this site. Moreover, it highlights the low-binding specificity of aminoglycosides, like Neomycin, for TAR.
A similar set of competition experiments was carried out to examine the relative affinity of argininamide for the bulgeless TAR mutant. In this case, 100 nM of ΔTAR-ap24 was preincubated with 400 nM of unlabeled bulgeless-ΔTAR, followed by titration with argininamide to a final ligand concentration of 5 mM. This yielded a binding isotherm (data not shown) that was essentially identical to that observed when titrations are carried out with ΔTAR-ap24 alone (Fig. 2A), indicating no appreciable binding of this Tat analog to the bulgeless mutant over the titration range. This is as might be expected, as previous studies (Weeks et al. 1990; Weeks and Crothers 1991, Weeks and Crothers 1992) have shown that Tat shows a high degree of selectivity for the bulge structural element of TAR.
To further illustrate the sensitivity of the 2-AP fluorescence competition assay, we have simulated the results for the case of a competitor RNA having one of two different KD values, which we show in Figure 5C. The solid line gives the expected result for Neomycin titrated into ΔTAR-ap23 (KD = 150 nM) in the absence of this competitor. The long-dashed curve shows the results when 400 nM of a competitor is also included that has a KD of 150 nM for Neomycin binding. Finally, the short-dashed curve gives the results when 400 nM of a competitor is again included that has a KD of 300 nM for Neomycin binding. It is clear from these simulations (Fig. 5C) that there should be no difficulty in distinguishing between competitors having KD’s that differ by even fractional amounts.
DISCUSSION
RNA and RNA–protein (RNP) complexes represent attractive targets for new drug therapies aimed at treating retro-viral and bacterial infection. For instance, modulation of RNA–protein interactions involved in retroviral gene expression could provide novel ways to combat viral infection or enhance the effectiveness of existing antiviral agents. In HIV-1, the interaction between TAR and the HIV-1 protein Tat is essential to replication and represents an as yet unexploited target for antiviral therapies. The development of specific RNA inhibitors requires general approaches for detecting and quantifying RNA–protein and RNA–small molecule interactions, which can be used in high-throughput screens (HTS) and for obtaining rapid structural information to guide rational drug design.
In this study, 2-AP fluorescence binding assays have been demonstrated as an approach to identifying and characterizing compounds that target TAR and inhibit its interaction with Tat. These assays allow detection of the direct binding of ligands at or near the bulge of TAR, as well as competitive binding between argininamide or an arginine-rich peptide derived from Tat and small molecule inhibitors like Neomycin. Carrying out binding experiments in parallel allows the detection of potential multiple binding modes for a given compound, some of which might not be observed if only a direct or competitive binding assay were used. These 2-AP assays are also sensitive to ligands that bind to TAR over a wide range of affinities, with KD’s ranging from nano- to millimolar, and allow binding experiments to be carried out in solution under any desired conditions. Moreover, as the target RNA is itself labeled with the fluorescent reporter, the 2-AP assays can be readily used to screen any compound or library of compounds without the requirement of further labeling.
In these assays, modulation of the TAR bulge conformation upon binding of argininamide/Tat, which results in the extrusion of bases C23 and U24 from the helical stack, is read out through the selective incorporation of 2-AP probes at these positions. As anticipated, the placement of 2-AP probes at positions 23 and 24 within the Tat binding site is nonperturbing, and increases in 2-AP fluorescence associated with argininamide or Tat peptide binding could be used to quantify these native binding interactions. Similarly, small molecule compounds like Neomycin that impart structural changes to the TAR bulge through either a direct or allosteric mechanism, could also be detected. In this respect, the 2-AP fluorescence assay is discriminating in that only ligands that induce conformational changes that mimic those associated with Tat binding to the bulge, or otherwise alter the probe environment in some unique way, are detected. In contrast, binding events that neither modulate the TAR bulge conformation nor directly interact with the 2-AP probes are silent. Thus, nonproductive binding events that are not associated with the Tat-binding site on TAR are screened out by the assay.
In summary, we have presented and validated a 2-AP fluorescence assay for the detection and quantitative characterization of small molecule binding at or near the bulge region of the HIV-1 TAR hairpin. The 2-AP method described allows both direct binding, as well as competitive binding with respect to the native ligands, argininamide/ Tat, to be detected. The 2-AP fluorescence assay possesses a number of advantages in terms of measuring small molecule binding to RNA, including the generally nonperturbing nature of the probe, the exquisite sensitivity of the probe to RNA conformation, and the need for labeling only the RNA target. By adapting these 2-AP fluorescence methods to a 96-well plate format, it should be possible to screen small molecule compound libraries and thoroughly assess their TAR-binding affinities, specificities, and inhibition of Tat. Lastly, because many RNA targets undergo ligand-induced changes in conformation, strategic incorporation of 2-AP labels represents a general approach for the development of sensitive fluorescence-based assays for detecting and quantifying these RNA interactions.
MATERIALS AND METHODS
Materials
L-argininamide dihydrochloride and Neomycin sulfate were obtained from Sigma-Aldrich, and used without further purification.
RNA and peptide synthesis
The 2-aminopurine-labeled ΔTAR RNA stem–loop (Fig. 1A), as well as the unlabeled mutant stem–loop form lacking the bulge (Fig. 5A), were synthesized in-house using standard solid-phase phosphoramidite chemistry. Following synthesis and deprotection, the RNAs were purified by use of preparative-scale denaturing polyacrylamide gel electrophoresis (PAGE), electroeluted from the excised gel bands, and desalted either by exhaustive dialysis against sterile, diethyl pyrocarbonate (DEPC)-treated ddH2O or by reverse-phase HPLC using a Waters C18 column. The RNAs were then lyophilized and resuspended in Buffer A (10 mM phosphate, 50 mM NaCl, 0.1 mM EDTA at pH 6.8) and stored at −20°C. RNA concentration was determined by measuring the absorbance at 260 nm using an extinction coefficient of 251.8 mM−1cm−1 for ΔTAR. The arginine-rich 24 amino-acid-residue fragment of the Tat peptide (RKKRRQRRRPPQGSQTHQVSL SKQ) was custom synthesized by Bio Synthesis, Inc., and subsequently purified by reverse-phase HPLC. Aliquots of the desired fraction from several different HPLC runs were then pooled, dried down by rotoevaporation, resuspended in Buffer A, and stored at 4°C. The stock peptide concentration was determined from the absorbance of the peptide bond at 205 nm, according to the method of Scopes (1974). Binding of the Tat peptide to ΔTAR-ap24 was verified using a gel mobility-shift assay (data not shown).
Steady-state fluorescence measurements of ligand binding to 2-AP labeled ΔTAR
ΔTAR RNA samples were freshly prepared prior to each experiment. The stock RNA solution was diluted to 2.5 μM in Buffer A and then snap-cooled by heating it for several minutes in a 90°C water bath and plunging into ice-water. After snap-cooling, the sample was diluted to 2.5 mL in a 1-cm path-length quartz cuvette with the appropriate buffer, so that the sample contained MgCl2 at a final concentration of 1 mM. Fluorescence measurements were made using a Spex FluoroMax-3 spectrofluorometer (JY Horiba) operating in photon counting mode. The sample cuvette was thermostated at 20°C using a circulating water bath. The excitation wavelength was 320 nm, whereas emission was observed at 390 nm. The excitation and emission bandwidths were both 5 nm. An average of 10 accumulations of 10 sec each was acquired for each data point with a standard deviation of typically <0.2%. It was determined that the exciting light was essentially unpolarized under these conditions, so that only a single polarizer, located on the emission side and oriented at 35° with respect to the vertical, was needed to ensure that there were no orientation effects, and that the emission being viewed was proportional to the total fluorescence intensity (i.e., had no dependence on emission anisotropy).
Typical results from an argininamide titration of ΔTAR-ap24 RNA (for which 2-AP has been substituted for U24 in the trinucleotide bulge) are shown in Figure 2A. There, as denoted by the filled circles, 2-AP’s fluorescence intensity measured at 390 nm has been plotted against total ligand concentration. The titration was carried out by successively adding 2- to 6-μL aliquots (depending on the point in the binding isotherm at which the addition was being made) of a 200-mM argininamide stock in Buffer A with 1 mM MgCl2, to the ΔTAR sample in the fluorescence cuvette. The initial ΔTAR concentration was 100 nM. After each addition and following hand mixing, the sample was allowed to incubate for 5 min to reach binding equilibrium before the fluorescence intensity was measured as described above. As can be seen from the graph, the fluorescence intensity of the unliganded sample is relatively weak [~16,000 counts per second (cps)]. Upon addition of the titrant, however, the fluorescence intensity rises steeply and finally plateaus at ~180,000 cps, yielding an apparent 11-fold increase in fluorescence intensity with saturation.
Analysis of the ΔTAR binding isotherms
Data were analyzed using the Scientist software program by MicroMath. Analysis of single-site binding data was carried out as described above for titration with argininamide. In the case of more complicated models, such as multiple-sites binding and competitive and noncompetitive inhibition, the fitting model was expressed in terms of the mass conservation equations, KD definitions, and the expression for the total fluorescence intensity. With the inclusion of constraints on the allowed concentrations of the free species, the program found the appropriate roots of the implicit expressions for the latter in the context of a nonlinear least-squares fit.
Because Tat protein binding to viral mRNA at the TAR is essential for HIV replication, acting as an amplifier of mRNA transcription, the development of inhibitors of this interaction could provide the basis for new drug therapies against HIV-1 infection (Sucheck and Wong 2000; Ptak 2002; Dinesh and Rana 2003; Tor 2003). To date, a few low molecular-weight compounds have been reported that block the Tat•TAR interaction in vitro with inhibition constants in the nano- to micromolar range (Mei et al. 1995, 1997, 1998; Hamy et al. 1997, 1998; Wang et al. 1998; Sannes-Lowery et al. 1999; Litovchick et al. 2001; Du et al. 2002; Lind et al. 2002; Blount and Tor 2003; Hwang et al. 2003; Davis et al. 2004; Murchie et al. 2004), some of which have also shown viral inhibition in cellular assays. Among these compounds are a number of amino acid and nucleotide analogs (Mestre et al. 1999; Arzumanov et al. 2000, 2001; Mayhood et al. 2000; Tamilarasu et al. 2000) and aminoglycoside antibiotics (Mei et al. 1995; Wang et al. 1998; Blount and Tor 2003), which have been shown to effectively compete with Tat for binding to TAR. Studies have also focused on modifying and conjugating small molecules to enhance their specificity for TAR through directed and combinatorial chemical approaches (Hamy et al. 1998; Gelus et al. 1999; Litovchick et al. 2001). Despite examples of small molecules that can block the Tat•TAR interaction in vitro with modest inhibition constants (Ki < 1 μM), as well as the clear potential of TAR as a therapeutic target, no compounds have yet advanced to the clinic. It is therefore of continued interest to search for and characterize new small molecules that bind with high affinity and selectivity to TAR and inhibit its interaction with Tat.
To this end, we have developed new fluorescence-based TAR-binding assays by selectively substituting the highly fluorescent nucleoside analog 2-aminopurine (2-AP) for either of two adjacent bulge bases (C23 or U24) in a 27-base fragment of the TAR hairpin (Fig. 1A), the so-called ΔTAR sequence (Weeks et al. 1990; Weeks and Crothers 1991, Weeks and Crothers 1992). On the basis of previous studies that identified base positions in TAR that are essential for high-affinity Tat peptide/ argininamide binding (Weeks et al. 1990; Weeks and Crothers 1991, Weeks and Crothers 1992) and structural investigations that indicated large conformational changes in the bulge of TAR upon interaction with argininamide/Tat peptide (Puglisi et al. 1992; Aboulela et al. 1995; Long and Crothers 1999), it was reasoned that substitution of 2-AP at these bulge positions would be nonperturbing and provide sensitive probes of ligand interactions with TAR. 2-AP fluorescence methods have been similarly used to characterize binding of small molecule inhibitors and Rev peptide to the HIV-1 rev responsive element (RRE; Lacourciere et al. 2000; DeJong et al. 2003), aminoglycoside binding to prokaryotic and eukaryotic ribosomal RNA sequences (Kaul et al. 2004), and inhibition of hammerhead ribozymes (Kirk et al. 2001). In addition, 2-AP fluorescence has been applied to characterize RNA conformational changes associated with peptide binding (Austin et al. 2003; Barrick and Roberts 2003), chaperone mediate RNA refolding (Rist and Marino 2002), and ribozyme cleavage (Harris et al. 2002; Jeong et al. 2003). Fluorescence changes observed for another base analog, benzo[g]quinazoline-2,4(1H,3H)-dione incorporated at a position in the TAR bulge have also been used as a sensitive measure of Tat peptide binding (Arzumanov et al. 2000). In general, the sensitivity of 2-AP’s quantum yield to its microenvironment allows binding to be detected through direct contact, as well as indirectly through conformational changes in the RNA that may accompany the interaction with a ligand (Rist and Marino 2001). It is demonstrated that for the 2-AP-labeled ΔTAR constructs used in this study, changes in the conformation of TAR that accompany argininamide, Tat, and Neomycin binding at or near the trinucleotide bulge yield changes in 2-AP fluorescence that provide sensitive signals for quantitatively measuring these interactions.
Acknowledgments
This work was supported by National Institutes of Health (NIH) grant GM59107 to J.P.M. We thank F. Song (CARB) for RNA oligonucleotide synthesis and J. Tzeng (CARB) and D.M. Brabazon (Loyola College of Maryland) for purifying RNA oligonucleotides and carrying out preliminary measurements. Certain commercial equipment, instruments, and materials are identified in this work in order to specify the experimental procedure. Such identification does not imply recommendation or endorsement by the National Institute of Standards and Technology (NIST), nor does it imply that the material or equipment so identified is necessarily the best available for the purpose.
The publication costs of this article were defrayed in part by payment of page charges. This article must therefore be hereby marked “advertisement” in accordance with 18 USC section 1734 solely to indicate this fact.
Article published online ahead of print. Article and publication date are at http://www.rnajournal.org/cgi/doi/10.1261/rna.7620304.
Footnotes
This corresponds to base G25 in the slightly shorter ΔTAR sequence of Weeks and Crothers (1991, Weeks and Crothers (1992) that was used in the present study. All other references to base position made herein are with respect to ΔTAR.
REFERENCES
- Aboulela, F., Karn, J., and Varani, G. 1995. The structure of the Human-Immunodeficiency-Virus Type-1 TAR RNA reveals principles of RNA recognition by Tat protein. J. Mol. Biol. 253: 313–332. [DOI] [PubMed] [Google Scholar]
- Arzumanov, A., Godde, F., Moreau, S., Toulme, J.J., Weeds, A., and Gait, M.J. 2000. Use of the fluorescent nucleoside analogue benzo[g]quinazoline 2′-O-methyl-beta-D-ribofuranoside to monitor the binding of the HIV-1 Tat protein or of antisense oligonucleotides to the TAR RNA stem-loop. Helv. Chim. Acta 83: 1424–1436. [Google Scholar]
- Arzumanov, A., Walsh, A.P., Liu, X.H., Rajwanshi, V.K., Wengel, J., and Gait, M.J. 2001. Oligonucleotide analogue interference with the HIV-1 Tat protein-TAR RNA interaction. Nucleosides Nucleotides & Nucleic Acids 20: 471–480. [DOI] [PubMed] [Google Scholar]
- Austin, R.J., Xia, T.B., Ren, J.S., Takahashi, T.T., and Roberts, R.W. 2003. Differential modes of recognition in N peptide-boxB complexes. Biochemistry 42: 14957–14967. [DOI] [PubMed] [Google Scholar]
- Barrick, J.E. and Roberts, R.W. 2003. Achieving specificity in selected and wild-type N peptide-RNA complexes: The importance of discrimination against noncognate RNA targets. Biochemistry 42: 12998–13007. [DOI] [PubMed] [Google Scholar]
- Blount, K.F. and Tor, Y. 2003. Using pyrene-labeled HIV-1 TAR to measure RNA-small molecule binding. Nucleic Acids Res. 31: 5490–5500. [DOI] [PMC free article] [PubMed] [Google Scholar]
- Calnan, B.J., Biancalana, S., Hudson, D., and Frankel, A.D. 1991a. Analysis of arginine-rich peptides from the HIV Tat Protein reveals unusual features of RNA protein recognition. Genes & Dev. 5: 201–210. [DOI] [PubMed] [Google Scholar]
- Calnan, B.J., Tidor, B., Biancalana, S., Hudson, D., and Frankel, A.D. 1991b. Arginine-mediated RNA recognition—the arginine fork. Science 252: 1167–1171. [DOI] [PubMed] [Google Scholar]
- Churcher, M.J., Lamont, C., Hamy, F., Dingwall, C., Green, S.M., Lowe, A.D., Butler, P.J.G., Gait, M.J., and Karn, J. 1993. High-affinity binding of TAR RNA by the Human-Immunodeficiency-Virus Type-1 Tat protein requires base-pairs in the RNA stem and amino acid residues flanking the basic region. J. Mol. Biol. 230: 90–110. [DOI] [PubMed] [Google Scholar]
- Davis, B., Afshar, M., Varani, G., Murchie, A.I.H., Karn, J., Lentzen, G., Drysdale, M., Bower, J., Potter, A.J., Starkey, I.D., et al. 2004. Rational design of inhibitors of HIV-1 TAR RNA through the stabilisation of electrostatic “hot spots”. J. Mol. Biol. 336: 343–356. [DOI] [PubMed] [Google Scholar]
- DeJong, E.S., Chang, C.-e., Gilson, M.K., and Marino, J.P. 2003. Proflavine acts as a Rev inhibitor by targeting the high-affinity Rev binding site of the Rev responsive element of HIV-1. Biochemistry 42: 8035–8046. [DOI] [PubMed] [Google Scholar]
- Dinesh, C.U. and Rana, T.M. 2003. Inhibitors of the Tat-TAR interactions. In Small molecule DNA and RNA binders (eds. M. Demeunynck et al.), pp. 58–87. Wiley-VCH, Darmstadt, Germany.
- Du, Z.H., Lind, K.E., and James, T.L. 2002. Structure of TAR RNA complexed with a Tat-TAR interaction nanomolar inhibitor that was identified by computational screening. Chem. Biol. 9: 707–712. [DOI] [PubMed] [Google Scholar]
- Faber, C., Sticht, H., Schweimer, K., and Rosch, P. 2000. Structural rearrangements of HIV-1 Tat-responsive RNA upon binding of neomycin B. J. Biol. Chem. 275: 20660–20666. [DOI] [PubMed] [Google Scholar]
- Gelus, N., Hamy, F., and Bailly, C. 1999. Molecular basis of HIV-1 TAR RNA specific recognition by an acridine tat-antagonist. Bioorg. Med. Chem. 7: 1075–1079. [DOI] [PubMed] [Google Scholar]
- Hamy, F., Felder, E.R., Heizmann, G., Lazdins, J., AboulEla, F., Varani, G., Karn, J., and Klimkait, T. 1997. An inhibitor of the Tat/TAR RNA interaction that effectively suppresses HIV-1 replication. Proc. Natl. Acad. Sci. 94: 3548–3553. [DOI] [PMC free article] [PubMed] [Google Scholar]
- Hamy, F., Brondani, V., Florsheimer, A., Stark, W., Blommers, M.J.J., and Klimkait, T. 1998. A new class of HIV-1 Tat antagonist acting through Tat-TAR inhibition. Biochemistry 37: 5086–5095. [DOI] [PubMed] [Google Scholar]
- Harrich, D., Ulich, C., and Gaynor, R.B. 1996. A critical role for the TAR element in promoting efficient human immunodeficiency virus type 1 reverse transcription. J. Virol. 70: 4017–4027. [DOI] [PMC free article] [PubMed] [Google Scholar]
- Harrich, D., Ulich, C., GarciaMartinez, L.F., and Gaynor, R.B. 1997. Tat is required for efficient HIV-1 reverse transcription. EMBO J. 16: 1224–1235. [DOI] [PMC free article] [PubMed] [Google Scholar]
- Harris, D.A., Rueda, D., and Walter, N.G. 2002. Local conformational changes in the catalytic core of the trans-acting hepatitis delta virus ribozyme accompany catalysis. Biochemistry 41: 12051–12061. [DOI] [PubMed] [Google Scholar]
- Hwang, S., Tamilarasu, N., Kibler, K., Cao, H., Ali, A., Ping, Y.H., Jeang, K.T., and Rana, T.M. 2003. Discovery of a small molecule Tat-trans-activation-responsive RNA antagonist that potently inhibits human immunodeficiency virus-1 replication. J. Biol. Chem. 278: 39092–39103. [DOI] [PubMed] [Google Scholar]
- Jeong, S., Sefcikova, J., Tinsley, R.A., Rueda, D., and Walter, N.G. 2003. Trans-acting hepatitis delta virus ribozyme: Catalytic core and global structure are dependent on the 5′ substrate sequence. Biochemistry 42: 7727–7740. [DOI] [PubMed] [Google Scholar]
- Kaul, M., Barbieri, C.M., and Pilch, D.S. 2004. Fluorescence-based approach for detecting and characterizing antibiotic-induced conformational changes in ribosomal RNA: Comparing aminoglycoside binding to prokaryotic and eukaryotic ribosomal RNA sequences. J. Am. Chem. Soc. 126: 3447–3453. [DOI] [PubMed] [Google Scholar]
- Kirk, S.R., Luedtke, N.W., and Tor, Y. 2001. 2-aminopurine as a real-time probe of enzymatic cleavage and inhibition of hammer-head ribozymes. Bioorg. Med. Chem. 9: 2295–2301. [DOI] [PubMed] [Google Scholar]
- Lacourciere, K.A., Stivers, J.T., and Marino, J.P. 2000. Mechanism of Neomycin and Rev peptide binding to the Rev responsive element of HIV-1 as determined by fluorescence and NMR spectroscopy. Biochemistry 39: 5630–5641. [DOI] [PubMed] [Google Scholar]
- Lind, K.E., Du, Z.H., Fujinaga, K., Peterlin, B.M., and James, T.L. 2002. Structure-based computational database screening, in vitro assay, and NMR assessment of compounds that target TAR RNA. Chem. Biol. 9: 185–193. [DOI] [PubMed] [Google Scholar]
- Litovchick, A., Lapidot, A., Eisenstein, M., Kalinkovich, A., and Borkow, G. 2001. Neomycin B-arginine conjugate, a novel HIV-1 Tat antagonist: Synthesis and anti-HIV activities. Biochemistry 40: 15612–15623. [DOI] [PubMed] [Google Scholar]
- Long, K.S. and Crothers, D.M. 1999. Characterization of the solution conformations of unbound and Tat peptide-bound forms of HIV-1 TAR RNA. Biochemistry 38: 10059–10069. [DOI] [PubMed] [Google Scholar]
- Mayhood, T., Kaushik, N., Pandey, P.K., Kashanchi, F., Deng, L.W., and Pandey, V.N. 2000. Inhibition of Tat-mediated transactivation of HIV-1 LTR transcription by polyamide nucleic acid targeted to TAR hairpin element. Biochemistry 39: 11532–11539. [DOI] [PubMed] [Google Scholar]
- Mei, H.Y., Galan, A.A., Halim, N.S., Mack, D.P., Moreland, D.W., Sanders, K.B., Truong, H.N., and Czarnik, A.W. 1995. Inhibition of an HIV-1 Tat-derived peptide binding to TAR RNA by aminoglycoside antibiotics. Bioorg. Med. Chem. Letts. 5: 2755–2760. [Google Scholar]
- Mei, H.Y., Mack, D.P., Galan, A.A., Halim, N.S., Heldsinger, A., Loo, J.A., Moreland, D.W., Sannes-Lowery, K.A., Sharmeen, L., Truong, H.N., et al. 1997. Discovery of selective, small-molecule inhibitors of RNA complexes 1. The Tat protein TAR RNA complexes required for HIV-1 transcription. Bioorg. Med. Chem. 5: 1173–1184. [DOI] [PubMed] [Google Scholar]
- Mei, H.Y., Cui, M., Heldsinger, A., Lemrow, S.M., Loo, J.A., Sannes-Lowery, K.A., Sharmeen, L., and Czarnik, A.W. 1998. Inhibitors of protein-RNA complexation that target the RNA: Specific recognition of human immunodeficiency virus type 1 TAR RNA by small organic molecules. Biochemistry 37: 14204–14212. [DOI] [PubMed] [Google Scholar]
- Mestre, B., Arzumanov, A., Singh, M., Boulme, F., Litvak, S., and Gait, M.J. 1999. Oligonucleotide inhibition of the interaction of HIV-1 Tat protein with the trans-activation responsive region (TAR) of HIV RNA. Biochim. Biophys. Acta 1445: 86–98. [DOI] [PubMed] [Google Scholar]
- Murchie, A.I H., Davis, B., Isel, C., Afshar, M., Drysdale, M.J., Bower, J., Potter, A.J., Starkey, I.D., Swarbrick, T.M., Mirza, S., et al. 2004. Structure-based drug design targeting an inactive RNA conformation: Exploiting the flexibility of HIV-1 TAR RNA. J. Mol. Biol. 336: 625–638. [DOI] [PubMed] [Google Scholar]
- Ptak, R.G. 2002. HIV-1 regulatory proteins: Targets for novel drug development. Expert Opin. Investigat. Drugs 11: 1099–1115. [DOI] [PubMed] [Google Scholar]
- Puglisi, J.D., Tan, R., Calnan, B.J., Frankel, A.D., and Williamson, J.R. 1992. Conformation of the TAR RNA-arginine complex by NMR spectroscopy. Science 257: 76–80. [DOI] [PubMed] [Google Scholar]
- Rist, M. and Marino, J.P. 2001. Fluorescent nucleotide base analogs as probes of nucleic acid structure, dynamics and interactions. Curr. Org. Chem. 6: 775–793. [Google Scholar]
- ———. 2002. Mechanism of nucleocapsid protein catalyzed structural isomerization of the dimerization initiation site of HIV-1. Biochemistry 41: 14762–14770. [DOI] [PubMed] [Google Scholar]
- Sannes-Lowery, K.A., Mei, H.Y., and Loo, J.A. 1999. Studying aminoglycoside antibiotic binding to HIV-1 TAR RNA by electro-spray ionization mass spectrometry. Int. J. Mass Spect. 193: 115–122. [Google Scholar]
- Scopes, R.K. 1974. Measurement of protein by spectrophotometry at 205 nm. Anal. Biochem. 59: 277–282. [DOI] [PubMed] [Google Scholar]
- Sucheck, S.J. and Wong, C.H. 2000. RNA as a target for small molecules. Curr. Opin. Chem. Biol. 4: 678–686. [DOI] [PubMed] [Google Scholar]
- Tamilarasu, N., Huq, I., and Rana, T.M. 2000. Design, synthesis, and biological activity of a cyclic peptide: An inhibitor of HIV-1 Tat-TAR interactions in human cells. Bioorg. Med. Chem. Letts. 10: 971–974. [DOI] [PubMed] [Google Scholar]
- Tao, J.S. and Frankel, A.D. 1992. Specific binding of arginine to TAR RNA. Proc. Natl. Acad. Sci. 89: 2723–2726. [DOI] [PMC free article] [PubMed] [Google Scholar]
- Tor, Y. 2003. Targeting RNA with small molecules. Chembiochem 4: 998–1007. [DOI] [PubMed] [Google Scholar]
- Wang, S., Huber, P.W., Cui, M., Czarnik, A.W., and Mei, H.Y. 1998. Binding of neomycin to the TAR element of HIV-1 RNA induces dissociation of Tat protein by an allosteric mechanism. Biochemistry 37: 5549–5557. [DOI] [PubMed] [Google Scholar]
- Weeks, K.M. and Crothers, D.M. 1991. RNA recognition by Tat-derived peptides: Interaction in the major groove? Cell 66: 577–588. [DOI] [PubMed] [Google Scholar]
- ———. 1992. RNA binding assays for Tat-derived peptides: Implications for specificity. Biochemistry 31: 10281–10287. [DOI] [PubMed] [Google Scholar]
- Weeks, K.M., Ampe, C., Schultz, S.C., Steitz, T.A., and Crothers, D.M. 1990. Fragments of the HIV-1 Tat protein specifically bind TAR RNA. Science 249: 1281–1285. [DOI] [PubMed] [Google Scholar]