Abstract
Based on the virtual bond representation for the nucleotide backbone, we develop a reduced conformational model for RNA. We use the experimentally measured atomic coordinates to model the helices and use the self-avoiding walks in a diamond lattice to model the loop conformations. The atomic coordinates of the helices and the lattice representation for the loops are matched at the loop–helix junction, where steric viability is accounted for. Unlike the previous simplified lattice-based models, the present virtual bond model can account for the atomic details of realistic three-dimensional RNA structures. Based on the model, we develop a statistical mechanical theory for RNA folding energy landscapes and folding thermodynamics. Tests against experiments show that the theory can give much more improved predictions for the native structures, the thermal denaturation curves, and the equilibrium folding/unfolding pathways than the previous models. The application of the model to the P5abc region of Tetrahymena group I ribozyme reveals the misfolded intermediates as well as the native-like intermediates in the equilibrium folding process. Moreover, based on the free energy landscape analysis for each and every loop mutation, the model predicts five lethal mutations that can completely alter the free energy landscape and the folding stability of the molecule.
Keywords: RNA folding, misfolded intermediates, stability, cooperativity
INTRODUCTION
Accurate prediction for RNA folding stabilities and conformational changes requires two key ingredients: the reliable energy parameters and a rigorous statistical mechanical model. These two ingredients are inter-related. To extract the energy parameters from thermal melting experiments requires a statistical mechanical model, and to use the statistical mechanical model to predict RNA thermodynamics requires energy parameters. The folding of simple oligomers is usually two-state. But the conformational changes for larger RNAs are often multistate. Therefore, we need a statistical mechanical model that can account for the statistics of the complete conformational ensemble, including all the possible intermediates.
Previous models for RNA secondary structure thermodynamics use simplified assumptions for the conformational entropies. For example, McCaskill’s algorithm (McCaskill 1990) uses sequence and temperature-independent loop entropy and assumes an unphysical linear dependence of loop entropy on the loop size for multibranched loops. More recently, a polymer principle statistical mechanical model (Chen and Dill 1995, 1998, 2000; Zhang and Chen 2001) for RNA was developed with an aim to have a more physical treatment for the chain entropy. The model accounts for the complete conformational ensemble and can treat the excluded volume interferences between different structural subunits. The model gives reasonably good predictions for RNA secondary structure folding thermodynamics. However, the model is based on simple two-dimensional square lattice or three-dimensional cubic lattice chain conformations. Although the lattice conformations can give useful estimations for the statistics of realistic conformations, they bear no direct correspondence to the realistic structures and are thus unable to represent any realistic structural details. In the present study, we go beyond the previous lattice models by developing an atomic RNA conformational model for realistic RNA folds.
Our model relies on the following two observations for RNA structures. First, because the C–O torsions in the nucleotide backbone tend to be in the trans (t) rotational isomeric state, both the P–O5–C5–C4 bonds and the C4–C3–O3–P bonds in a nucleotide backbone are approximately planar. This makes it possible to describe the nucleotide backbone conformations through two effective virtual bonds P–C4 and C4–P (Olson and Flory 1972; Olson 1975 Olson 1980). Second, RNA backbones and the virtual bonds are rotameric (Duarte and Pyle 1998; Duarte et al. 2003; Murray et al. 2003). Therefore, we can use rotational isomeric states (RIS) of the virtual bonds to describe the RNA backbone conformation. We use the experimentally measured virtual bond coordinates to model the helix. For the loop region, of which the virtual bonds are more flexible, we use self-avoiding random walks in a diamond lattice to model the conformations.
The virtual bond/diamond lattice reduced chain representation developed here allows us to model RNA folding thermodynamics based on the realistic structures with atomic details. Experimental tests show that the present model gives improved predictions for the equilibrium folding thermodynamics and the native structures than the previous models. As an application of the model, we compute the free energy landscapes for the P5abc domain of the Tetrahymena group I ribozyme. We find a native-like and a misfolded intermediate in the folding process. Moreover, by examining the landscapes for all the loop mutants, we identify five hot spots whose mutation would cause drastic changes in the free energy landscapes and the folding thermodynamics.
RNA FOLDING THERMODYNAMICS AND THE LOOP FREE ENERGY
At the center of the folding thermodynamics is the partition function. The partition function Q(x) is defined as the weighted sum over all the possible conformational states:
 |
(1) |
where ∑conf(x) is the sum over all the possible conformations described by the structural parameter x, E is the energy of the conformation, kB is the Boltzmann constant, and T is the temperature. For RNAs, x can be the sugar-phosphate backbone torsions and glycosidic torsional angles, or the number of base pairs, or the like. The partition function gives the free energy landscape F(x) = −kBT lnQ(x) as a function of the conformational degrees of freedom described by the structural parameter x. The free energy landscape directly relates the free energy and the conformational stabilities to the molecular conformations.
Because RNA secondary structures are predominantly stabilized by the nearest-neighbor interactions, we use base stacks instead of base pairs to define RNA secondary structures. To compute the partition function for a given nucleotide sequence, we first generate all the possible secondary structures defined by the base stacks. The structures are generated through two types of base stacks: the canonical base stacks and the mismatched base stacks. These two types of base stacks are the possible stable base stacks in an RNA secondary structure. Here a base stack is canonical if both base pairs of the stack are A-U, G-C, or G-U and mismatched if only one of the base pairs is A-U, G-C, or G-U. The partition function is given by the sum over all the possible structures:
 |
(2) |
Here ΔHconf and ΔSconf are the enthalpy and entropy of the structure.
In the partition function calculation, we generate conformations by enumerating all the possible arrangements of the canonical and mismatched base stacks. We disallow the formation of other noncanonical base stacks, which are unstable and are unlikely to form. According to the base stacks, an RNA secondary structure can be divided into base stacks and unstacked loops. Here an unstacked loop should be understood as a closed conformation that contains neither the canonical nor the mismatched base stack. Since other types of base stacks are disallowed, an unstacked structure is equivalent to a loop without any intra-loop base stacks. Because an unstacked loop contains no intra-loop canonical or mismatched base stack, it can be assumed to have zero enthalpy. As a result, ΔHconf comes from contributions of the stacked regions only:
 |
(3) |
Here ΔHstack is the enthalpy of a stack. On the other hand, both the unstacked and the stacked regions contribute to ΔSconf, so we have
 |
(4) |
Here ΔSstack and ΔSunstacked are the entropies of a stack and of an unstacked loop, respectively. From the above two equations, the unstacked loop contributes to the stability through the entropy ΔSunstacked.
The stacking parameters (ΔHstack, ΔSstack) can be obtained from Turner’s experimental data (Serra and Turner 1995). One might expect that the entropy ΔSunstacked of an unstacked loop can also be obtained from the experimentally measured loop entropy parameters. However, as explained in the following, ΔSunstacked cannot be obtained from Turner’s experimental data. Instead, it can only be calculated from a computational model. The experimentally measured loops are often implicitly defined as the closed chain conformations that do not contain (stable) canonical base stacks in their interior. In other words, depending on the loop sequence, an experimentally measured loop can contain mismatched intra-loop base stacks. In contrast, an unstacked loop does not contain any canonical or mismatched base stack. As a result, ΔSunstacked cannot be obtained from the experimentally measured loop entropies, and it can only be obtained through theoretical modeling. In this paper, we develop an RNA conformational model from which ΔSunstacked can be calculated.
As a special case of Equation 2, the partition function of a loop can be calculated as the sum over all the possible arrangements of the intra-loop mismatched base stacks for a given loop sequence. The intra-loop base stacking may cause stabilization/destabilization in the loop and thus can lead to the temperature and sequence dependence of the loop enthalpy and entropy. In fact, the temperature-dependent loop enthalpy and entropy can cause a nonzero heat capacity change of the loop formation, Cp = dHloop/dT. In contrast, the entropy ΔSunstacked of an unstacked loop is sequence and temperature independent.
A previous model (Chen and Dill 2000; Zhang and Chen 2001), which is based on unrealistic square and cubic lattice chain conformations, can also account for the mismatched base stacks. However, that model cannot treat realistic RNA conformations. Moreover, that model requires fitted scaling parameters to convert the lattice chain entropy into realistic chain entropy. The model developed in the present study is based on realistic RNA structures with atomic details and can thus directly give the chain entropies and free energies without using any fitting parameters.
MIXED VIRTUAL BOND/DIAMOND LATTICE CHAIN REPRESENTATION
Virtual bond representation of RNA conformation
For secondary structures, the stability is determined by the additive local interactions, thus only the local structural details (for the base stacks and loops) are important. For tertiary structures, however, because the local interactions are coupled to the nonlocal structures, the modeling of the global three-dimensional structure is essential for the study of tertiary folding. In this section, we develop a (reduced) three-dimensional RNA conformational model by using the virtual bonds. Although in this paper we focus on the secondary-structure RNA folding, the model developed here would play an even more important role in the study of the tertiary-structure folding, where a conformational model for the global fold is indispensable.
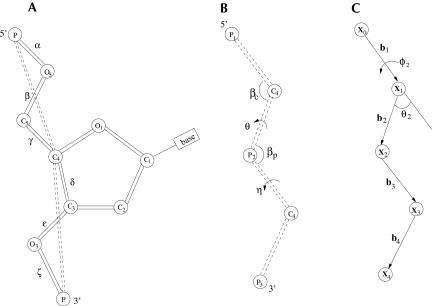
RNA nucleotide conformations can be described by six torsional angles (α, β, γ, δ, ɛ, and ζ in Fig. 1A). Since the torsions about the two C–O bonds (β and ɛ) are preferably in the trans (t) rotational isomeric state, the bonds P–O5, O5–C5, and C5–C4 and bonds C4–C3, C3–O3, and O3–P are planar in the respective planes. Therefore, for each set of the coplanar bonds, we can define an effective virtual bond (Olson 1975, 1980): P–C4 and C4–P (the dashed lines in Fig. 1A), respectively. With the virtual bonds, the original six-bond nucleotide is reduced to a two-bond unit.
FIGURE 1.
(A) The virtual bond scheme for nucleotide backbone (Olson 1980). (B) The bond angles (βC, βP) and the torsional angles (η, θ) for the virtual bonds. (C) A vector model used to determine the atomic coordinates from the torsional angles for the virtual bonds in B.
The virtual bonds have bond length of ~3.9 Å (Rich et al. 1961) and have bond angles of (βP and βc) (see Fig. 1B) in the range of 90°–120° as determined from the known RNA structures (Malathi and Yathindra 1981). In terms of the virtual bonds, a three-dimensional RNA conformation can be represented by the torsional angles (η and θ in Fig. 1B) of the virtual bonds. Systematic examination of the virtual bond torsions (η and θ) for the known RNA structures shows that the torsions are rotameric (Duarte and Pyle 1998; Duarte et al. 2003; Murray et al. 2003).
RNA conformational ensemble can be generated through the random walk of the virtual bonds in the three-dimensional space. Since the torsional angles are defined in the coordinate system local to the backbone conformation, the torsional angles are quite flexible and convenient to use as the chain is configured in the three-dimensional space. Moreover, the rotameric nature of the torsional angles makes it possible to generate the conformations by enumerating all the possible rotameric states of the torsional angles.
How do we obtain the Cartesian coordinates of the P and C4 atoms of the virtual bonds from the torsional angles? The method that we use here is similar to the matrix formalism developed in Olson (1975). The present theory is based on the torsional angles instead of the dihedral angles used in Olson (1975). For a given set of virtual bonds (bi in Fig. 1C), the coordinate xN for the N-th atom, which can be either C4or P, is determined by the sum of the N bond vectors of the virtual bonds:
 |
(5) |
where li is the bond length of the virtual bond bi and b̂i is the unit vector of bi. Assuming that the bond bi is related to the preceding bond bi–1 through a bond angle θi and a torsional angle ψi, we have b̂i = T(θi, ψi) · b̂i–1, which leads to
 |
(6) |
where the matrix T is defined as
 |
For example, the coordinate of the P2 atom in Figure 1B (x2 in Fig. 1C) can be computed from the following equation:
 |
where l1 and l2 , both equal to 3.9 Å, are the virtual bond lengths for P1 –C 4 and C4–P2, respectively, and η and βP are the torsional angle and the bond angle between bonds P1–C4 and C 4 –P 2.
Helix
Based on the systematic analysis for known RNA helices, Duarte and coworkers (Duarte and Pyle 1998; Duarte et al. 2003) found that the virtual bond torsion angles (η , θ) in the helix are close to 170°, 210°. Moreover, we obtain the bond angles (βP and βc) of the virtual bonds in the rigid double-stranded helix regions from the NDB database in http://ndbserver.rutgers.edu/. Specifically, from the A-RNA helix crystal structure measured by Biswas et al. (1998), we find that (βP , βc) = (105° ± 5 °, 95 ° ± 5 °). With the torsional angles (η, θ) and the bond angles (βP, βc), we can generate the coordinates for each strand of the helix. Since such generated coordinates for a helical strand are defined in the coordinate system local to the strand conformation itself, we need to perform a transformation in order to obtain the coordinates for both strands in a consistent coordinate system.
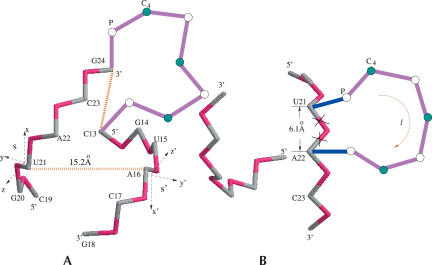
To generate the atomic coordinates for an RNA helix, we first determine the atomic coordinates for one of the strands s by using Equation 5 with the torsional angles equal to 170° and 210° for the respective virtual bonds. We note that the two pairing strands s and s′ would have identical atomic coordinates in their respective coordinate systems (x, y, z) and (x′, y′, z′); see Figure 2A. Here the x (x′) axis is parallel to the direction of the virtual bond, and the y (y′) axis is located in the plane defined by the two nearest-neighbor virtual bonds. The direction of the y (y′) axis is chosen to make an acute angle with the preceding bond vector. To obtain the atomic coordinates of both the s and the s′ strands in the same (x, y, z) coordinate system, we compute the atomic coordinates for strand s′ from the coordinates of strand s through s → s′ translational and rotational transformations. The s → s′ transformations can be obtained from a model system consisting of three (sequential) atoms P–C4–P on each strand: for example, the P and C4atoms of U21 and the P atom of A22 in strand s and the P and C4 atoms of A16 and the P atom of A17 in strand s′ in Figure 2A. We found that the rotational transformation between the two coordinates systems is given by
FIGURE 2.
(A) The coordinate system for a base pair (U21-A16) in the helix. s and s′ are the pairing strands. The gray and red colors denote the C4 and the P atom in the helix, respectively. The magenta color denotes the loop region. (B) Helix–bulge loop junction. The deleted bonds (×) show the fixed configuration of the virtual bonds in the A-form helix without the bulge loop. These bonds become flexible in the bulge loop conformation (see the blue bonds). The blue and magenta colors denote the bonds in the bulge loop. The P and C4 coordinates in the helix are from the crystal structure of r(CGUAC)dG sequences (Biswas et al. 1998).
 |
With the transformation matrix, the coordinate of an atom (e.g., P of C17 in Fig. 2A) in s′ in the (x, y, z) coordinate system is given by col(xs′, ys′, zs′) = R · col (x′s′, y′s′, z′s′) + d, where (x′s′, y′s′, z′s′) is the coordinate of the atom in the (x′, y′, z′) coordinate system and d is the displacement between the two strands.
Loop
For loops, the virtual bonds P–C4 and C4–P are less restricted than in helices. We use the diamond lattice to model the loop conformations by configuring the P and C4 atoms of the virtual bonds on the diamond lattice sites. The bond length of the diamond lattice is equal to the length of the virtual bonds, which is 3.9 Å. We use the diamond lattice because the torsional angles in the diamond lattice are the same as the usual gauche+ (g+), trans (t), and gauche− (g−) rotational isomeric states (Flory 1969; Mattice and Suter 1994; Rapold and Mattice 1995) for polymers. Therefore the diamond lattice can provide a coarse-grained description for the realistic loop conformations. In addition, the bond angle 109.5° in the diamond lattice lies well in the bond angle range 90°–120° of the virtual bonds in the experimentally measured RNA structures. With the diamond lattice model, we can generate the ensemble of loop conformations through exhaustive self-avoiding random walks of the virtual bonds in the diamond lattice.
Loop–helix connection
How do we connect a loop conformation in the diamond lattice to an off-lattice helix structure? We map the atoms in the helix onto the nearest diamond lattice site. Through such an off-lattice to diamond lattice transformation, we can model the helix and loop conformations in a consistent diamond lattice framework. Such transformation would cause small structural distortion for the helix. We found that for an A-form RNA helix, the use of the diamond lattice would cause a root-mean-square (RMS) deviation of ~2.2 Å.
We note that the present virtual bond/diamond lattice model is fundamentally different from the previous simple square and cubic lattice models. In the previous lattice models, the lattice sites and lattice bonds do not bear any physical correspondence to the realistic RNA structures. In contrast, in the present model, each lattice site is the coarse-grained approximation for the coordinate of the C4 or the P atom, and each lattice bond corresponds to a realistic nucleotide virtual bond. Thus the model enables modeling for the realistic RNA conformations with atomic details.
Loop entropies
Hairpin, internal, and bulge loop entropy and experimental comparisons
A viable loop conformation must be compatible with the connected helix structure (including the volume exclusion effect). To account for the viability of the loop–helix connection, we require the loop and the helix conformation to be compatible with the configuration of the base pair that closes the loop. For example, for the hairpin loop in Figure 2A, the closing base pair is C(13)–G(24). When enumerating the loop conformations, we assume that the configuration of the C13–G24 base pair, which is defined through the configuration of the double bonds P(G24)–C4(G24)–P(25) and P(C13)–C4(C13)–P(14), is fixed to the conformation in a helix.
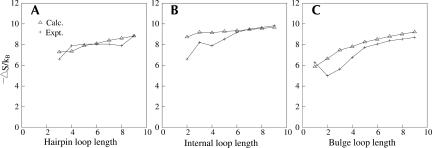
Through exhaustive enumeration of viable loop conformations, we compute the conformational count Ωloop for the loop and Ωcoil for the coil. From Ωloop and Ωcoil, we can obtain the loop entropy as ΔSloop = kB ln(Ωloop/Ωcoil). Figure 3 shows the comparison between the calculated and experimentally measured loop entropies (Serra and Turner 1995; Serra et al. 1997) for different loop sizes.
FIGURE 3.
The comparison between the experimentally measured loop entropies (+) and the calculated ones (Δ) for (A) hairpin loops, (B) internal loops, and (C) bulge loops. The experimental results for internal and bulge loops are from Serra and Turner (1995) in 1 M NaCl solution. For hairpin loops with loop length >3, we use the parameters in Serra et al. (1997).
The theory–experiment comparisons are not perfect. One of the reasons for the deviation of the theory from the experiment is because the experimentally measured loop entropy can be sequence dependent because of the possible mismatched intra-loop base stacks, while the stabilizing energies from the intra-loop base stacks are completely ignored in the enumeration for the loop conformations. Therefore we expect that the enumerated ΔSloop is closer to the unstacked loop entropy than to the experimentally measured loop entropy. In fact, the experimental loop entropy parameters are often derived from the average of many sequences (Serra et al. 1997). Nevertheless, the calculated ΔSloop values are quite close to the experimentally measured loop entropies, especially for larger loops.
For an internal loop, there exist two helix–loop junctions. To compute the conformational entropy, we fix the configuration for a pair of the P–C4–P atoms in a junction and consider all the possible configurations for the other junction. Specifically, we use the 12 symmetry groups in a diamond lattice to generate the configurations of the pairing P–C4–P atoms in the second junction. From Figure 3B, we find that our calculation underestimates the conformational count (and thus overestimates |ΔSloop| for loops <6 nt. This may be caused by the assumed fixed configuration of the closing base pairs of the loop, because there may exist other loop–helix connection modes not considered in the model.
For a bulge loop, which is connected to a strand of a helix, we assume that the helix is not distorted by the bulge. Upon the formation of the bulge loop, the two rigid virtual bonds (see the bonds marked with × in Fig. 2B between the C4 atoms of U21 and A22) in the original helix are now replaced by the flexible bonds in the bulge loop (see the two C4–P bonds in blue color in Fig. 2B). As shown in Figure 3, the predicted bulge loop entropy agrees with the experimental result for loops >4 nt. For smaller bulge loops, the assumption about the unperturbed rigid helix structure can lead to an overestimation for the entropy. In fact, recent experimental NMR measurement shows that the C4–C4 distance can be ~9 Å for the closing bases (e.g., U21 and A22 in Fig. 2B; Deng et al. 2001).
For loops with >9 nt, exact computer enumeration for all the possible self-avoiding loop conformations is impossible. We obtain the entropies for larger loops through extrapolation from smaller loops and find ΔSloop = A ln(l) + B/l + C. Here l is the loop length, and (A, B, C) = (1.09, −5.08, 7.00) for the hairpin loop, (1.54, 5.36, 5.70) for the internal loop, and (1.39, −2.37, 6.41) for the bulge loop, respectively.
Conformational entropy for loops with base triple
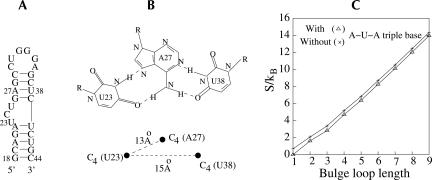
The present model enables treatment for the tertiary folds. As an example, we compute the entropy of a bulge loop that forms a U-A-U base triple in Tar RNA after binding with arginine or Tat peptide (Puglisi et al. 1992, 1993; Tao et al. 1997; Long and Crothers 1999). In Figure 4A, we show the secondary structure of a Tar RNA. NMR measurement indicates that the U23, A27, and U38 form a base triple (Long and Crothers 1999). We are interested in the entropy change upon the formation of the triple base pair. We obtain the atomic coordinates for the C4 atoms for U23, A27, and U38 from the NDB database (Deng et al. 2001) and fix the atoms to the respective nearest sites in the diamond lattice; see Figure 4B. Enumeration of the self-avoiding random walk gives the entropy shown in Figure 4C. Our result shows that the formation of the base triple would cause an entropy decrease of ~0.6 kcal/mol K−1, regardless of the loop size.
FIGURE 4.
(A) The secondary structure of Tar RNA. (B) The configuration for a U-A-U triple base. (C) The entropic difference (S/kB) for bulge loops with and without the U-A-U triple base.
STATISTICAL THERMODYNAMICS OF RNA SECONDARY STRUCTURE
Prediction of the lowest free energy structure
Based on the virtual bond RNA conformational representation, we develop a statistical mechanical (partition function) model for RNA folding thermodynamics; see the Appendix for details. Furthermore, based on the recursive relations for the partition functions (Eqs. 8–11), we develop a structure prediction method similar to Zuker’s mfold algorithm. The algorithm first finds the structure that gives the largest partition function (= lowest free energy) for the 7-nt segment of the last seven nucleotides in the 3′-end of the chain, then for the segment of the last eight nucleotides, then the last nine nucleotides, and so on until the final segment is the entire sequence. The starting 7-nt segment corresponds to the (minimum) 3-nt hairpin loop plus the four nucleotides in the closing base stack. We find the optimal structures, which have the maximum partition functions, through the recursive relations as in Equations 8–11, where the partition functions and the structures are now replaced by the optimal ones. In each recursive step, the optimal partition function and structure of each type (five types: the closed conformations and the four types of open conformations) are stored and used in the next step. In this way, we can efficiently find the optimal structure for each type.
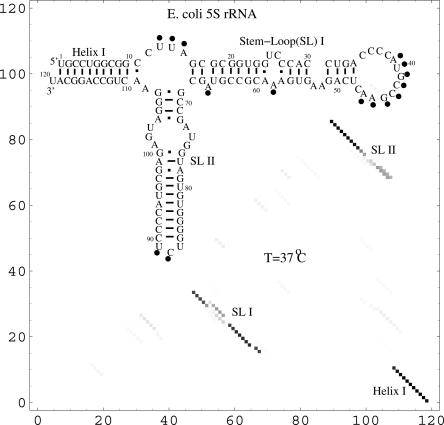
We find that in general, the present model can give quite accurate predictions for RNA secondary structures. As an example, we apply the model to predict the stable structure for Escherichia coli 5S rRNA at 37 °C. In Figure 5, we show the lowest free energy structure with the enzymatic cleavage constraints (Speek and Lind 1982). The predicted structure agrees exactly with the experimentally measured structure. As a comparison, another structure prediction model (Mathews et al. 1999) predicts 86.8% of the native base pairs.
FIGURE 5.
The density plot for the base-pairing probability and the predicted structure for E. coli 5S rRNA. Circles indicate single-stranded nucleotides as indicated by enzymatic cleavage (Speek and Lind 1982). The row and column indexes in the density plot are the nucleotides along the sequence.
RNA secondary structure folding thermodynamics
From the partition function Q(T), we can compute the heat capacity C(T) melting curves:
 |
In addition, from the conditional partition function Q(i, j, T) for the ensemble of conformations with base pair (i, j), we can compute the probability Pij(T) for the formation of the (i, j) pair:
 |
From the distribution of the base-pairing probability, we can obtain the stable structures for a given temperature T. We find that the structures (e.g., the E. coli 5S rRNA in Fig. 5) obtained from the base-pairing probability agree with the lowest free energy structures.
From the free energy landscape, we can predict the thermal stability and the equilibrium folding/unfolding pathways for a given nucleotide sequence. To calculate the free energy landscape defined in Equation 1, we first choose a proper structural parameter, x. We call the base pairs that exist in the native structure as native base pairs and denote all the other base pairs as non-native base pairs. We choose x = (n, nn) (the number of native base pairs, the number of non-native base pairs). From the conditional partition function Q(n, nn) for all the conformations that have n native base pairs and nn non-native base pairs, we can compute the free energy landscape F(n, nn) = −kBT lnQ(n, nn). The minima of the landscape correspond to the stable well-populated states. From the change of the free energy landscape, we can identify the structural transitions in the equilibrium folding.
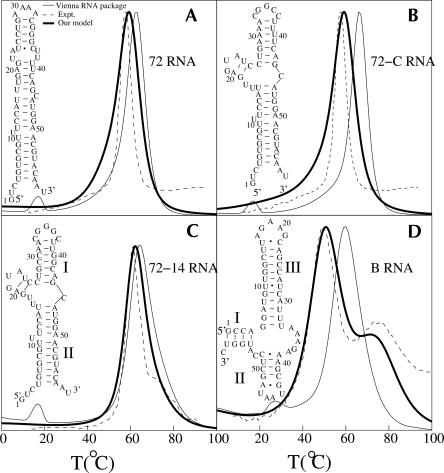
As an example, we investigate the folding thermodynamics for four short RNA sequences: 72 RNA and its two mutants 72-C RNA and 72-14 RNA (Gluick and Draper 1994), and B RNA (Laing and Draper 1994); see Figure 6. The heat capacity melting curves of these molecules have been experimentally measured (Gluick and Draper 1994; Laing and Draper 1994) in the 100 mM KCl solution condition (except for B-RNA, which has 0.1 mM added MgCl2). Since the stacking enthalpy and entropy parameters used in our model are for the 1 M NaCl salt condition, our predicted melting temperature can be higher than in 100 mM KCl. The melting temperature in 1 M KCl is about ΔTm = 16°C higher than in 100 mM KCl for 72 RNA (Gluick and Draper 1994). Assuming the same ΔTm between 1 M Na+ and 100 mM K+ for the two mutants 72-C RNA and 72-14 RNA, which have a similar size and shape to 72 RNA, we uniformly shift the calculated melting curves by 16°C to account for the ion effect.
FIGURE 6.
The predicted native structure and the theory–experiment comparisons for the heat capacity melting curves for RNA secondary structures: (A) 72 RNA, (B) 72-C RNA, (C) 72-14 RNA, and (D) B RNA. The experimental melting curves (A–C) are from Gluick and Draper (1994) and (D) from Laing and Draper (1994).
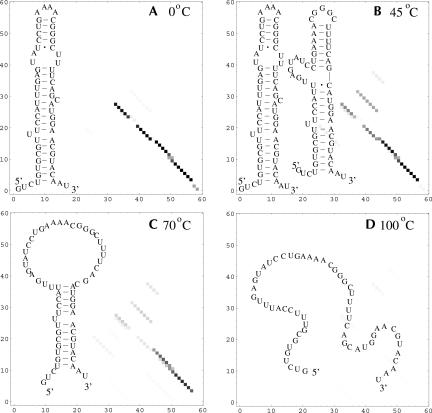
The 72-C RNA is predicted to undergo a sequential unfolding through unzipping from the tail, while the 72 RNA is predicted to unfold through the formation of a misfolded state. In Figure 7, we show the equilibrium folding pathway for 72 RNA structures. The structures are predicted from the base-pairing probability for different temperatures. At T = 45°C, we find two equal free energy minima on the landscape. Our base-pairing probability calculation shows that the two minima correspond to the low temperature (0°C) native structure and a newly formed misfolded structure. The main transition shown in the melting curve corresponds to the disruption of the macrostate consisting of the (coexisting) native and the misfolded state.
FIGURE 7.
The density plots for the base-pairing probabilities and the stable structures for the wild-type 72 RNA at different temperatures. An intermediate state appears at 45°C. The row and column indexes in the density plots denote the nucleotides along the sequence.
The UV melting profile of 72-14 RNA is quite different from that of 72 RNA and of 72-C RNA. The experimental UV curve clearly shows a second transition around 70°C after the main melting transition. In the predicted heat capacity curve, the second transition, shown as a small change in the curvature of the melting curve, is much less pronounced. The difference between the predicted curve and the experimental curve may be caused by the difference between the heat capacity (theory) and the UV absorbance (experiment). In addition, the experiment shows that an increase in the ionic strength weakens the second transition (Gluick and Draper 1994). Therefore, the difference in ion conditions (1 M in theory vs. 100 mM in experiment) may also contribute to the theory–experiment difference. The base-pairing probability at different temperatures indicates two distinctive structural change at temperatures around 60°C and 70°C for the unfolding of stem II and stem I, respectively (see Fig. 8). Our results are consistent with the experimental findings (Gluick and Draper 1994).
FIGURE 8.
The density plot for the base-pairing probabilities and the stable structures for 72-14 RNA at different temperatures. The row and column indexes in the density plots are the nucleotides along the sequence.
Both our theory and the experiment give two peaks in the melting curve for B RNA (Laing and Draper 1994). Our base-pairing probability analysis shows that the low-temperature transition corresponds to the melting of helices I and II and the high-temperature transition corresponds to the unfolding of helix III after helices I and II are melted.
Our present theory gives improved predictions for the melting curves compared to the previous simple lattice-based models and McCaskill’s algorithm-based Vienna software package. For example, the present theory predicts higher cooperativity (sharper transitions) for the melting than the previous two-dimensional lattice models, which overestimates the breadth of melting curves (Chen and Dill 2000). The improved predictions may be attributed to several factors that are considered in the present model: (1) All the possible mismatched base stacks are accounted for in the partition function calculation. (2) A realistic conformational model with atomic details is used. (3) Base pairs in a single nucleotide bulge loop are assumed to be stacked if the previous and the following stacking base pairs are either wobble (G-U) or Watson-Crick (G-C or A-U). A similar assumption has been used in the previous study for RNA structural prediction (Jaeger et al. 1989). (4) Since the GNRA (N = A, C, G, or U and R = A or G) tetraloop shows a distinctive excess stability (Heus and Pardi 1991; Antao and Tinoco 1992; Correll and Swinger 2003), we assign an additional stabilizing enthalpy of −2.5 kcal/mol to the GNRA tetraloop (Mathews et al. 1999). (5) The single mismatch energy parameters (Kierzek et al. 1999) are used.
THERMAL STABILITY AND COOPERATIVITY FOR THE P5ABC REGION OF TETRAHYMENA GROUP I RIBOZYME
The P5abc domain plays a key role in the activity of the Tetrahymena ribozyme tertiary folding (Joyce et al. 1989; van der Horst et al. 1991). The structural details of the truncated P5abc subdomain (tP5abc) both with and without Mg2+ have been fully investigated by NMR experiments (Thirumalai 1998; Wu and Tinoco 1998; Zheng et al. 2001), which shows the tertiary interactions between the unpaired bases of the secondary structure. Furthermore, nondenaturing gel electrophoresis and NMR spectroscopy show that single point mutations can disrupt the tertiary interaction of the tP5abc subdomain (Silverman et al. 1999), a truncated P5abc subdomain. In this section, we apply the model to investigate the stability and the equilibrium folding pathway for the secondary structure of the P5abc domain of the Tetrahymena group I ribozyme. We also perform exhaustive mutations for the three loop regions of P5abc and investigate how the mutations affect the thermal stability and folding cooperativity. Such information may be useful for the investigation of the Tetrahymena ribozyme.
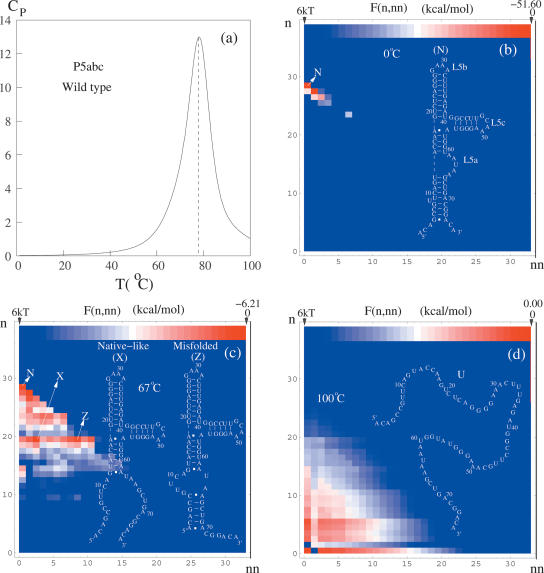
The heat capacity melting curve for P5abc (see Fig. 9a) shows a main single peak at Tm ≈ 80°C and a minor transition around 67°C. To examine the structural changes in the melting process, we compute the free energy landscape F(n, nn, T) for different temperatures; see Figure 9.
FIGURE 9.
(a) The predicted heat capacity melting curve in 1 M NaCl for the P5abc domain of the Tetrahymena group I ribozyme. (b–d) The density plots for the free energy landscapes F(n, nn) and the stable structures at different temperatures for P5abc. F(n, nn) is the free energy for conformations with n native base pairs and nn non-native base pairs, where the native state is the structure shown in b.
For T = 0°C, as shown in Figure 9b, the free energy landscape has a single minimum N, which is the native structure. Both our base-pairing probability analysis and the structural prediction algorithm predict the same native structure, and the predicted structure is in good agreement with the NMR experiment (Wu and Tinoco 1998; Zheng et al. 2001). We label the three loops in the native structure as L5a, L5b, and L5c, respectively. The native structure defines the native base pairs.
At T = 67°C, we find three free energy minima N, X, and Z on the free energy landscape; see Figure 9c. X is a native-like state and is formed through partial unzipping of N from the tail, while Z is a misfolded state and is formed through rezipping of the unfolded tail parts in X. The minor transition at 67°C shown in the melting curve corresponds to the structural change from N to X and Z. The emergence of the multiple minima on the landscape (and the corresponding native-like and misfolded intermediates) gives rise to noncooperative (i.e., non-two-state) RNA structural transitions. The rugged landscape and the structural metastability are supported by extensive experimental studies (Zarrinkar and Williamson 1994; Li and Turner 1997; Pan et al. 1999).
At T = 100°C, the free energy landscape has a single global minimum corresponding to the fully unfolded state U. The main transition at 80°C corresponds to the complete unfolding of the molecule.
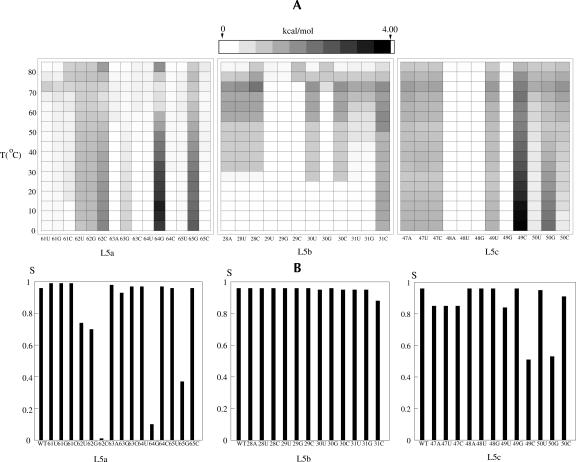
To identify the hotspots that are critical to the free energy landscape, we perform exhaustive mutations for each and every nucleotide in the loop regions and examine the free energy landscape for each mutation. To quantify the free energy landscape change, we define parameter ΔF as a measure for the RMS change of the landscape between the mutants and the wild-type sequence:
 |
where n and nn are the number of the native and of the non-native base pairs defined according to the wild-type sequence native structure, respectively. ∑n∑nn is the sum over all the (relatively stable) states on the landscape of which F(n, nn) is within 3kBT above the global minimum on the landscape. Ns is the number of such low free energy points on the landscape. F*(n, nn) is the free energy of the wild-type sequence. Larger ΔF means a greater change in the free energy landscape due to the mutation. By definition, ΔF is zero for wild-type sequence. In the calculation for ΔF, F*(n, nn) and F(n, nn) are evaluated as the free energies relative to the global minima on the respective landscapes. Such calculated ΔF would be able to provide a quantitative measure for the landscape shapes. For example, ΔF = 0 if the mutation causes only a uniform shift of the free energy landscape without altering the shape. Mutations that give large ΔF are identified as lethal mutations that would likely cause large changes in the native structure and the folding thermodynamics. Figure 10A shows the results of ΔF for all the possible mutations. From the change of the energy landscape, we find the following lethal mutations in the loops: A62C, A64G, A65G in loop L5a and A49C, A50G in loop L5c.
FIGURE 10.
(A) The density plot for the change in the free energy landscape ΔF at different temperatures for different mutations in loops L5a, L5b, and L5c, respectively. The top lines show the color scale. (B) The variations of thermal stabilities at T = 0° C for the wild-type sequence and different mutations in loops L5a, L5b, and L5c, respectively. Loop 5b contains no hotspots of which the mutations can cause drastic changes in the native structure and the stability.
Within a valley on the landscape, the conformations differ usually only by one or two base pairs. For example, in the macrostate of native minimum N, A70 can either base-pair with U8 or with U9, and both conformations reside in the same valley of the native minimum N; see Figure 9b. Therefore, we treat these conformations in the same valley as a macrostate. Specifically, in each valley, we define a macrostate for all the conformations that deviate from the local minimum structure by less than 2 in n or nn. By using the macrostates, we neglect the small local structural changes and focus only on the large structural changes. Such large structural changes are often more important for RNA functions than small local fluctuations.
To investigate the mutational effect on the stability, we define the stability of the native state:
 |
where the sum for i is for all the conformations in the native valley. In Figure 10B, we show the results for S at T = 0°C for the wild type and all the mutations. Consistent with the energy landscape analysis, we find five lethal mutations that cause significant changes in native stability: A62C, A64G, A65G, A49C, and A50G. These mutations can destabilize the native state N while stabilizing an alternative structure. For example, the A62C mutation can stabilize the misfolded state Z and destabilize state N. These predicted hotspots can be directly tested by experiments.
To investigate the folding thermodynamic cooperativity, we compute the van’t Hoff enthalpy
 |
from the heat capacity C(Tm) at the melting temperature Tm and the calorimetric enthalpy ΔHcal = H(∞) − H(0) of the entire transition (Chan et al. 2004). We quantify the cooperativity using the parameter k = ΔHvH/ΔHcal. Larger k means higher cooperativity. Here the enthalpy H(T) can be computed from the partition function as H(T) = kBT2d lnQ(T)/dT. We find that for both the wild-type P5abc sequence and the loop mutations, the cooperativity is between 0.4 and 0.6 (data not shown). Compared with the protein folding, which usually involves highly cooperative transitions with k close to 1, RNA folding is much less cooperative. The noncooperativity and metastability of RNA folding are consistent with the bumpy RNA folding free energy landscape (Chen and Dill 2000). Physically, the RNA noncooperativity stems from the additive stabilities (nearest-neighbor interactions) in RNA secondary structures.
SUMMARY
We develop a statistical mechanical model for RNA folding thermodynamics. The model is based on the reduced (virtual bond) chain representation for RNA conformations. The model, which can account for the atomic details for realistic RNA conformations, can be further used to study RNA tertiary folds. Distinctive features of the model include (1) the explicit inclusion of the intra-loop base-stacking interactions and the loop–helix correlations in the free energy calculation and (2) the rigorous polymer principle treatment for the conformational statistics. Experimental tests show that the model is able to give improved predictions for the melting curves and the native structures for simple RNA secondary structures. Moreover, application of the model to the investigation of the folding thermodynamics for the P5abc region of the Tetrahymena group I ribozyme leads to the following predictions: (1) The folding of P5abc involves a native-like intermediate and a misfolded intermediate. (2) The A62C, A64G, and A65G mutations in loop L5a and A49C and A50G in loop L5c can cause drastic changes in the free energy landscape and thus cause significant changes in the folding thermodynamics. None of the mutations in loop L5b can cause notable changes in the shape of the free energy landscape. (3) The wild-type sequence as well as the mutants show low thermodynamic folding cooperativity.
The present form of the model is limited by neglecting (1) the temperature dependence of the base-stacking enthalpy and entropy parameters and (2) the possible single-strand base stacking. These limitations may contribute to the theory–experiment differences. Nevertheless, the present theory provides a statistical mechanical machinery for a systematic development of the model by including more energetic and conformational details. Although the current form of the model is developed for secondary structures, the present conformational model can be directly applied to model complex tertiary folds.
Moreover, the model may provide a framework for further inclusion of the ion electrostatic effects in RNA folding (Koculi et al. 2004; Draper et al. 2005; Tan and Chen 2005). With the virtual bond representation, the model can generate an ensemble of RNA structures at the reduced atomic level (virtual bonds through the P and C4 atoms). Such a model can give a coarse-grained description for the ion-binding modes (distributions of the bound ions). Ion-binding in some tertiary interactions may involve atomic details that the current form of the model cannot treat. For such cases, we need to refine the model by including more complete atomic coordinates for the part of the structure involved in the tertiary interaction.
Acknowledgments
We acknowledge grant supports from the NIH (GM063732 to S.-J.C.) and from MU life science fellowship (to S.C.). We thank Frank Schmidt for useful discussions.
APPENDIX
Calculating the partition function
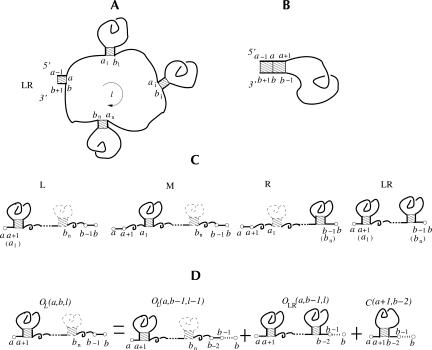
According to whether the chain is closed by a base stack, we classify two types of RNA conformations: “closed” if the two ends of the chain are closed by a base stack and “open” otherwise. For example, the conformations for the chain from a − 1 to b + 1 in Figure 11A,B are “closed” because a − 1 and b + 1 are paired in a base stack, while the conformations for the chain from a to b in Figure 11C are “open.”
FIGURE 11.
A closed conformation with the closing stack connected to a loop (A ) or to a stack (B ). (C ) The four open conformation types (L , M , R, and LR ). The closed conformation in A is formed from the open conformation in C through the closure of the unstacked loop of length l in A. ( D) The partition function for L-type conformations for a chain froma to b can be computed as the sum of the partition function for a shorter chain from a to b − 1.
RNA secondary structure shows a recursive hierarchy: the closing base stack of a closed conformation can be connected to another smaller closed conformation either through an unstacked loop (loop without any intra-loop base stacks; see the loop of length l in Fig. 11A) or through a base stack (see the stack formed by a, b, a + 1, and b − 1 in Fig. 11B). To account for the correlation between the unstacked loop (the loop a → b of length l in Fig. 11A) and the neighboring closing base stack (the stack formed by a, b, a − 1, and b + 1 in Fig. 11A), we classify the unstacked loop conformations ( a → b ) according to the position of a1 (b n ) relative to a(b):
 |
See also Figure 11C. Here we note that a is the (left) 5 ′-terminal nucleotide and b is the (right) 3 ′-terminal nucleotide.
According to the above definition, a type LR open conformation contains at least two closed conformations. Types L, R, LR, and M correspond to a bulge on the strand close to the 3′-end, on the strand close to the 5′-end, on both the 5′ and the 3′ strands, and an internal unstacked loop, respectively.
We use Ot(a, b, l) to denote the partition function for all the type-t open conformations from a to b with an unstacked loop of length l (see Fig. 11A,C). We also use C(a, b) to denote the partition function for all the possible closed conformations from a to b. The hierarchical relationship of the secondary structure results in the following recursive relation for the partition functions:
 |
(7) |
where Δ Gstack is the free energy of the closing stack formed by base pairs (a, b) and (a −1, b + 1) and ΔSunstacked(l) is the entropy for the unstacked loop of length l for a given type t.
From Equation 7, we find that the key for the partition function is to obtain Ot(a, b, l) for different as and bs. For RNA secondary structures, Ot(a, b, l) can be conveniently calculated recursively from the partition functions of shorter chains:
 |
(8) |
 |
(9) |
 |
(10) |
 |
(11) |
Figure 11D shows an illustration for the recursive relation for the calculation of OL(a, b, l): The complete conformational ensemble of open conformations from a to b can be generated by adding the nucleotide b to the 3′-end of (1) all the possible type L and LR open conformations from a to b −1 and (2) all the possible closed conformations from a to b − 1. The recursive relations for type R, LR, and M conformations can be understood through similar diagrammatic illustrations.
The total partition function Q(a, b) for a chain from a to b is given by the sum of the partition functions for all the different types of conformations:
 |
(12) |
The first term comes from the contribution of the unfolded coil state. The computational time scales with the chain length N as O(N4) and the memory scales as O(N2).
Compared with the previous models, the present model is based on base stacks instead of base pairs. More importantly, the conformational entropies in the model are computed from an ab initio polymer principle theory with detailed accounts of the loop-coil atomic structures instead of from empirical approximations (e.g., the linear approximation for the multiloop entropy) (McCaskill 1990) or from other unrealistic simplified models (Chen and Dill 1995, 1998, 2000; Zhang and Chen 2001). Furthermore, the classification of the four types of conformations allows for more accurate treatment for the correlations between the connecting unstacked loop and the connected helical stacks. For example, for a multibranched unstacked loop of a given length l, different types (types L, R, LR, and M) would have different loop entropies in the calculation. In addition, the model accounts for the mismatched base stacks in a loop (≠ unstacked loop). Therefore, the present model is more physical and may be able to give improved predictions for RNA thermodynamics.
Article published online ahead of print. Article and publication date are at http://www.rnajournal.org/cgi/doi/10.1261/rna.2109105.
REFERENCES
- Antao, V.P. and Tinoco Jr. I., 1992. Thermodynamic parameters for loop formation in RNA and DNA hairpin tetraloops. Nucleic Acids Res. 20: 819–824. [DOI] [PMC free article] [PubMed] [Google Scholar]
- Biswas, R., Mitra, S.N., and Sundaralingam, M. 1998. 1.76Å structure of a pyrimidine start alternating A-RNA hexamer r(CGUAC)dG. Acta Cryst. D 54: 570–576. [DOI] [PubMed] [Google Scholar]
- Chan, H.S., Shimizu, S., and Kaya, H. 2004. Cooperativity principles in protein folding. Methods Enzymol. 380: 350–379. [DOI] [PubMed] [Google Scholar]
- Chen, S.-J. and Dill, K.A. 1995. Statistical thermodynamics of doublestranded polymer molecules. J. Chem. Phys. 103: 5802–5813. [Google Scholar]
- ———. 1998. Theory for the conformational changes of doublestranded chain molecules. J. Chem. Phys. 109: 4602–4616. [Google Scholar]
- ———. 2000. RNA folding energy landscapes. Proc. Natl. Acad. Sci. 97: 646–651. [DOI] [PMC free article] [PubMed] [Google Scholar]
- Correll, C.C. and Swinger, K. 2003. Common and distinctive features of GNRA tetraloops based on a GUAA tetraloop structure at 1.4Å resolution. RNA 9: 355–363. [DOI] [PMC free article] [PubMed] [Google Scholar]
- Deng, J., Xiong, Y., Sudarsanakumar, C., Shi, K., and Sundaralingam, M. 2001. Crystal structures of two forms of a 14-mer RNA/DNA chimer duplex with double UU bulges: A novel intramolecular U*(A·U) base triple. RNA 7: 1425–1431. [PMC free article] [PubMed] [Google Scholar]
- Draper, D.E., Grilley, D., and Soto, A.M. 2005. Ions and RNA folding. Ann. Rev. Biophys. Biol. Mol. Struct. 34: 221–243. [DOI] [PubMed] [Google Scholar]
- Duarte, C.M. and Pyle, A.M. 1998. Stepping through an RNA structure: A novel approach to conformational analysis. J. Mol. Biol. 284: 1465–1478. [DOI] [PubMed] [Google Scholar]
- Duarte, C.M., Wadley, L.M., and Pyle, A.M. 2003. RNA structure comparison, motif search and discovery using a reduced representation of RNA conformational space. Nucleic Acids Res. 31: 4755– 4761. [DOI] [PMC free article] [PubMed] [Google Scholar]
- Flory, P.J. 1969. Statistical mechanics of chain molecules. Wiley, New York.
- Gluick, T.C. and Draper, D.E. 1994. Thermodynamics of folding a pseudoknotted mRNA fragment. J. Mol. Biol. 241: 246–262. [DOI] [PubMed] [Google Scholar]
- Heus, H.A. and Pardi, A. 1991. Structural features that give rise to the unusual stability of RNA hairpins containing GNRA loops. Science 253: 191–194. [DOI] [PubMed] [Google Scholar]
- Jaeger, J.A., Turner, D.H., and Zuker, M. 1989. Improved predictions of secondary structures for RNA. Proc. Natl. Acad. Sci. 86: 7706– 7710. [DOI] [PMC free article] [PubMed] [Google Scholar]
- Joyce, G.F., van der Horst, G., and Inoue, T. 1989. Catalytic activity is retained in the Tetrahymena group I intron despite removal of the large extension of element P5. Nucleic Acids Res. 17: 7879–7889. [DOI] [PMC free article] [PubMed] [Google Scholar]
- Kierzek, R., Burkard, M.E., and Turner, D.H. 1999. Thermodynamics of single mismatches in RNA duplexes. Biochemistry 38: 14214– 14223. [DOI] [PubMed] [Google Scholar]
- Koculi, E., Lee, N.K., Thirumalai, D., and Woodson, S.A. 2004. Folding of the Tetrahymena ribozyme by polyamines: Importance of counterion valence and size. J. Mol. Biol. 341: 27–36. [DOI] [PubMed] [Google Scholar]
- Laing, L.G. and Draper, D.E. 1994. Thermodynamics of RNA folding in a conserved ribosomal RNA domain. J. Mol. Biol. 237: 560–576. [DOI] [PubMed] [Google Scholar]
- Li, Y. and Turner, D.H. 1997. Effects of Mg2+ and the 2′ OH of guanosine on steps required for substrate binding and reactivity with the Tetrahymena ribozyme reveal several local folding transitions. Biochemistry 36: 11131–11139. [DOI] [PubMed] [Google Scholar]
- Long, K.S. and Crothers, D.M. 1999. Characterization of the solution conformations of unbound and Tat peptide-bound forms of HIV- 1 TAR RNA. Biochemistry 38: 10059–10069. [DOI] [PubMed] [Google Scholar]
- Malathi, R. and Yathindra, N. 1981. Virtual bond probe to study ordered and random oil conformations of nucleic acids. Intl. J. Quant. Chem. 20: 241–257. [Google Scholar]
- Mathews, D.H., Sabina, J., Zuker, M., and Turner, D.H. 1999. Expanded sequence dependence of thermodynamic parameters improves prediction of RNA secondary structure. J. Mol. Biol. 288: 911–940. [DOI] [PubMed] [Google Scholar]
- Mattice, W.L. and Suter, U.M. 1994. Conformational theory of large molecule: The rotational isomeric state model in macromolecular systems. Wiley, New York.
- McCaskill, J.S. 1990. The equilibrium partition-function and base pair binding probabilities for RNA secondary structure. Biopolymers 29: 1105–1119. [DOI] [PubMed] [Google Scholar]
- Murray, L.J., Arendall III, W.B., Richardson, D.C., and Richardson, J.S. 2003. RNA backbone is rotameric. Proc. Natl. Acad. Sci. 100: 13904–13909. [DOI] [PMC free article] [PubMed] [Google Scholar]
- Olson, W.K. 1975. Configuration statistical of polynucleotide chains. A single virtual bond treatment. Macromolecules 8: 272–275. [DOI] [PubMed] [Google Scholar]
- ———. 1980. Configurational statistics of polynucleotide chains: An updated virtual bond model to treat effects of base stacking. Macromolecules 13: 721–728. [Google Scholar]
- Olson, W.K. and Flory, P.J. 1972. Spatial configuration of polynucleotide chains: I. Steric interactions in polyribonucleotides: A virtual bond model. Biopolymers 11: 1–23. [DOI] [PubMed] [Google Scholar]
- Pan, J., Thirumalai, D., and Woodson, S.A. 1999. Magnesium-dependent folding of self-splicing RNA: Exploring the link between cooperativity, thermodynamics, and kinetics. Proc. Natl. Acad. Sci. 96: 6149–6154. [DOI] [PMC free article] [PubMed] [Google Scholar]
- Puglisi, J.D., Tan, R.Y., Calnan, B.J., Frankel, A.D., and Williamson, J.R. 1992. Conformation of the TAR RNA-arginine complex by NMR-spectroscopy. Science 257: 76–80. [DOI] [PubMed] [Google Scholar]
- Puglisi, J.D., Chen, L., Frankel, A.D., and Williamson, J.R. 1993. Role of RNA structure in arginine recognition of TAR RNA. Proc. Natl. Acad. Sci. 90: 3680–3684. [DOI] [PMC free article] [PubMed] [Google Scholar]
- Rapold, R.F. and Mattice, W.L. 1995. New high-coordination lattice model for rotational isomeric state polymer-chains. J. Chem. Soc. Faraday Trans. 91: 2435–2441. [Google Scholar]
- Rich, A., Crick, F.H.C., Watson, J.D., and Davies, D.R. 1961. Molecular structure of polyadenylic acid. J. Mol. Biol. 3: 71–86. [DOI] [PubMed] [Google Scholar]
- Serra, M.J. and Turner, D.H. 1995. Predicting thermodynamic properties of RNA. Methods Enzymol. 259: 242–261. [DOI] [PubMed] [Google Scholar]
- Serra, M.J., Barnes, T.W., Betschart, K., Gutierrez, M.J., Sprouse, K.J., Riley, C.K., Stewart, L., and Temel, R.E. 1997. Improved parameters for the prediction of RNA hairpin stability. Biochemistry 36: 4844–4851. [DOI] [PubMed] [Google Scholar]
- Silverman, S.K., Zheng, M., Wu, M., Tinoco Jr., I., and Cech, T.R. 1999. Quantifying the energetic interplay of RNA tertiary and secondary structure interactions. RNA 5: 1665–1674. [DOI] [PMC free article] [PubMed] [Google Scholar]
- Speek, M. and Lind, A. 1982. Structural analyses of E. coli 5S RNA fragments, their associates and complexes with proteins L18 and L25. Nucleic Acids Res. 10: 947–963. [DOI] [PMC free article] [PubMed] [Google Scholar]
- Tan, Z.J. and Chen, S.J. 2005. Electrostatic correlations and fluctuations for ion binding to a finite length polyelectrolyte. J. Chem. Phys. 122: 044903. [DOI] [PMC free article] [PubMed] [Google Scholar]
- Tao, J., Chen, L., and Frankel, A.D. 1997. Dissection of the proposed base triple in human immunodeficiency virus TAR RNA indicates the importance of the Hoogsteen interaction. Biochemistry 36: 3491–3495. [DOI] [PubMed] [Google Scholar]
- Thirumalai, D. 1998. Native secondary structure formation in RNA may be a slave to tertiary folding. Proc. Natl. Acad. Sci. 95: 11506–11508. [DOI] [PMC free article] [PubMed] [Google Scholar]
- van der Horst, G., Christian, A., and Inoue, T. 1991. Reconstitution of a group-I intron self-splicing reaction with an activator RNA. Proc. Natl. Acad. Sci. 88: 184–188. [DOI] [PMC free article] [PubMed] [Google Scholar]
- Wu, M. and Tinoco Jr., I., 1998. RNA folding causes secondary structure rearrangement. Proc. Natl. Acad. Sci. 95: 11555–11560. [DOI] [PMC free article] [PubMed] [Google Scholar]
- Zarrinkar, P.P. and Williamson, J.R. 1994. Kinetic intermediates in RNA folding. Science 265: 918–924. [DOI] [PubMed] [Google Scholar]
- Zhang, W. and Chen, S.-J. 2001. A three-dimensional statistical mechanical model of folding double-stranded chain molecules. J. Chem. Phys. 114: 7669–7681. [Google Scholar]
- Zheng, M., Wu, M., and Tinoco Jr., I., 2001. Formation of a GNRA tetraloop in P5abc can disrupt an interdomain interaction in the Tetrahymena group I ribozyme. Proc. Natl. Acad. Sci. 98: 3695–3700. [DOI] [PMC free article] [PubMed] [Google Scholar]


