Abstract
With the increasing amount of data produced by high-throughput technologies in many fields of science, clustering has become an integral step in exploratory data analysis in order to group similar elements into classes. However, many clustering algorithms can only work properly if aided by human expertise. For example, one parameter which is crucial and often manually set is the number of clusters present in the analyzed set. We present a novel stopping rule to find the optimal number of clusters based on the comparison of the density of points inside the clusters and between them. The method is evaluated on synthetic as well as on real transcriptomic data and compared with two current methods. Finally, we illustrate its usefulness in the analysis of the expression profiles of promyelocytic cells before and after treatment with all-trans retinoic acid. Simultaneous clustering for gene regulation and absolute initial expression levels allowed the identification of numerous genes associated with signal transduction revealing the complexity of retinoic acid signaling.
INTRODUCTION
Cluster analysis is nowadays a major challenge in many disciplines where specialists need to know how their data are organized. In many cases, clustering is still supervised by an expert who customizes the algorithm he uses to obtain the most meaningful results. There is clearly a need for automation if the data sets to be clustered become huge or if there are too many of them to be humanly manageable. This is the case in biology and particularly in transcriptomics where more and more genes are assayed under multiple conditions such as different time points during a biological process or different tissue samples. Two major problems which are intimately linked and that should be solved automatically are the determination of a good number of clusters and the assessment of the results.
There is a wide literature that describes how to determine automatically the number of clusters; in 1985 Milligan and Cooper (1) reviewed 30 different methods. However, they were mainly applied to theoretical sets and only in the last 5 years have methods that find the number of clusters automatically been applied to real data and in particular transcriptomic data. Among these methods we distinguish those that work on similarity values such as CLICK (2), CLIFF (3), Horimoto’s method (4) and Taxmap (5), or distances such as Lukashin’s method (6) and Secator (7) from those that use the elements’ coordinates such as Mclust (8) and mode analysis (9).
Similarity values are useful for clustering elements that vary similarly in the different dimensions, for example, for grouping together genes which vary in the same way with time. However, similarity values are usually obtained by normalizing the elements’ coordinates either implicitly by calculating a correlation coefficient or explicitly by normalizing and then performing a dot product for example. In general, information is lost in the normalization process. In fact, one cannot deduce the original coordinates from the similarity values. Distances calculated from the coordinates can also be valuable due to their simplicity but, until now, distances in either a very tight cluster or in a very sparse cluster are considered in the same way, which is unrealistic in many cases. As for methods clustering raw data, i.e. the elements’ coordinates, the most successful methods that estimate automatically the number of clusters in a data set are model-based methods such as Mclust (8), which considers each cluster as a sample of a Gaussian mixture distribution. The model-based methods are interesting for their statistical background but at the same time the model they use is not always adapted to a particular data set.
In this paper, we will deal primarily with the problem of finding the correct number of clusters and will assess the clusters’ quality only if a reference clustering is available. We propose a new method to find the number of clusters, implemented in a program called DPC (density of points clustering). DPC uses coordinate values, as with Mclust, but contrary to it, makes no a priori assumption about a distribution function describing the clusters. At the heart of the algorithm is the idea that a cluster should be divided into two clusters if between these clusters there is a scarcity of points compared with the density of points in the neighborhood of the clusters. Intuitively, clusters are separated if there is a too tenuous connectivity between them. Other density-dependent clustering algorithms are Taxmap (5) and mode analysis (9). However, Taxmap initially requires a threshold value for its measure of discontinuity and mode analysis requires a density threshold. Therefore, these methods are not fully automatic.
DPC is first tested on a two-dimensional synthetic non-normalized set in order to verify its agreement with true clusters that can be visually determined and then on other data sets in higher dimensions. The DPC results are compared with the results of Mclust (8) which is one of the best programs that can automatically determine the number of clusters in a set of points described by non-normalized data. DPC is also tested on the yeast normalized data set analyzed by Tavazoie et al. (10) and compared with Mclust (8) and CLICK (2) which is one of the best methods for normalized data. Finally, we apply DPC to a three-dimensional non-normalized leukemic data set taking advantage of the method’s ability to automatically find the number of clusters.
MATERIALS AND METHODS
Let us consider a set E of n points P1, …, Pn with each Pi = (Pi1, Pi2, …, Pim) in ℜm, where ℜ is the set of real numbers. For DNA chips data, E stands for a set of n genes for which m hybridization conditions are available. Starting with an initial cluster containing all the points, DPC divides it and tests whether it should be divided or not. If it is not divided then there is only one cluster in the data set, otherwise there are at least two clusters that will be iteratively divided if necessary. The division is attempted by the k-means method with k = 2. The test is based on point density measures. If the density measure between two possible clusters is too small compared with the density measure inside both clusters, the two clusters are kept because they are not well connected to each other.
In order to explain how the density measure is computed we have to first introduce some definitions, and in particular what we call the proximity index which indicates how close a point is to other points. Let Min be the point whose coordinate in each dimension is the minimum of the coordinates in that dimension for all the points of E, ∀k ∈ 1, …, m, Mink = mini∈1,…,n Pik, let ![]() = (c1, c2, …, cm) be the vector defined by coordinates ck = maxi∈1,…,n Pik – mini∈1,…,n Pik, and HR be the hyper rectangle enclosing E defined by the extreme points Min and Min +
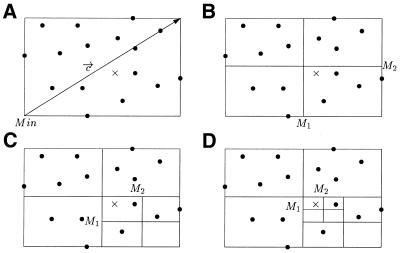
= (c1, c2, …, cm) be the vector defined by coordinates ck = maxi∈1,…,n Pik – mini∈1,…,n Pik, and HR be the hyper rectangle enclosing E defined by the extreme points Min and Min + ![]() and let A be a point in HR. Figure 1 shows an example in two dimensions. The proximity index ProxI(A) for the point A is equal to the number of divisions of HR necessary to isolate A into a sub-hyper rectangle of HR from all other points of E. Thus, the higher the proximity index is, the closer A is to other points. When dividing a hyper rectangle into sub-hyper rectangles, each side of the hyper rectangle is divided in two. In Figure 1, the proximity index of the point A marked by a cross is 3. Given l ∈
and let A be a point in HR. Figure 1 shows an example in two dimensions. The proximity index ProxI(A) for the point A is equal to the number of divisions of HR necessary to isolate A into a sub-hyper rectangle of HR from all other points of E. Thus, the higher the proximity index is, the closer A is to other points. When dividing a hyper rectangle into sub-hyper rectangles, each side of the hyper rectangle is divided in two. In Figure 1, the proximity index of the point A marked by a cross is 3. Given l ∈ ![]() , with
, with ![]() the set of natural numbers, we associate with A a sub-hyper rectangle HRl(A) of size (c1 / 2l) × (c2 / 2l) × ··· × (cm / 2l) defined by two extreme points M1 and M2 such as ∀k ∈ 1, …, m, M1k = Mink + ⌊(Ak – Mink) / (ck / 2l)⌋ × (ck / 2l) and M2k = M1k + (ck / 2l). Hence
the set of natural numbers, we associate with A a sub-hyper rectangle HRl(A) of size (c1 / 2l) × (c2 / 2l) × ··· × (cm / 2l) defined by two extreme points M1 and M2 such as ∀k ∈ 1, …, m, M1k = Mink + ⌊(Ak – Mink) / (ck / 2l)⌋ × (ck / 2l) and M2k = M1k + (ck / 2l). Hence
Figure 1.
Example of the calculation of a proximity index in two dimensions. Here the proximity index of the point A marked by a cross is 3 because to isolate it from all its neighbors it is necessary to divide the original rectangle three times. (A) Original hyper rectangle HR which is also denoted as HR0(A). (B) Division of HR0(A). (C) Division of HR1(A). (D) Division of HR2(A) and separation of A from all other points.
ProxI(A) = min{l / ∄i ∈ 1, …, n, Pi ∈HRl(A)}
Now we can define the density of points between two clusters C1 and C2. In fact we define two such densities, Density1 and Density2, the latter being aimed at noisy data. For a subset S of pairs of points of C1 × C2, we define a set R1 (respectively, R2) of points for Density1 (respectively, Density2) in the following way. For each pair of points (Pi, Pj) ∈ S we define a point A1 of R1 (respectively, a point A2 of R2) such that ∀k ∈ 1, 2, …, m, A1k = [(Pik + Pjk) / 2] [respectively, A2k = Pik + u × (Pjk – Pik) where u is a uniform random variable which takes values between 0 and 1]. Then, Density1(C1, C2) and Density2(C1, C2) are, respectively, the means of the proximity indices in R1 and R2:
Density1(C1, C2) = [ΣA1∈R1ProxI(A1)] / |R1|
and
Density2(C1, C2) = [ΣA2∈R2ProxI(A2)] / |R2|
Similarly, we define the density of points Density(C) inside a cluster C as the mean of the proximity indices of points generated randomly starting from points in cluster C.
For a subset of points S ⊂ C, we define a set R of points in the following way. For each point Pi ∈ S we find its closest point Pj in E \ Pi and we define a point A of R such that: ∀k = 1, …, m, Ak = Pik + (–1)bu(Pjk – Pik) where b is a Bernouilli random variable of parameter 0.5 and u a uniform random variable which takes values between 0 and 1 so that all directions and all distances below the distance to the nearest point are equally probable. Then, Density(C) is the mean of the proximity indices of the points in R:
Density(C) = [ΣA∈RProxI(A)] / |R|
At each dividing step of the algorithm the question is ‘should cluster C be divided into clusters C1 and C2?’ Using the density measures we can answer this by comparing Density(C) with Density1(C1, C2) or with Density2(C1, C2) if the data are noisy. We assume for a ANOVA test that the proximity indices for R on one side and for R1 or R2 on the other side are samples issued from the same population. If the two samples are significantly different and, respectively, Density(C) > Density1(C1, C2) or Density(C) > Density2(C1, C2) then we divide C into C1 and C2.
RESULTS
Synthetic data sets
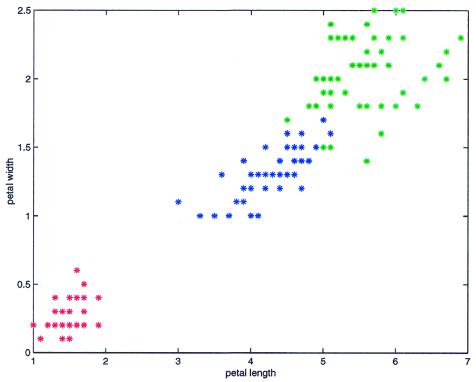
To validate clustering algorithms, algorithms are generally tested on data sets for which the ‘true’ clusters are known. The data may be either synthetic (1) or real, e.g. the Iris data set (11) which is one of the best known data sets (Fig. 2). The Iris data set is composed of 150 random samples of flowers from the iris species setosa, versicolor and virginica. For each species there are 50 observations in four dimensions for sepal length, sepal width, petal length and petal width in centimeters. Fisher (11) used this data in 1936 to test his linear discriminant function technique. Finding two clusters, one containing all 50 iris flowers from the setosa species and the other the 100 flowers from the versicolor and virginica species, is usually accepted as being a good solution. In addition to the low number of clusters these two clusters are well separated and there is no noise between them. DPC finds these two clusters but as nearly all algorithms perform well on this data set we cannot use it to assess the quality of DPC.
Figure 2.
Iris data set represented with only two attributes: petal length (abscisses) and petal width (ordinates). The iris species setosa are in red, versicolor in blue and virginica in green.
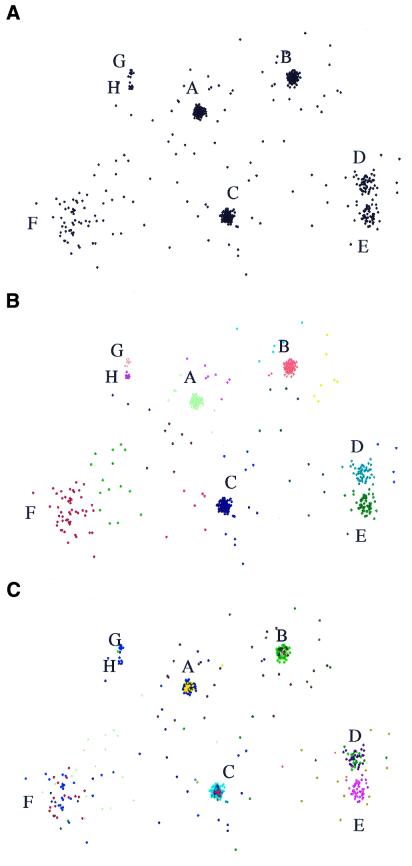
Therefore, we define a new synthetic data set of 875 two-dimensional points (Fig. 3A) that presents a number of difficulties simultaneously such as different cluster sizes, different compactness values, very close clusters and noise. This data set is composed of three well defined clusters A, B and C of 200 points each, two clusters D and E of 50 points which are quite close, one cluster F of 50 points which has a large sparseness in comparison with the others and two little clusters G and H which are also close to each other, one of 12 points and one of 15 points. In addition, there are 98 noise points, most of them constituting crowns around clusters A, B, C and D, with others located between clusters A and F. This data set is available on the web at http://www-bio3d-igbmc.u-strasbg.fr/∼wicker/DPC/dpc.html.
Figure 3.
(A) Synthetic data set consisting of 875 two-dimensional points containing eight well-defined clusters and a number of noise points. (B) Clusters found by DPC. A different color is assigned to each DPC cluster. DPC identifies all eight clusters while (C) the groups A, B, C, D and F are not well identified by Mclust which tends to superpose two mixture models on each of these groups instead of only one.
DPC finds 22 clusters in this data set, as shown in Figure 3B. DPC identifies the eight clusters described above as distinct and homogeneous clusters, while most of the ‘noise’ crowns were defined as separate independent clusters. To estimate the quality of this result we have calculated the adjusted Rand index proposed by Hubert and Arabie (12) and also used by Yeung et al. (13). The Rand index gives the percentage of times two elements are together or separated in the solution given by an algorithm that are also together or separated in the ‘true’ solution. The index takes values between 0 and 1, 1 being the best score. The adjusted Rand index corrects the Rand index by taking into account the expected Rand index calculated when doing random clusterings. We only consider clusters A, B, C, D, E, F, G and H as we are not interested in the remaining noise points. The DPC clustering scores 0.99, which confirms that the true clusters are well identified. The remaining 14 clusters are clusters of noise, whose existence prevents the ‘true’ clusters from being ‘polluted’ by noise.
Mclust (8) has also been applied to this data set as it is to our knowledge one of the best clustering programs applicable to data sets described by coordinates that show no peculiar properties such as mean-variance normalization. Using its default setting (i.e. the unconstrained model VVV), Mclust finds 23 clusters, with an adjusted Rand index of 0.79. A closer inspection of the Mclust results (Fig. 3C) reveals that clusters A, B, C, D and F are not well identified, since they have been divided into sub-clusters and that G and H have been grouped into one cluster. Grouping G and H may be legitimate considering the proximity and smallness of these two clusters. This may be due to the fact that Mclust is susceptible to the presence of noise. In addition, it does not check whether the Gaussian distributions it finds are overlapping or not.
To gain a more precise idea of the performance of DPC, we have tested DPC on 14 other data sets with varying noise and number of dimensions. Each data set consists of a variable number of groups, with each group containing 50 points generated by a Gaussian multinormal law with a variance– covariance matrix equal to σ2I where I is the identity matrix and σ a value that can vary from group to group. For each data set we have calculated the adjusted Rand index for Mclust and for DPC ignoring the noise points. The results can be seen in Table 1. Data sets 1–11 show that DPC is not sensitive to the increase in the number of dimensions contrary to Mclust. However, data sets 12–14, which contain groups more tightly close to each other, and for 13 and 14 more noise, show limit cases where both methods fail as the groups are not well separated.
Table 1. Comparison of results of Mclust and DPC on 14 synthetic data sets.
| Data set | 1 | 2 | 3 | 4 | 5 | 6 | 7 | 8 | 9 | 10 | 11 | 12 | 13 | 14 |
|---|---|---|---|---|---|---|---|---|---|---|---|---|---|---|
| No. of groups | 10 | 20 | 10 | 20 | 10 | 20 | 10 | 20 | 10 | 20 | 5 | 5 | 5 | 5 |
| No. of noise points | 50 | 100 | 50 | 100 | 50 | 100 | 50 | 100 | 50 | 100 | 25 | 0 | 125 | 150 |
| No. of dimensions | 10 | 10 | 30 | 30 | 50 | 50 | 75 | 75 | 100 | 100 | 500 | 10 | 10 | 10 |
| Mclust score | 0.67 | 0.82 | 0.22 | 0.24 | 0.04 | 0.16 | 0.04 | 0.07 | 0.07 | NA | NA | 0.31 | NA | NA |
| DPC score | 1.0 | 1.0 | 1.0 | 1.0 | 1.0 | 1.0 | 1.0 | 1.0 | 1.0 | 1.0 | 1.0 | 0.93 | 0.78 | 0 |
For each data set the number of groups (each group contains 50 points), the number of noise points, the number of dimensions and the adjusted Rand index for Mclust and DPC are shown. Data sets 1–11 show that DPC is not sensitive to the increase in the number of dimensions in contrast to Mclust. Data sets 12–14 contain groups in close proximity and show the limitations of both methods. NA, not available (when Mclust was unable to give a result).
Yeast data set
In order to evaluate the performance of DPC for real data sets, DPC has been applied to the classical yeast data set provided by Cho et al. (14). This set contains the expression profiles of approximately 6220 genes over 17 time points covering nearly two yeast cell cycles. Tavazoie et al. (10) discovered distinct expression patterns by doing a k-means cluster analysis, fixing manually the number of clusters k to 30. The k-means method was applied to the most variable 2945 genes which were previously mean-variance normalized and with time points at 90 and 100 min removed. The authors selected seven clusters, among the 30 clusters found by k-means, for which there is a significant grouping of genes within biologically meaningful clusters.
This 2945 gene data set is very attractive because we can use it to demonstrate that DPC is able to extract biologically relevant clusters without any a priori knowledge of the number of clusters. DPC finds 35 clusters which is close to the expert decision of 30 clusters. To investigate whether this is indeed a correct solution we inspected the resulting clusters more closely.
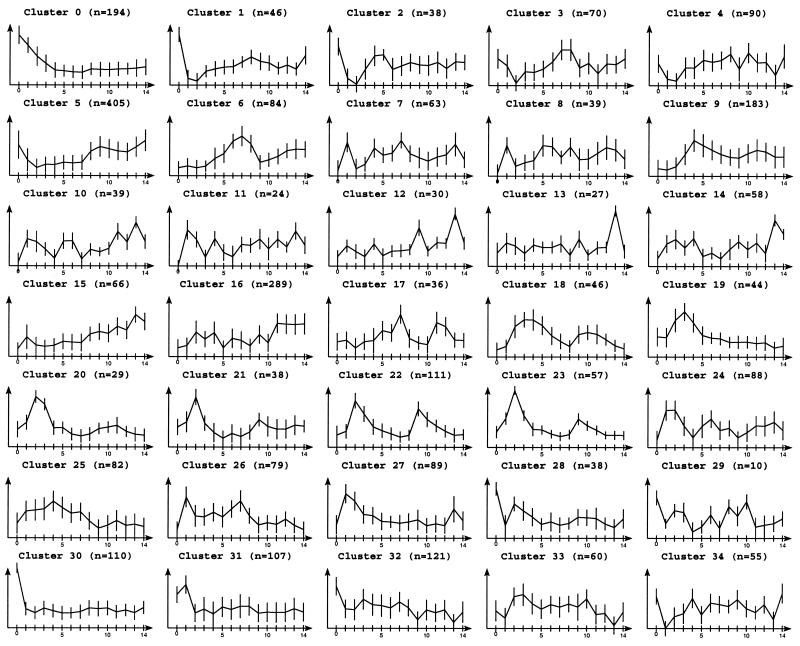
Nearly all of the seven biologically meaningful clusters were retrieved: cluster 14 (containing genes involved in the organization of the centrosome), cluster 7 (budding and cell polarity) and cluster 1 (ribosome) in Tavazoie’s paper correspond, respectively, to cluster 18, 6 and 16 in our notation (Fig. 4). Cluster 2 identified by Tavazoie as the replication and DNA synthesis genes cluster is mainly distributed on DPC’s clusters 22 and for some genes on 20 and 23. This is due to the different profile heights in the second cell cycle. Tavazoie’s cluster 4 (mitochondrial organization) and cluster 8 (carbohydrate metabolism) are merged in DPC’s cluster 5. These two clusters are very hard to separate as the main difference between them lies in the first time point where the values for the carbohydrate metabolism genes are on average higher than those for mitochondrial organization genes. But looking more carefully at these values we see that there is a continuum of values that join them. Tavazoie’s cluster 30 (methionine and sulfur metabolism) has been divided in many of DPC’s clusters, typically in cluster 9 with genes not easily separable from them.
Figure 4.
Expression profiles of the clusters obtained by DPC using the 2945 mean-variance normalized genes of the Tavazoie yeast data set (10) over 15 time points. Nearly all of the seven biologically meaningful clusters found by Tavazoie were retrieved in DPC clusters 5 (mitochondrial organization and carbohydrate metabolism), 6 (budding and cell polarity), 9 (methionine and sulfur metabolism), 16 (ribosome), 18 (organization of the centrosome), 20, 22 and 23 (replication and DNA synthesis).
We have compared these results with the results given by Mclust and CLICK for the same data set. Mclust with its default settings (the unconstrained model VVV) gives three clusters, which is far from the expected number of clusters. This is almost certainly due to the lack of data in comparison to the number of parameters which is proportional to the square of the data dimension (8). Therefore, we have also tested a more constrained model which implies less parameters, the unequal volume spherical model (VI) which gives 114 clusters. This last result seems more reasonable considering that at least seven meaningful clusters exist according to Tavazoie et al. (10). CLICK could be tested on this data set because the expression profiles are normalized. It finds 15 clusters and 66 isolated points. To compare the three results we use a measure of agreement, the adjusted Rand index (12), between each automatic clustering and the expertly determined clusters. Considering only the genes belonging to the seven most significant clusters of Tavazoie, DPC scores 0.46, CLICK 0.44 and Mclust 0.18. The execution times are respectively 6, 1 and 11 min.
We have also used DPC on the 6220 non-normalized genes of the yeast genome cell-cycle microarray analysis. This is interesting because the clustering is done on the raw expression profiles without any filtering so we can treat all the 6220 genes and at the same time have access to their expression levels. Indeed when doing clustering on mean-variance normalized data the expression levels are lost and in addition many genes must be discarded to avoid generating unrealistic expression profiles in the normalization process. It should be noted that this analysis is possible because DPC does not need normalized gene expression profiles as it works on coordinate values. CLICK, for example, if applied to this data set, would automatically normalize the values.
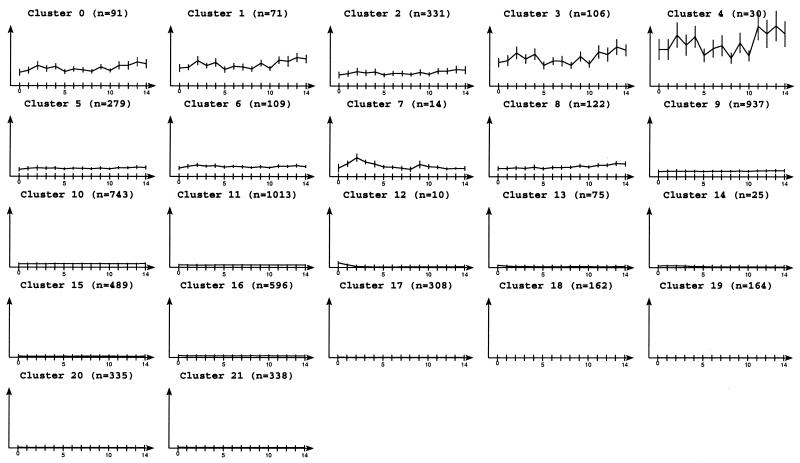
We obtain 22 clusters including many constant profiles (Fig. 5). These are not clusters of genes whose expression does not vary over the cell cycle but clusters whose average expression level is approximately the same. To assess the relevance of these clusters we have calculated the mean of their gene’s codon adaptation index (CAI) (15) which is a theoretical measure of gene expressivity. The Spearman rank correlation between the clusters’ mean expression levels and the clusters’ mean CAI is 94% which is significant for a risk of 0.1% and a sample of size 22. So, we can say that we have separated significantly different clusters with respect to their mean expression level. Furthermore, we have identified a cluster (cluster 7) of 14 genes, nine of which are highly expressed in mid or late G1 (RDH54, POL30, HEM13, CRH1, YGR151C, YFL068W, HXT2, CLN1 and CLN2). Three of these genes are implied in cell-cycle control: CLN1, CLN2 and RDH54. This cluster is interesting as it clusters similar profiles which share not only the same relative variations but also the same expression levels. We have also noticed that one gene in this cluster was not present in Tavazoie et al.’s analysis (10) after filtering genes too constant to be normalized, illustrating the bias of this processing step. Another interesting cluster is cluster 12 (size 10 genes) which has a decreasing expression since time 0 and which stabilizes at time point 4. It contains four heat-shock protein genes (HSP26, SSE2, HSP78 and SSA4), one gene (SPI1) induced by heat-shock and three co-induced in cell stress with HSP26 (YOR289W, YPR151C and GAD1) found in the YPD database (16).
Figure 5.
Expression profiles of the clusters obtained by DPC using the 6220 genes of the Cho yeast data set (14) without normalization. The clusters are essentially clusters of genes whose average expression level is approximately the same, however, some have interesting profiles such as cluster 7 containing genes highly expressed in mid or late G1 and cluster 12 containing heat-shock and stress protein genes.
Leukemic data set
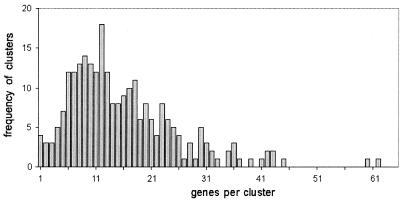
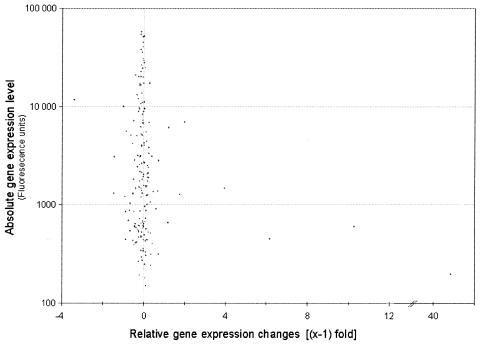
Promyelocytic cells undergo terminal differentiation and apoptosis after treatment with all-trans retinoic acid (at-RA) for 4 days (17). Previous studies revealed several waves of proteins involved in regulating apoptosis (18). However, the early steps of retinoic acid receptor signaling responsible for inducing terminal differentiation and apoptosis remained unclear. For this reason early events of transcriptional regulation of target genes were studied using a transcription profiling approach (19). Briefly, two independent untreated samples of NB4 cells were compared with one sample representing NB4 cells treated with at-RA for 18 h. Analysis of the resulting transcription profile by DPC allowed clustering of 3995 genes in 252 clusters while simultaneously considering two equally important factors, namely the basal gene-expression status and the degree of gene regulation. The frequency distribution of the number of genes per cluster is shown in Figure 6. The median cluster size was 13 genes and >75% of 3995 genes were grouped in clusters containing between 5 and 24 genes. For 181 clusters whose gene-expression values among the biological duplicates varied by <10%, the median gene regulation was plotted against the basal gene expression level (Fig. 7).
Figure 6.
Frequency distribution of cluster size for the leukemic data set. Expression data for leukemic cells treated with retinoic acid were analyzed using DPC. The 252 resulting clusters were examined for their size.
Figure 7.
Gene regulation in the leukemic data set. Median gene expression changes were plotted against basal gene expression levels for each cluster whose basal expression levels varied by <10%.
Two genes with extremely low basal transcription levels induced by at-RA in a very strong fashion (>30-fold) were found in cluster 0, one of them being a known cytokine (SCYA2). Two distinct clusters of low level expressed genes (approximately 500 fluorescence units, cluster 1 and 3) were distinguished with respect to different intensity of gene-induction. Cluster 3 which had a median induction of 11-fold, contained proteins associated with cell–cell signaling, signal transduction, organelle motility and a transport protein. In contrast, in cluster 1 which had less intensely regulated genes (7-fold) we identified several genes that may be associated with the initiation of differentiation (apoptosis inhibitor BCL2A1, purine metabolism, blood coagulation, phagocytosis) serving basic functions in cell-growth and maintenance. Two clusters for medium-low level initial expression were identified with 5-fold (cluster 2) or 2.7-fold induction (cluster 37). The latter contains several genes associated with signal transduction representing the first wave of target genes preparing terminal differentiation (EDNRB or endothelin receptor B, CD79A, PTPRC, HPCA, PIM1, HCK) in NB-4 cells. Interestingly, about half of the genes in this cluster have not been identified previously since they were located outside the statistical test thresholds. The genes in cluster 37 gave a profile rich in genes associated with or suspected to play a role in signal transduction, revealing the complexity of retinoic acid receptor signaling at this stage.
Similarly, more down-regulated genes were identified compared with previous studies using statistical tests not considering the intrinsic structure of clusters. As the overall number of down-regulated genes is low, clustering of the data was a particularly challenging task. Previous studies based on statistical tests without considering the additional structure of clusters suggested only nine down-regulated genes. DPC defined one cluster containing genes of various basal expression levels that are down-regulated 6–8-fold in at least half of the cases. In addition, a total of 24 weakly down-regulated genes (2–4-fold) were organized as three clusters corresponding to low, medium-low and medium basal expression levels.
We also investigated the nature of clusters containing the most constantly expressed genes. Cluster 166 contained 13 genes expressed at constant medium-low levels including several genes involved in basic metabolism (PCCA, NMOR2, CBR1, GTF2A2 and possibly TCN1). High level constant gene expression was found in cluster 10 of size 27 covering a wide variety of different functions ranging from cell structure (ARPC2), membrane-associated proteins (GNB2, PVBP2, VDAC3), cytochrome oxidases (COX5A, COX11) to chaperonins (CCT4) or DNA binding proteins (H3F3B). Detailed cluster results can be viewed at: http://www-bio3d-igbmc.u-strasbg.fr/∼wicker/DPC/dpc.html.
DISCUSSION
In this paper we have presented DPC, a clustering program implementing a new stopping rule which automatically determines a reasonable number of clusters while the clustering is performed on coordinate values. The efficiency of this approach has been verified on a number of synthetic data sets of non-normalized two-dimensional points. We have shown that DPC can identify homogeneous clusters separating them from clusters of noise. From this point of view, DPC performs better than Mclust (8) which is another algorithm that uses coordinate values.
We have also verified that DPC can produce biologically relevant results by analyzing the well-studied yeast cycle set of Cho et al. (14). With this data set, DPC outperforms Mclust and does as well as CLICK (2) which only considers normalized data. The results were compared using the adjusted Rand index which is an objective measure of the quality of a clustering when the ‘true’ clustering is known. On a recent non-normalized data set, for which the true clustering is not yet known, DPC was able to identify biologically interesting clusters for expression profiles of 3995 genes of promyelocytic cells after treatment with retinoic acid.
Traditional techniques used to analyze transcription profiling data were focused on only one variable, typically the extent of gene regulation. However, a candidate genes’ initial expression level is of key importance especially in cases defining biological switches of the type on/off or vice versa. DPC was used for simultaneous consideration of both parameters in a clustering analysis without deformation of data by supplementary normalization. This high resolution clustering approach distinguished 252 fairly homogeneous clusters for 3995 genes with a median cluster size of 13 genes. Interestingly, several clusters were characterized by similar basal expression levels but different profiles of gene regulation (clusters 1 and 3 or 2 and 37). These clusters contain genes with quite different biological functions. In the case of cluster 2, several genes responsible for transcription or general metabolism were grouped together as highly inducible while cluster 37 contains less induced genes, including numerous genes associated with signal transduction. A statistical test performed previously (19), suggested considering only half of the genes in cluster 37 as significantly regulated, while all the genes in cluster 37 have very similar expression profiles.
Highly induced genes can be easily identified by a variety of methods. However, the highest regulated genes may not be the key molecular switches. The presence of noisy data makes identification of low level regulated genes a challenging task where the clustering results provided by DPC were extremely valuable. Consideration of the intrinsic structure of the expression data opens novel perspectives reaching far beyond cut-off values to identify regulated genes.
DPC requires the user to specify a data density type before starting its clustering. Typically Density1 should be used on non-noisy data such as our synthetic data set, whereas Density2 is more suitable for noisy data sets such as DNA chips data sets. Another drawback is the tendency of DPC to create spherical clusters even if there is no assumption about the distribution type. This is due to the k-means clustering algorithm on which DPC is based. However, the stopping rule implemented by DPC could be used by other clustering algorithms such as the mixture model based methods or von Heydebreck et al.’s method (20) to overcome this problem.
In summary, DPC performs excellently in a wide variety of cases that are difficult to analyze using current methods. DPC can be applied successfully to data sets in a large range of dimensions, can distinguish small groups from big ones and create homogeneous clusters separating them from clusters of noise. This represents a new strategy in clustering, which focuses on a points’ density analysis inside and outside clusters and should be useful in gene expression data.
IMPLEMENTATION
DPC is written in C, has been tested on Unix and is free to academic/non-profit research organizations on the site: http://www-bio3d-igbmc.u-strasbg.fr/∼wicker/DPC/dpc.html. Two display programs are also available, one for normalized data sets and the other for non-normalized data sets.
Acknowledgments
ACKNOWLEDGEMENTS
We would like to thank Rod Sharan for kindly answering our questions about the CLICK method. We are also grateful to Julie Thompson for helpful comments. This work was supported by institute funds from the Institut National de la Santé et de la Recherche Médicale, the Centre National pour la Recherche Scientifique, and the Hôpital Universitaire de Strasbourg. D.D. was supported by a post-doctoral fellowship grant from the GIP-HMR (site-project FRHMR2/9935). W.R. was financed in part through a Marie-Curie Fellowship, E.C. contract QLG3-CT2000-00844 and also was a participant in EMBO courses on Microarrays and Advanced Bioinformatics.
REFERENCES
- 1.Milligan G.W. and Cooper,M.C. (1985) An examination of procedures for determining the number of clusters in a data set. Psychometrika, 50, 159–179. [Google Scholar]
- 2.Sharan R. and Shamir,R. (2000) CLICK: a clustering algorithm with application to gene expression analysis. AAAI-ISMB, 307–316. [PubMed] [Google Scholar]
- 3.Xing E. and Karp,R. (2001) Cliff: clustering of high-dimensional microarray data via iterative feature filtering using normalized cuts. Bioinformatics, 17, S306–S315. [DOI] [PubMed] [Google Scholar]
- 4.Horimoto K. and Toh,H. (2001) Statistical estimation of cluster boundaries in gene expression profile data. Bioinformatics, 17, 1143–1151. [DOI] [PubMed] [Google Scholar]
- 5.Carmichael J. and Sneath,P. (1969) Taxometric maps. Syst. Zool., 18, 402–415. [Google Scholar]
- 6.Lukashin A.V. and Fuchs,R. (2001) Analysis of temporal gene expression profiles: clustering by simulated annealing and determining the optimal number of clusters. Bioinformatics, 17, 405–414. [DOI] [PubMed] [Google Scholar]
- 7.Wicker N., Perrin,G.R., Thierry,J.C. and Poch,O. (2001) Secator: a program for inferring protein subfamilies from phylogenetic trees. Mol. Biol. Evol., 18, 1435–1441. [DOI] [PubMed] [Google Scholar]
- 8.Fraley C. and Raftery,A. (1999) Mclust: software for model-based cluster analysis. J. Classification, 16, 297–306. [Google Scholar]
- 9.Wishart D. (1969) Numerical Taxonomy. Academic Press, New York, pp. 282–311.
- 10.Tavazoie S., Hughes,J.D., Campbell,M.J., Cho,R.I. and Church,G.M. (1999) Systematic determination of genetic network architecture. Nature Genet., 22, 281–285. [DOI] [PubMed] [Google Scholar]
- 11.Fisher R. (1936) The use of multiple measurements in taxonomic problems. Ann. Eugenics, 7, 179–188. [Google Scholar]
- 12.Hubert L. and Arabie,P. (1985) Comparing partitions. J. Classification, 2, 193–218. [Google Scholar]
- 13.Yeung K., Fraley,C., Murua,A., Raftery,A. and Ruzzo,W. (2001) Model-based clustering and data transformations for gene expression data. Bioinformatics, 17, 977–987. [DOI] [PubMed] [Google Scholar]
- 14.Cho R.J., Campbell,M.J., Winzeler,E.A., Steinmetz,L., Conway,A., Wodicka,L., Wolfsberg,T.G., Gabrielan,A.E., Landsman,D., Lockhart,D.J. and Davis,R.W. (1998) A genome-wide transcriptional analysis of the mitotic cell cycle. Mol. Cell, 2, 65–73. [DOI] [PubMed] [Google Scholar]
- 15.Sharp P. and Li,W. (1987) The codon adaptation index—a measure of directional synonymous codon usage bias and its potential applications. Nucleic Acids Res., 15, 1281–1295. [DOI] [PMC free article] [PubMed] [Google Scholar]
- 16.Hodges P., Payne,W. and Garrels,J. (1998) The Yeast Protein Database (YPD): a curated proteome database for Saccharomyces cerevisiae. Nucleic Acids Res., 26, 68–72. [DOI] [PMC free article] [PubMed] [Google Scholar]
- 17.Ruchaud S., Duprez,E., Gendron,M., Houge,G., Genieser,H., Jastorff,B., Doskeland,S. and Lanotte,M. (1994) Two distinctly regulated events, priming and triggering, during retinoid-induced maturation and resistance of NB4 promyelocytic leukemia cell line. Proc. Natl Acad. Sci. USA, 91, 8428–8432. [DOI] [PMC free article] [PubMed] [Google Scholar]
- 18.Altucci L., Rossin,A., Raffelsberger,W., Reitmair,A., Chomienne,C. and Gronemeyer,H. (2001) Retinoic acid-induced apoptosis in leukemia cells is mediated by paracrine action of tumor-selective death ligand trail. Nature Med., 7, 680–686. [DOI] [PubMed] [Google Scholar]
- 19.Raffelsberger W., Dembélé,D. Neubauer,M., Gottardis,M. and Gronemeyer,H. (2002) Quality indicators increase the reliability of microarray data. Genomics, 80, in press. [DOI] [PubMed] [Google Scholar]
- 20.von Heydebreck A., Huber,W., Poutska,A. and Vingron,M. (2001) Identifying splits with clear separation: a new class discovery method for gene expression data. Bioinformatics, 17, S107–S114. [DOI] [PubMed] [Google Scholar]


