Abstract
The ocr protein, the product of gene 0.3 of bacteriophage T7, is a structural mimic of the phosphate backbone of B-form DNA. In total it mimics 22 phosphate groups over ∼24 bp of DNA. This mimicry allows it to block DNA binding by type I DNA restriction enzymes and to inhibit these enzymes. We have determined that multiple ocr dimers can bind stoichiometrically to the archetypal type I enzyme, EcoKI. One dimer binds to the core methyltransferase and two to the complete bifunctional restriction and modification enzyme. Ocr can also bind to the component subunits of EcoKI. Binding affinity to the methyltransferase core is extremely strong with a large favourable enthalpy change and an unfavourable entropy change. This strong interaction prevents the dissociation of the methyltransferase which occurs upon dilution of the enzyme. This stabilisation arises because the interaction appears to involve virtually the entire surface area of ocr and leads to the enzyme completely wrapping around ocr.
INTRODUCTION
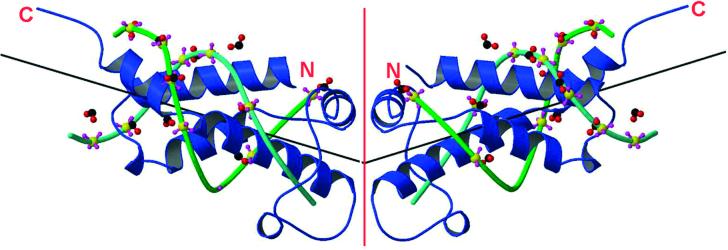
It is apparent from the atomic structure of the ocr protein produced by gene 0.3 of bacteriophage T7 that it is a mimic of the general structure of ∼24 bp of B-DNA containing a central kink of 34° (Fig. 1) (1). The surface of the protein is decorated with negatively charged groups which are superimposable upon the phosphate backbone of the DNA and the kink angle is similar to that induced by type I DNA restriction enzymes in their DNA targets. This similarity between ocr and the DNA target of these restriction enzymes allows ocr to act as an ‘antirestriction’ protein (2–4) and a ‘DNA mimic’ (1). The ocr antirestriction protein is the first product to be expressed from the T7 genome and it overwhelms the host type I restriction enzymes thereby allowing successful phage propagation (5).
Figure 1.
Superimposition of two 12 bp B-DNA molecules on the ocr dimer adapted from Walkinshaw et al. (1). Ocr is shown in blue ribbon form with N- and C-termini indicated and the dimer interface shown as a red line. A fit of phosphate groups of a B-DNA complex (1,42) onto 11 carboxyl groups of ocr gave an r.m.s. fit of 1.9 Å. Phosphate groups are coloured yellow (phosphorus) and purple (oxygen). The carboxyl groups are coloured red (oxygen) and black (carbon). The sugar backbones of the DNA chains are coloured in two shades of green with the base pairs omitted for clarity. Vectors for the DNA helical axes are drawn as black lines.
Escherichia coli, in common with many other bacteria and archaea, resists bacteriophage infection using DNA restriction and modification (R/M) systems comprising a restriction endonuclease activity which cuts the viral DNA and a modification methyltransferase activity which modifies host DNA (3). The 27 kDa dimeric ocr protein (6–8) knocks out a major subgroup of R/M enzymes, the type I R/M systems. These R/M systems contain both restriction and modification functions in a single enzyme (9–11). The antirestriction activity of ocr is not dependent on the DNA sequence recognised by the type I R/M enzyme. Each of the approximately 20 known type I R/M systems, covering four separate families in eubacteria and archaea, recognise a unique DNA target sequence (12). However, ocr will inactivate representatives of all four families irrespective of their DNA target sequence (1,13–15). This is achieved by very strong, stoichiometric binding of ocr to the R/M enzyme and the competitive displacement of DNA from the enzyme (7).
In this paper, we examine the nature of interactions between ocr and the archetypal type I R/M system, EcoKI. This R/M enzyme exists in two forms, R.EcoKI (440 kDa) and M.EcoKI (170 kDa) (16,17). R.EcoKI is a bifunctional restriction endonuclease and modification methyltransferase containing two restriction (R) subunits, two modification (M) subunits and one DNA specificity (S) subunit whilst M.EcoKI is a monofunctional modification methyltransferase containing two M and one S subunits.
MATERIALS AND METHODS
Proteins were prepared as described previously (7,8,16,18). Mutant forms of ocr are referred to as, for example, ocr(W94C) for the substitution of Trp94 by Cys and ocr(Cys) refers to any of the mutant forms containing a cysteine substitution. Note that wild-type ocr contains no cysteine. These six mutant proteins have previously been shown to react with a range of reagents (7) and were labelled with 1,5-IAEDANS and pyrene maleimide, two fluorophores that interact with -SH moieties. Ocr without any suffix refers to the wild-type protein. Steady-state fluorescence data were collected with a Perkin Elmer LS 50B spectrofluorimeter or an Edinburgh Instruments FS 900 CDT T-geometry fluorimeter. Calorimetry experiments were performed with a Microcal VP-ITC calorimeter. Unless otherwise indicated, the buffer used in all experiments was 20 mM Tris, 20 mM NH4Cl, 6 mM MgCl2 buffer, pH 8 at 25°C. Unless otherwise stated, all proteins were desalted using a PD-10 G-25 column (Amersham Pharmacia) equilibrated in buffer prior to use. Data were analysed using Grafit (Erithacus Software) or Origin (Microcal).
Isothermal titration calorimetry (ITC)
Both ocr and M.EcoKI were dialysed overnight into the above buffer. A 64.5 µM stock solution of ocr protein was titrated into 1.7 ml of 4.8 µM M.EcoKI in the VP-ITC cell. Aliquots of 10 µl of ocr were injected after an initial injection of 1 µl. The heat of dilution was obtained by injection of ocr into buffer alone and buffer directly into buffer. The values were subtracted from the ITC titration data.
Tryptophan fluorescence
An aliquot of 100 µl of 0.3 µM M.EcoKI was placed in a 3 mm path length cuvette and titrated with a 22 µM solution of ocr. Samples were excited at 295 nm and the emission spectra recorded between 300 and 500 nm. Excitation and emission slit widths of 5 and 10 nm, respectively, were used. The fluorescence of the buffer was subtracted from the emission spectra. Spectra were corrected for dilution and inner filter effects. Similar procedures were applied to the titrations using other components of the EcoKI R/M enzyme.
Experiments with 5-((((2-iodoacetyl)amino)ethyl)amino) naphthalene-1-sulfonic acid (1,5-IAEDANS)
Aliquots of 100 µl of 50 µM ocr(Cys) proteins were incubated overnight at 4°C in the dark with a 50-fold molar excess of 1,5-IAEDANS (Molecular Probes). The incubation was stopped by the addition of 100 mM 2-mercaptoethanol and unreacted probe removed by gel filtration on a PD-10 column. The concentration of AEDANS bound to the proteins was calculated from absorption using a molar extinction coefficient of 6100 M–1 cm–1 at 337 nm (19). The concentrations of all ocr(Cys) proteins except ocr(W94C) were calculated using a molar extinction coefficient of 32 095 M–1 cm–1 at 280 nm for the ocr dimer (7). The molar extinction coefficient of ocr(W94C) at 280 nm is 20 600 M–1 cm–1. The concentrations of the labelled proteins were calculated from the absorption spectra at 280 nm after subtracting the AEDANS absorbance at this wavelength (the molar extinction coefficient of 1,5-IAEDANS at 280 nm is 1060 M–1 cm–1).
To determine the stoichiometry of binding between ocr(Cys)–AEDANS and M.EcoKI, 100 µl of 1.0 µM ocr(Cys)–AEDANS solutions were titrated with increasing amounts of M.EcoKI. Excitation was at 330 nm and emission intensity monitored at 480 nm with slit widths of 5.0 and 10 nm, respectively. The cuvette path lengths were 3 mm.
The fluorescence intensity of ocr(Cys)–AEDANS proteins was quenched with acrylamide in the absence or presence of M.EcoKI. Solutions used were either 100 µl of 1.0 µM ocr(Cys)–AEDANS or 100 µl of 1.0 µM ocr(Cys)–AEDANS plus 2.0 µM M.EcoKI. The excess of M.EcoKI ensures the formation of a 1:1 complex. The samples were titrated with acrylamide to a final concentration of 0.5 M.
Labelling with 5-iodoacetamidefluorescein (5-IAF)
Ocr(N43C) protein was labelled with 5-IAF (Molecular Probes) overnight at 4°C in the dark using the same procedures as for 1,5-IAEDANS. The unbound 5-IAF was removed using a PD-10 column. The concentration of the label bound to the protein was calculated from the absorbance at 492 nm using an extinction coefficient of 71 000 M–1 cm–1. The protein concentration was determined from the absorbance at 280 nm after subtracting the absorbance of IAF at this wavelength.
An aliquot of 1 ml of 0.1 µM ocr(N43C)–AF was placed in a 4 × 10 mm cuvette (excitation path 10 mm) and titrated with R.EcoKI or M.EcoKI. The slit width used for excitation and emission was 5.4 nm. Labelled protein was excited at 492 nm, the emission spectra were integrated between 510 and 570 nm and the values obtained fitted to a single ligand binding site equation to derive a dissociation constant, Kd.
Labelling with N-(1-pyrene)maleimide (PM)
A stock solution of PM (Molecular Probes) was made in DMSO. Ocr(Cys) proteins were desalted into 100 mM sodium phosphate buffer, pH 7.0. An aliquot of 100 µl of 50 µM protein was incubated with a 50-fold excess of PM overnight at 4°C, in the dark. The labelling reaction was stopped by adding 2-mercaptoethanol to 100 mM final concentration. Unreacted fluorophore was removed using the PD-10 G-25 gel-filtration column equlibrated in the phosphate buffer (20). Labelling of the ocr(N4C) was performed in 100 mM sodium phosphate, 7 mM 2-mercaptoethanol, pH 7.0, buffer as this protein contains a proportion of disulphide bonds. The degree of labelling was determined spectrometrically using a value of 40 000 M–1 cm–1 for PM at 345 nm (21). The protein concentration was calculated from the absorbance at 280 nm after subtracting the absorbance of PM. The extinction coefficient of PM at this wavelength is 25 000 M–1 cm–1.
To determine the stoichiometry of binding between ocr(Cys)–PM and M.EcoKI, 100 µl of 1.0 µM ocr(Cys)–PM solution in the Tris buffer was titrated with increasing amounts of M.EcoKI. Excitation was at 342 nm and emission intensity monitored at 379 nm with slit widths of 5.0 and 10 nm, respectively. The cuvette path lengths were 3 mm.
HPLC gel filtration
Gel filtration of M.EcoKI, ocr and 1:1 complexes of ocr and M.EcoKI were performed under conditions and with buffer solutions as described (18). The chromatography column was calibrated with a range of proteins at several different protein concentrations down to 10 nM. No dependence of elution time upon concentration was observed for the standards. A concentrated stock of each protein or protein mixture was diluted to the appropriate concentration immediately prior to injection onto the column.
RESULTS
Isothermal titration calorimetry data showing 1:1 binding to M.EcoKI
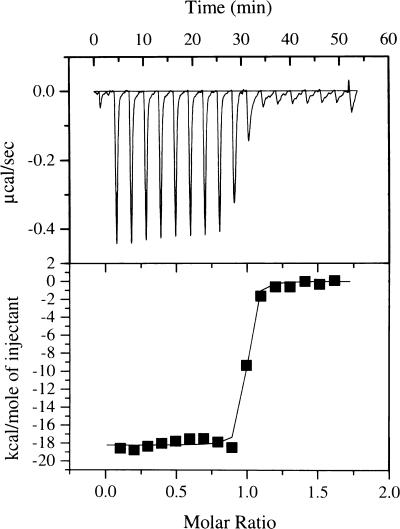
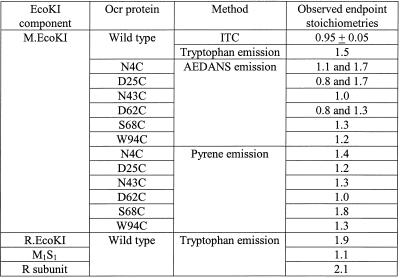
Figure 2 shows a typical ITC measurement of the heat of binding of ocr to M.EcoKI. The reaction was exothermic and each addition of ocr lowered the amount of heat released until M.EcoKI was saturated. After integration of each injection peak and subtraction of the heats of dilution, the values of the heat of interaction normalised for ocr concentration were plotted versus the molar ratio of ocr to M.EcoKI. These experimental data were fitted to a theoretical titration curve to determine the enthalpy of reaction, ΔH, and the number of binding sites, n. The interaction between ocr and M.EcoKI is very strong and exhibits essentially stoichiometric binding in the concentration range used in the ITC experiment. Therefore, the binding affinity cannot be determined. The stoichiometry of binding was 0.95 ± 0.05 ocr dimer molecules per M.EcoKI molecule. The reaction was exothermic under the conditions used with a ΔH of –76.3 ± 0.8 kJ mol–1.
Figure 2.
ITC titration curve for the addition of ocr to M.EcoKI (upper). The lower panel shows the calorimetric binding isotherm for the ocr–M.EcoKI system. The x-axis in both panels shows the molar ratio of ocr to M.EcoKI. The theoretical fit in the lower panel is for a ΔH of –76.3 kJ mol–1 and 0.95 ocr dimers per M.EcoKI.
Stoichiometry of binding of labelled mutants to M.EcoKI observed by extrinsic fluorescence
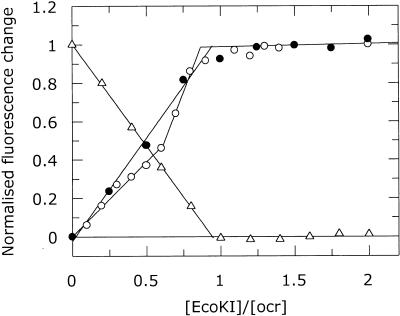
Upon titration of the labelled ocr protein with M.EcoKI, the fluorescence intensity of the fluorescent label changed. After correction for dilution, a plot of intensity against the molar ratio [M.EcoKI]/[labelled ocr] showed stoichiometric binding for each different labelled ocr protein (Fig. 3 and Table 1). The fluorescence emission intensity increased for all of the labelled proteins except for ocr(D62C) when labelled with pyrene, which showed a decrease. While all of the titrations showed an end-point at a ratio of one ocr dimer per M.EcoKI, several of the titrations with AEDANS-labelled ocr showed an extra end-point corresponding to two ocr dimers per M.EcoKI. The different titration behaviour of the fluorescent labels depending upon location on the surface of the ocr mutant protein may indicate interaction with different parts of M.EcoKI. Alternatively, since the ocr(Cys) mutant proteins contain two labelling sites, the two stoichiometries may reflect a difference between ocr molecules with one or two extrinsic labels.
Figure 3.
Typical fluorescence emission changes from ocr(Cys) mutant proteins labelled with AEDANS or PM upon titration of M.EcoKI. Ocr(N4C)–AEDANS (open circle), ocr(N43C)–AEDANS (filled circle) and ocr(D62C)–PM (open triangle). The stoichiometric end-points for these titrations are given in Table 1.
Table 1. Stoichiometry of the ocr–EcoKI interaction.
 |
Stoichiometry of binding to M.EcoKI using intrinsic fluorescence
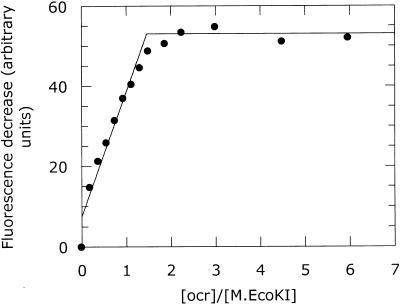
Wild-type ocr contains only one tryptophan residue at position 94 in each monomer (22). Fluorescence spectroscopy and X-ray crystallography indicate that Trp94 is located on the surface of ocr (1,7). EcoKI contains multiple tryptophan residues and displays an emission maximum around 340 nm (16). The addition of ocr to a solution of M.EcoKI causes an increase in total emission intensity from tryptophan. However, this increase is less than expected by merely adding the intensity of M.EcoKI and ocr together. This quenching effect can be attributed to the interaction between the two proteins affecting the environment of some of the tryptophan side chains and reducing their contribution to the total emission. A graph of the difference between the sum of the individual intensities of ocr and M.EcoKI at 340 nm and the observed fluorescence intensity of the ocr–M.EcoKI mixture plotted against the molar ratio [ocr]/[M.EcoKI] once again shows saturation behaviour (Fig. 4). The stoichiometry of the ocr–M.EcoKI complex by this method is 1.5 ocr dimers per M.EcoKI. This non-integral ratio is unexpected and may be a reflection of the fact that M.EcoKI can dissociate into an M1S1 dimer and an M subunit with a dissociation constant of 97 nM (see below). Both of these fragments of M.EcoKI can bind ocr, as described later.
Figure 4.
Change in tryptophan emission intensity at 340 nm for the titration of M.EcoKI with ocr. The change in fluorescence is calculated from the sum of the fluorescence of the individual components minus the fluorescence observed from the mixture of the components. The stoichiometric end-point for this titration is given in Table 1.
Binding affinity of ocr and M.EcoKI and R.EcoKI
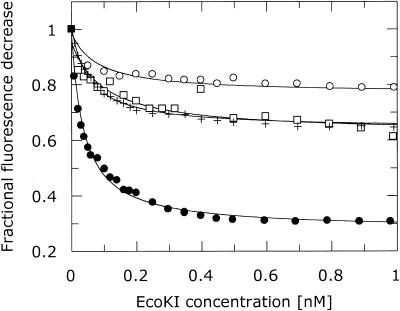
The measurements of binding of ocr to M.EcoKI described above were performed at concentrations considerably greater than the dissociation constant for binding of ocr to M.EcoKI. This constant was estimated as being at least 100 pM (7) but the fluorescence anisotropy method used was at the limits of its sensitivity. The strong extinction coefficient and high quantum yield of fluorescein make it a suitable probe for determining the dissociation constant for binding of ocr to EcoKI in the low concentration regime required to examine this tight binding inhibitor although, as usual, one has to assume that the probe does not alter the interaction between the two proteins. Ocr(N43C) and ocr(S68C) were labelled with fluorescein and titrated with M.EcoKI or R.EcoKI. The fluorescence emission intensity of the fluorescein label decreased as EcoKI was added (Fig. 5). This decrease was fitted to a ligand binding curve to give dissociation constants. The titration of labelled ocr(N43C) gave dissociation constants of 39 ± 3 and 53 ± 4 pM for M.EcoKI and R.EcoKI, respectively. Labelled ocr(S68C) protein gave dissociation constants of 79 ± 12 and 99 ± 24 pM for M.EcoKI and R.EcoKI, respectively. The different locations of the fluorescein label and differences between different labelling reactions may account for the different dissociation constants observed. These dissociation constants are 20- to 100-fold lower than for the binding of EcoKI to DNA (23,24), indicating a strong preference for EcoKI to bind to ocr rather than DNA, and they may still be overestimates of the true dissociation constants as the extrinsic label may interfere with the binding interaction. The 39 pM dissociation constant obtained from the M.EcoKI titration experiment was used to calculate the Gibbs free energy (ΔG) from the equation ΔG = RTlnKd, where R is the gas constant and T is the temperature in Kelvin. The value obtained for ΔG was –59.4 kJ mol–1. The Gibbs free energy is also expressed as ΔG = ΔH – TΔS and using the value of ΔH of –76.3 kJ mol–1 from the calorimetry experiment, one can calculate that ΔS is –56.7 J mol–1 K–1. Enthalpy contributes favourably to the Gibbs free energy while the contribution of entropy is unfavourable at 25°C.
Figure 5.
Binding of M.EcoKI and R.EcoKI to fluorescein-labelled forms of ocr(N43C) and ocr(S68C) quenches the fluorescence of the label. Ocr(N43C) with M.EcoKI (filled circle) and R.EcoKI (cross) and ocr(S68C) with M.EcoKI (open circle) and R.EcoKI (open square).
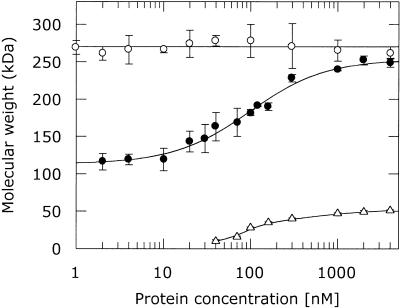
The association of native ocr with M.EcoKI was further investigated using gel filtration chromatography. It was previously observed that M.EcoKI dissociated at low protein concentration during the gel filtration process with a dissociation constant estimated to lie between 15 and 80 nM (18). Figure 6 shows the change in elution volume of M.EcoKI as a function of concentration using tryptophan fluorescence for detection. This is more sensitive than the absorption method used previously and allows an upper limit for the Kd of 97 ± 9 nM to be determined. Ocr, in common with M.EcoKI, has unusual elution behaviour on the gel filtration column, appearing to be considerably larger than a dimer. However, equilibrium analytical ultracentrifugation (7) and dynamic light scattering (8) showed that ocr is a dimer in this concentration range so the unusual gel filtration behaviour must be due to the elongated shape of the ocr dimer rather than some aggregation to form larger species. The behaviour of a 1:1 mixture of M.EcoKI and ocr dimer during gel filtration is also shown in Figure 6. It is apparent that the ocr–M.EcoKI complex does not dissociate during the gel filtration process at any detectable protein concentration. Thus ocr stabilises the trimeric structure of M.EcoKI. This experiment further indicates that once ocr is bound, it remains bound to M.EcoKI for periods significantly longer than the 15 min duration of the gel filtration experiments. Therefore, the association between ocr and M.EcoKI must be very rapid given the high binding affinity and slow dissociation rate for the complex. This behaviour has been observed for other strong protein–protein associations (see for example 25,26).
Figure 6.
HPLC gel filtration of M.EcoKI (filled circle), ocr (open triangle) and complexes of ocr with M.EcoKI (open circle). The observed elution volumes have been converted to apparent molecular weight using a calibration curve. It is apparent that M.EcoKI dissociates with an apparent dissociation constant of 97 nM and that the addition of ocr prevents this process.
Ocr–M.EcoKI interface
The titration of fluorescently labelled ocr mutant proteins showed a change in fluorescence intensity upon interacting with the M.EcoKI irrespective of the location of the labelling site. Furthermore, the titration of the AEDANS-labelled ocr also showed that the emission spectrum of AEDANS shifted to a lower wavelength when the ocr was saturated with M.EcoKI (data not shown). A shift to lower wavelengths would imply a less aqueous environment for the label. This change in solvation could arise if all six labelling locations are at the binding interface between ocr and M.EcoKI or if these sites change conformation when the M.EcoKI binds elsewhere on ocr. Similar changes were noticed when ocr labelled with pyrene was titrated with M.EcoKI (data not shown).
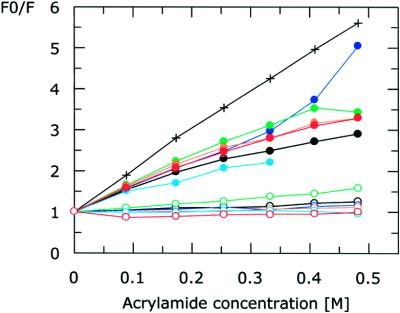
Fluorescence quenching was used to determine whether the labelling sites were in the M.EcoKI–ocr interface or merely affected by some long-range conformational change. Acryl amide, a polar uncharged, electron-deficient molecule efficiently quenches the AEDANS fluorophore when in direct contact with it (Fig. 7). It was observed that acrylamide was able to quench the AEDANS emission from all six labelled forms of ocr only in the absence of saturating amounts of M.EcoKI (Fig. 7). The simplest interpretation of this result is that all six labelling sites on each ocr monomer are part of the interface with M.EcoKI. The labelling sites are dispersed all over the ocr surface thus it is extremely unlikely that M.EcoKI binding causes a conformational change in ocr that indirectly buries all six locations. This result, in conjunction with the crystal structure of ocr (1), indicates that the surface area on ocr involved in binding to M.EcoKI must be very large. These results suggest that M.EcoKI virtually engulfs ocr.
Figure 7.
Quenching of AEDANS fluorescence emission by acrylamide. Quenching of AEDANS probe (cross), quenching of AEDANS from labelled ocr(Cys) mutant proteins (filled circles) and quenching from labelled ocr(Cys) proteins in the presence of M.EcoKI (open circles). Ocr(Cys) data are coloured as follows: ocr(N4C), black; ocr(D25C), red; ocr(N43C), orange; ocr(D62C), green; ocr(S68C), cyan; ocr(W94C), blue.
Interaction of ocr with other components of EcoKI
The interaction of ocr with other components of the EcoKI R/M system was also examined. These components were the M subunit, the M1S1 dimer and the R subunit, all of which are inactive, and the complete restriction enzyme R.EcoKI (R2M2S1).
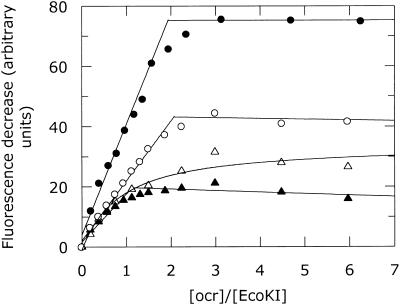
Binding of ocr to the complete R.EcoKI nuclease was examined using the change in total tryptophan fluorescence for wild-type R.EcoKI and ocr. This titration indicated a stoichiometry of 1.9 ocr dimers per R.EcoKI (Fig. 8). The same stoichiometry was also observed using pyrene-labelled ocr(D25C) in a titration with R.EcoKI (data not shown). We conclude that two ocr dimers can bind tightly to a single R.EcoKI enzyme.
Figure 8.
Change in tryptophan emission intensity at 340 nm upon the addition of ocr to R.EcoKI (filled circle), R subunit (open circle), M1S1 (filled triangle) and M subunit (open triangle). The change in fluorescence is calculated from the sum of the fluorescence of the individual components minus the fluorescence observed from the mixture of the components. The intensity change for R.EcoKI has been scaled by one-third. The stoichiometric end-points for these titrations are given in Table 1.
The change in tryptophan fluorescence was also used as a probe of the interaction of ocr with partially assembled forms of the EcoKI enzyme (Fig. 8). Only weak binding of native ocr to the M subunit alone was observed and a stoichiometry was not clear. The dissociation constant for the interaction between ocr and the M subunit was determined to be 234 ± 69 nM. The M1S1 dimer was able to bind tightly to ocr and showed a stoichiometry of 1.1 ocr dimer per M1S1. Surprisingly, we also found that ocr bound tightly to the R subunit of the EcoKI R/M system. It appears that saturation is reached when two ocr dimers are bound to a single R subunit.
DISCUSSION
Ocr binding to M.EcoKI
Our experiments show a strong 1:1 interaction between ocr and M.EcoKI and we believe that the primary mode of binding is one ocr dimer per M.EcoKI. Although there are other modes of binding between ocr and EcoKI, as discussed later, it is of particular importance that the calorimetric titration shows only one binding site as this method provides the most direct determination of the interaction stoichiometry. Calorimetry avoids the uncertainties associated with the use of fluorescence where the experimental observable may result from multiple tryptophan residues within the proteins or from extrinsic labels which may have altered the protein conformation. The 1:1 ratio of ocr dimer to M.EcoKI was also observed using the extrinsic fluorescence from AEDANS-labelled ocr(S68C) and ocr(N43C) and pyrene-labelled ocr(N4C), ocr(D25C), ocr(N43C), ocr(D62C) and ocr(W94C). The slight deviations of these fluorescence measurements from the 1:1 ratio observed in the ITC experiment can be attributed to experimental error in the calculation of the protein concentrations caused by interfering absorption from the labels at 280 nm.
This 1:1 binding of ocr to M.EcoKI has a very favourable free energy change, even greater than that observed between DNA and M.EcoKI, and is strongly exothermic. Given the coverage of the ocr surface with negative charges to mimic the arrangement of phosphates on DNA, the negative enthalpy change is presumably the result of the formation of numerous electrostatic interactions between ocr and M.EcoKI plus further contributions from hydrogen bonding and non-polar contacts. The electrostatic interactions between M.EcoKI and the ocr DNA mimic will be considerable as each monomer of ocr mimics 11 phosphate groups on B-DNA. These interactions may be optimal for the formation of the ocr–M.EcoKI complex as found for the complex between the RNase barnase and its inhibitor barstar (26,27). Unfavourable enthalpy contributions due to the introduction of DNA bending by M.EcoKI, as observed by atomic force microscopy (1), are avoided in the formation of the ocr–M.EcoKI complex as ocr is already bent to an appropriate angle to facilitate M.EcoKI binding. It is likely that most of the free energy difference between M.EcoKI binding to DNA and binding to ocr is due to the enthalpic penalty of bending the DNA substrate. The entropy change in forming the M.EcoKI–ocr complex is unfavourable and such a change is usually attributed to the loss of translational and rotational freedom of the macromolecules, trapping of solvent molecules within the interface between the macromolecules, and the introduction of additional constraints on the conformational dynamics and folding of the macromolecules (28). The magnitude of these contributions to the entropy change are the subject of considerable discussion (see for example 29,30). However, the constraints on flexibility and folding and hence the entropy of the ocr–M.EcoKI complex are likely to be significant as large conformational changes in the average structure of type I methyltransferases (31), with concomitant decreases in flexibility, have been observed upon binding of DNA.
However, as mentioned earlier, it is apparent that the interaction between EcoKI and ocr is more complex than a simple 1:1 complex in which the inhibitor blocks the site on EcoKI which would normally bind to the DNA target sequence. A subset of our titrations show that a second ocr dimer can bind to M.EcoKI. This secondary site appears to be of high affinity as clear saturation points for the site appear in some of the fluorescence titrations. This second site is most clearly observed for the ocr(N4C), ocr(D25C) and ocr(D62C) proteins when labelled with AEDANS and for ocr(S68C) when labelled with pyrene. It is likely that the label subtly alters the nature of the interaction between EcoKI and the ocr protein. A stoichiometry of 1.5 ocr per M.EcoKI is also seen when observing the combined tryptophan fluorescence from both ocr and M.EcoKI. However, as mentioned earlier, one might expect such a titration to show a non-integral ratio of ocr to M.EcoKI, firstly because M.EcoKI can dissociate into components each of which binds ocr differently, and secondly as the total number of tryptophan residues in M.EcoKI and ocr is considerable, the signal observed is a composite of many different fluorescent signals. We conclude that this secondary binding site for ocr on M.EcoKI is different in character from the one detected by calorimetry and at least partly reliant upon some change induced in the ocr molecule by the extrinsic label.
Interaction of ocr with other components of EcoKI
The interaction of ocr with other components of EcoKI shows that one dimer can bind to M1S1, two dimers bind to the R subunit and two dimers bind to the complete R.EcoKI enzyme. If one ocr dimer binds per M.EcoKI and two ocr dimers per R subunit, then one might expect five dimers to bind to the complete R.EcoKI enzyme. This is not observed and we conclude that the multiple binding sites presented by the M.EcoKI and R subunits must partially occlude each other in the complete enzyme. The observation of strong binding of ocr by the R subunit is noteworthy. M.EcoKI alone has a preference for binding to its DNA target sequence rather than to a random DNA sequence (23,24). However, in the absence of cofactors, the complete enzyme binds strongly to all DNA sequences and this was attributed to the interaction of the R subunits with DNA (32). It appears that ocr targets not only the sequence-specific binding capability of the M.EcoKI core protein but also the non-sequence-specific DNA binding capability of the R subunit.
Structural implications
Using the superimposition of ocr and DNA shown in Figure 1 and an earlier model of M.EcoKI bound to DNA (33), a model of the M.EcoKI–ocr complex can be constructed by the following procedure: (i) determine the correspondence of nucleotides in Figure 1 with the nucleotides in the target site sequence of EcoKI; (ii) superimpose the DNA from Figure 1 with the DNA from the M.EcoKI:DNA model; (iii) replace the DNA from Figure 1 with the ocr structure and remove the DNA from the M.EcoKI model. This then leaves ocr bound to M.EcoKI. The nature of type I DNA recognition sequences, described below, allows further simplification as we have to consider only one ocr monomer and one DNA dodecamer from Figure 1 and half of the M.EcoKI–DNA model.
In common with all type I R/M enzymes, EcoKI methylates two adenine bases on complementary DNA strands within a bipartite recognition sequence. The recognition sequence for EcoKI is 5′-AACNNNNNNGTGC-3′ (methylation locations underlined). The two adenine bases targeted for methylation by EcoKI are separated by an intervening 8 bp. From Figure 1, it is apparent that an extra 2 bp of DNA can be placed between the two dodecamer duplexes to form a continuous stretch of double-stranded DNA. The insertion of these 2 bp requires the introduction of considerable distortion to maintain the 5′→3′ continuity of each strand of DNA, however, this might be expected as it is known that EcoKI introduces a sharp kink into its DNA target (1). These extra 2 bp would correspond to the central 2 bp in the middle of the EcoKI recognition sequence. This aligns the bases of the DNA in Figure 1 with the EcoKI recognition sequence but the strand polarity is not yet fixed. However, it is known that sequence recognition by EcoKI requires the S subunit to approach the major groove of the DNA (34). A model of DNA bound to the first target recognition domain (TRD) within the S subunit, which is responsible for recognising the AAC part of the EcoKI target, has been proposed (35) and validated by extensive mutagenesis (36,37). The only orientation which gives the correct placement of major and minor grooves for the DNA in Figure 1 and the DNA in the model of the TRD (35) has the C9 in the dodecamer, which overlaps with D92 of ocr, corresponding to the methylatable adenine in the EcoKI target. This produces the alignment shown in Figure 9. This alignment indicates that ocr is primarily a mimic of DNA outside the recognition sequence of EcoKI and would explain the ability of ocr to inhibit type I enzymes with different recognition sequences (1). Given this alignment, one can then replace the DNA from Figure 1 with the ocr protein, remove the DNA from the model of the TRD and thereby derive a model of ocr against the TRD. As in earlier models (33,38,39), the catalytic domain of the M subunit can then be placed next to the TRD to form an approximate model of part of EcoKI bound to ocr (Fig. 10). The models of the TRD and catalytic domain can be superimposed upon each monomer of ocr to produce a more complete model of M.EcoKI but this elaboration is not necessary to assist with the interpretation of the fluorescence quenching experiments shown in Figure 7.
Figure 9.
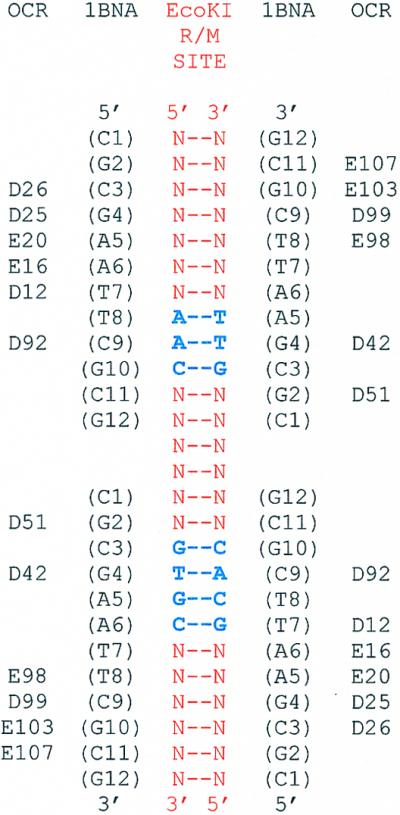
Alignment of ocr with the EcoKI DNA target. The EcoKI target is shown in bold blue letters within a red non-specific sequence. The amino acids in ocr are shown aligned with the nucleic acid sequence of the DNA strands shown in Figure 1 as defined in Walkinshaw et al. (1). The sequence of the DNA strands which are aligned with ocr is taken from the crystal structure 1BNA (42). The ocr and 1BNA sequences are aligned with the EcoKI sequence.
Figure 10.
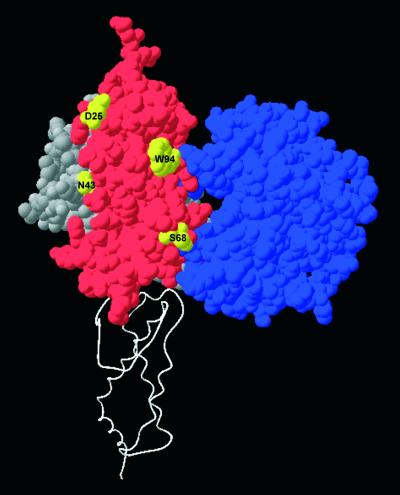
The target recognition domain of the S subunit, which binds to the DNA target sequence AAC (34), and the catalytic domain of the M subunit, which recognises the methylation state of this target, are shown in grey and blue space-filling representations, respectively. The ocr monomer shown in red is placed onto this partial model of EcoKI guided by the superimposition of DNA molecules derived from Figure 9. The second ocr monomer is shown as a white ribbon to define the orientation of ocr and EcoKI. Highlighted in yellow on the ocr monomer are mutation sites not covered by the modelled domains of EcoKI. These locations must be covered by other parts of EcoKI to explain the protection from acrylamide quenching when EcoKI is bound to ocr.
The physical location of the six sites of protein labelling on ocr are well dispersed over the 11 238 Å2 surface area of ocr (1). The inability to quench the fluorescence of labels attached to these locations in the presence of M.EcoKI (Fig. 7) indicates that the interface between ocr and M.EcoKI must be substantial. The burial of such a large surface area of ocr upon interaction with M.EcoKI would be unusual for a protein– protein interface but not without precedent (40,41). Large interfaces typically require substantial conformational changes as observed for the binding of type I methyltransferases to DNA (32). If one highlights the location of the six mutation sites on ocr (Fig. 10) one can see that N43 is partially covered by the TRD and catalytic domains, N4 and D62 are completely covered and D25, S68 and W94 are not covered at all. This implies that other parts of the methyltransferase must cover these exposed locations on ocr to effectively prevent the quenching of fluorescent probes at these locations. The N- and C-terminal parts of the M subunits would seem to be the most likely parts of the methyltransferase to cover these exposed residues on ocr as these are the largest parts of the methyltransferase for which we possess no structural information.
This work provides a foundation for further analysis of the thermodynamic, kinetic and structural basis for the extraordinary ability of ocr to mimic DNA and thereby inactivate an entire class of DNA restriction and modification systems.
Acknowledgments
ACKNOWLEDGEMENTS
We are very grateful to Malcolm Walkinshaw and Paul Taylor (Institute of Cell and Molecular Biology, University of Edinburgh) for their collaboration on this project. This work was supported by the Leverhulme Trust (grant F/158/BC), the Royal Society and the EPSRC (grant GR/19748). D.T.F.D. thanks the Royal Society for a University Research Fellowship and C.A. thanks the Darwin Trust for a postgraduate studentship. Calorimetry was performed at Glasgow Universities BBSRC/EPSRC Biological Microcalorimetry Facility.
REFERENCES
- 1.Walkinshaw M.D., Taylor,P., Sturrock,S.S., Atanasiu,C., Berge,T., Henderson,R.M., Edwardson,J.M. and Dryden,D.T.F. (2002) Structure of Ocr from bacteriophage T7, a protein that mimics B-form DNA. Mol. Cell, 9, 187–194. [DOI] [PubMed] [Google Scholar]
- 2.Kruger D.H. and Bickle,T.A. (1983) Bacteriophage survival: multiple mechanisms for avoiding the deoxyribonucleic acid restriction systems of their hosts. Microbiol. Rev., 47, 345–360. [DOI] [PMC free article] [PubMed] [Google Scholar]
- 3.Bickle T.A. and Kruger,D.H. (1993) Biology of DNA restriction. Microbiol. Rev., 57, 434–450. [DOI] [PMC free article] [PubMed] [Google Scholar]
- 4.Zavilgelsky G.B. (2000) Antirestriction. Mol. Biol. (Mosk.), 34, 854–862. [PubMed] [Google Scholar]
- 5.Studier F.W. (1975) Gene 0.3 of bacteriophage T7 acts to overcome the DNA restriction system of the host. J. Mol. Biol., 94, 283–295. [DOI] [PubMed] [Google Scholar]
- 6.Mark K.-K. and Studier,F.W. (1981) Purification of the gene 0.3 protein of bacteriophage T7, an inhibitor of the DNA restriction system of Escherichia coli. J. Biol. Chem., 256, 2573–2578. [PubMed] [Google Scholar]
- 7.Atanasiu C., Byron,O., McMiken,H., Sturrock,S.S. and Dryden,D.T.F. (2001) Characterisation of the structure of ocr, the gene 0.3 protein of bacteriophage T7. Nucleic Acids Res., 29, 3059–3068. [DOI] [PMC free article] [PubMed] [Google Scholar]
- 8.Blackstock J.J., Egelhaaf,S.U., Atanasiu,C., Dryden,D.T.F. and Poon,W.C.K. (2001) Shape of ocr, the gene 0.3 protein of bacteriophage T7: modeling based on light scattering experiments. Biochemistry, 40, 9944–9949. [DOI] [PubMed] [Google Scholar]
- 9.Dryden D.T.F. (1999) Bacterial DNA methyltransferases. In Cheng,X. and Blumenthal,R.M. (eds), S-Adenosylmethionine-dependent Methyltransferases: Structures and Functions. World Scientific Publishing, Singapore, pp. 283–340.
- 10.Murray N.E. (2000) Type I restriction systems: sophisticated molecular machines. Microbiol. Mol. Biol. Rev., 64, 412–434. [DOI] [PMC free article] [PubMed] [Google Scholar]
- 11.Dryden D.T.F., Murray,N.E. and Rao,D.N. (2001) Nucleoside triphosphate-dependent restriction enzymes. Nucleic Acids Res., 29, 3728–3741. [DOI] [PMC free article] [PubMed] [Google Scholar]
- 12.Titheradge A.J.B., King,J., Ryu,J. and Murray,N.E. (2001) Families of restriction enzymes: an analysis prompted by molecular and genetic data for type ID restriction and modification systems. Nucleic Acids Res., 29, 4195–4205. [DOI] [PMC free article] [PubMed] [Google Scholar]
- 13.Kruger D.H., Schroeder,C., Hansen,S. and Rosenthal,H.A. (1977) Active protection by bacteriophages T3 and T7 against E.coli B- and K-specific restriction of their DNA. Mol. Gen. Genet., 153, 99–106. [DOI] [PubMed] [Google Scholar]
- 14.Kruger D.H., Hansen,S. and Reuter,M. (1983) The ocr+ gene function of bacteriophages T3 and T7 counteracts the Salmonella typhimurium DNA restriction systems SA and SB. J. Virol., 45, 1147–1149. [DOI] [PMC free article] [PubMed] [Google Scholar]
- 15.Bandyopadhay P.K., Studier,F.W., Hamilton,D.L. and Yuan,R. (1985) Inhibition of the type I restriction-modification enzymes EcoB and EcoK by the gene 0.3 protein of bacteriophage T7. J. Mol. Biol., 182, 567–578. [DOI] [PubMed] [Google Scholar]
- 16.Dryden D.T.F., Cooper,L.P. and Murray,N.E. (1993) Purification and characterization of the methyltransferase from the Type I restriction and modification system of Escherichia coli K12. J. Biol. Chem., 268, 13228–13236. [PubMed] [Google Scholar]
- 17.Davies G.P., Martin,I., Sturrock,S.S., Cronshaw,A., Murray,N.E. and Dryden,D.T.F. (1999) On the structure and operation of type I DNA restriction enzymes. J. Mol. Biol., 290, 565–579. [DOI] [PubMed] [Google Scholar]
- 18.Dryden D.T.F., Cooper,L.P., Thorpe,P.H. and Byron,O. (1997) The in vitro assembly of the EcoKI type I DNA restriction/modification enzyme and its in vivo implications. Biochemistry, 36, 1065–1076. [DOI] [PubMed] [Google Scholar]
- 19.Hudson E.N. and Weber,G. (1973) Synthesis and characterization of two fluorescent sulfhydryl reagents. Biochemistry, 12, 4154–4161. [DOI] [PubMed] [Google Scholar]
- 20.Strasburg G.M., Leavis,P.C. and Gergely,J. (1985) Troponin-C-mediated calcium-sensitive changes in the conformation of troponin I detected by pyrene excimer fluorescence. J. Biol. Chem., 260, 366–370. [PubMed] [Google Scholar]
- 21.Wu C.W., Yarbrough,L.R. and Wu,F.Y.H. (1976) N-(1-pyrene)maleimide: a fluorescent cross-linking reagent. Biochemistry, 15, 2863–2868. [DOI] [PubMed] [Google Scholar]
- 22.Dunn J.J., Elzinga,M., Mark,K.K. and Studier,F.W. (1981) Amino acid sequence of the gene 0.3 protein of bacteriophage T7 and nucleotide sequence of its messenger RNA. J. Biol. Chem., 256, 2579–2585. [PubMed] [Google Scholar]
- 23.Powell L.M., Dryden,D.T.F., Willcock,D.F., Pain,R.H. and Murray,N.E. (1993) DNA recognition by the EcoK methyltransferase. The influence of DNA methylation and the cofactor S-adenosyl-L-methionine. J. Mol. Biol., 234, 60–71. [DOI] [PubMed] [Google Scholar]
- 24.Powell L.M., Connolly,B.A. and Dryden,D.T.F. (1998) The DNA binding characteristics of the trimeric EcoKI methyltransferase and its partially assembled dimeric form determined by fluorescence polarization and DNA footprint. J. Mol. Biol., 283, 947–961. [DOI] [PubMed] [Google Scholar]
- 25.Bennett S.E., Schimerlik,M.I. and Mosbaugh,D.W. (1993) Kinetics of the uracil-DNA glycosylase/inhibitor protein association. Ung interaction with Ugi, nucleic acids and uracil compounds. J. Biol. Chem., 268, 26879–26885. [PubMed] [Google Scholar]
- 26.Schreiber G. and Fersht,A.R. (1996) Rapid, electrostatically assisted association of proteins. Nature Struct. Biol., 3, 427–431. [DOI] [PubMed] [Google Scholar]
- 27.Lee L.P. and Tidor,B. (2001) Barstar is electrostatically optimized for tight binding to barnase. Nature Struct. Biol., 8, 73–76. [DOI] [PubMed] [Google Scholar]
- 28.Sturtevant J.M. (1977) Heat capacity and entropy changes in processes involving proteins. Proc. Natl Acad. Sci. USA, 74, 2236–2240. [DOI] [PMC free article] [PubMed] [Google Scholar]
- 29.Janin J. (1995) Protein-protein recognition. Prog. Biophys. Mol. Biol., 64, 145–166. [DOI] [PubMed] [Google Scholar]
- 30.Cooper A. (1999) Thermodynamic analysis of biomolecular interactions. Curr. Opin. Chem. Biol., 3, 557–563. [DOI] [PubMed] [Google Scholar]
- 31.Taylor I.A., Davis,K.G., Watts,D. and Kneale,G.G. (1994) DNA binding induces a major structural transition in a type I methyltransferase. EMBO J., 13, 5772–5778. [DOI] [PMC free article] [PubMed] [Google Scholar]
- 32.Powell L.M., Dryden,D.T.F. and Murray,N.E. (1998) Sequence-specific DNA binding by EcoKI, a type IA DNA restriction enzyme. J. Mol. Biol., 283, 963–976. [DOI] [PubMed] [Google Scholar]
- 33.Dryden D.T.F., Sturrock,S.S. and Winter,M. (1995) Structural modelling of a type I DNA methyltransferase. Nature Struct. Biol., 2, 632–635. [DOI] [PubMed] [Google Scholar]
- 34.Chen A., Powell,L.M., Dryden,D.T.F., Murray,N.E. and Brown,T. (1995) Tyrosine 27 of the specificity polypeptide of EcoKI can be UV crosslinked to a bromodeoxyuridine-substituted DNA target sequence. Nucleic Acids Res., 23, 1177–1183. [DOI] [PMC free article] [PubMed] [Google Scholar]
- 35.Sturrock S.S. and Dryden,D.T.F. (1997) A prediction of the amino acids and structures involved in DNA recognition by type I DNA restriction and modification enzymes. Nucleic Acids Res., 25, 3408–3414. [DOI] [PMC free article] [PubMed] [Google Scholar]
- 36.O’Neill M., Dryden,D.T.F. and Murray,N.E. (1998) Localization of a protein–DNA interface by random mutagenesis. EMBO J., 17, 7118–7127. [DOI] [PMC free article] [PubMed] [Google Scholar]
- 37.O’Neill M., Powell,L.M. and Murray,N.E. (2001) Target recognition by EcoKI: the recognition domain is robust and restriction-deficiency commonly results from the proteolytic control of enzyme activity. J. Mol. Biol., 307, 951–963. [DOI] [PubMed] [Google Scholar]
- 38.Burckhardt J., Weisemann,J., Hamilton,D.L. and Yuan,R. (1981) Complexes formed between the restriction endonuclease EcoK and heteroduplex DNA. J. Mol. Biol., 153, 425–440. [DOI] [PubMed] [Google Scholar]
- 39.Kneale G.G. (1994) A symmetrical model for the domain structure of Type I DNA methyltransferases. J. Mol. Biol., 243, 1–5. [DOI] [PubMed] [Google Scholar]
- 40.Xu D., Tsai,C.J. and Nussinov,R. (1997). Hydrogen bonds and salt bridges across protein–protein interfaces. Protein Eng., 10, 999–1012. [DOI] [PubMed] [Google Scholar]
- 41.Lo Conte L., Chothia,C. and Janin,J. (1999) The atomic structure of protein-protein recognition sites. J. Mol. Biol., 285, 2177–2198. [DOI] [PubMed] [Google Scholar]
- 42.Drew H.R., Wing,R.M., Takano,T., Broka,C., Tanaka,S., Itakura,K. and Dickerson,R.E. (1981) Structure of a B-DNA dodecamer: conformation and dynamics. Proc. Natl Acad. Sci. USA, 78, 2179–2183. [DOI] [PMC free article] [PubMed] [Google Scholar]


