Abstract
The homing endonuclease PI-SceI from Saccharo myces cerevisiae consists of two domains. The protein splicing domain I catalyzes the excision of the mature endonuclease (intein) from a precursor protein and the religation of the flanking amino acid sequences (exteins) to a functional protein. Furthermore, domain I is involved in binding and recognition of the specific DNA substrate. Domain II of PI-SceI, the endonuclease domain, which is structurally homologous to other homing endonucleases from the LAGLIDADG family, harbors the endonucleolytic center of PI-SceI, which in vivo initiates the homing process by introducing a double-strand cut in the ∼35 bp recognition sequence. At 1.35 Å resolution, the crystal structure of PI-SceI domain I provides a detailed view of the part of the protein that is responsible for tight and specific DNA binding. A geometry-based docking of the 75° bent recognition sequence to the full-length protein implies a conformational change or hinge movement of a subdomain of domain I, the tongs part, that is predicted to reach into the major groove near base pairs +16 to +18.
INTRODUCTION
PI-SceI from Saccharomyces cerevisiae belongs to the group of intein-encoded homing endonucleases (for reviews see 1–4). The enzyme is a two domain protein of 454 amino acids that is capable of catalyzing a protein splicing reaction and the specific cleavage of substrate DNA (5,6). Domain I, the protein splicing domain, catalyzes the excision of the homing endonuclease from the primary translation product of the VMA1 gene to yield PI-SceI (the intein) and a subunit of the vacuolar membrane H+-ATPase, VMA (the extein). Domain II, the endonuclease domain, cleaves the DNA at a specific site within the VMA1 locus that is deficient in the vde gene. The vde gene is subsequently inserted by a double-strand break repair process known as ‘homing’ (4,7).
The crystal structure of PI-SceI was first solved by Duan et al. (PDB code 1vde) (8) and in a different space group by the same group (PDB code 1dfa) (9). To understand the splicing reaction, Poland et al. (10) (PDB code 1ef0) and Mizutani et al. (11) (PDB code 1JVA) solved the structure with additional extein residues on both termini. However, in no case was structure determination of the protein–DNA complex successful.
DNA binding of PI-SceI shows many interesting features. With ≥31 bp, the specific recognition sequence is one of the longest known. In addition, it was found that most of the DNA binding energy comes from interactions with domain I, the splicing domain, whereas domain II contains the active center of the endonuclease, but binds the DNA only weakly and non-specifically as an isolated domain (12–14). To cover the whole protein, the bound DNA needs to bend and this is thought to occur in a two-step process. It is believed that in the initial complex, the ‘lower complex’ (this name has been derived from gel retardation assays), the recognition sequence from base pair +5 to +21 binds to domain I tightly (15). The DNA has a bend of 40–45°, which might reinforce an intrinsic bend. In the ‘upper complex’, the rest of the DNA (extending to base pair –10) binds to domain II and undergoes an additional bending to result in a total curvature of 60–75° (12,14). In this way, the cleavage sites between base pairs –3 and –2 of the bottom strand and between +2 and +3 of the top strand (see Fig. 7) come close to the endonuclease active center of domain II. Asp326, Thr341 and Lys301 are the key residues of the catalytic center that cleaves the bottom strand, Asp218, Asp229 and Lys403 are part of the catalytic center which cleaves the top strand; cleavage leads to a 4 nt single-strand overlap (12,13,16,17). The active site residues Asp218 and Asp326 are within two conserved LAGLIDADG motifs that are in one domain in the case of PI-SceI (16) but can be aligned with an r.m.s.d. of 1.53 Å (with 324 Cα atoms involved, calculated with Swiss-Pdb Viewer; 18) to the endonuclease I-CreI, where two domains contain a single LAGLIDADG motif each and combine via a two-fold symmetry to yield the same DNA-binding motif (19). The crystal structure of the I-CreI–DNA complex (PDB code 1bp7; 20) suggests how domain II of PI-SceI may interact with DNA. However, it does not explain tight DNA binding of domain I of PI-SceI, where no structural data of a DNA complex are available, neither for PI-SceI itself nor a structural homolog like the intron-encoded homing endonuclease PI-PfuI (21).
Figure 7.
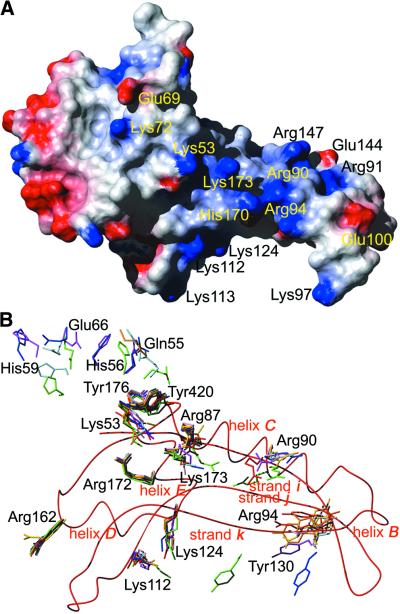
(A) Surface potential of PI-SceI domain I (1gpp). Blue represents positive charge, red represents negative charge, calculated using the program MOLMOL (49). (B) Residues important for the activity of PI-SceI after structural alignment of all atoms of 1gpp (red) with those of 1vde_A (blue), 1vde_B (light blue), 1dfa (green), 1ef0_A (magenta), 1ef0_B (pink), 1jva_A (orange) and 1jva_B (light orange). A ribbon representation of the peptide backbone of 1gpp is shown as a red line.
Many biochemical data are known which allow prediction of how DNA and PI-SceI interact, both on the protein and the DNA side. Methylation interference assays show where the protein contacts nucleobases, and ethylation interference assays where the protein contacts the DNA backbone (14). Hydroxyl radical protection and DNase I cleavage experiments show where the protein covers the recognition sequence (16,17) and photo-crosslinking experiments have identified direct contacts between amino acids and specific sites on the DNA (9,22,23). In addition, mutants of PI-SceI and mutations in the recognition sequence have helped to determine which residues and bases are important for binding and cleavage activity (13,14,17,24). Based on these data and electrostatic potential calculations several (and consistent) DNA binding models were proposed for PI-SceI (8,9,22,23).
However, most of these data concern domain II and the endonuclease activity, and relatively few data exist on DNA binding of domain I. In this work, the crystal structure of PI-SceI domain I is presented at the high maximal resolution of 1.35 Å. The initial experiment was set up to solve the co-crystal structure of the domain I–DNA complex, and many different DNA fragments covering the recognition sequence (ranging from 13mers to 24mers) were tried. Despite proven DNA binding in solution, in no case was a co-crystal observed; instead domain I crystallized very easily even with a molar excess of DNA present. The high resolution data allow a detailed view of the structure of domain I. A DNA binding model was constructed on the basis of experimentally identified contacts assuming that a flexible part of domain I undergoes large conformational changes to support strong DNA binding.
MATERIALS AND METHODS
Cloning, expression and purification
The cDNA of S.cerevisiae homing endonuclease PI-SceI domain I was cloned as described previously (15), resulting in the plasmid pHisPI-SceI-DI. The encoded protein contains 10 additional N-terminal amino acids including a His6 tag and the residues 1–182 and 411–453 that account for domain I of the full-length protein according to the crystal structure (8). Compared with the protein sequence deposited in the SWISS-PROT database (25) (PID P17255), residue Asn454 was removed to avoid protein splicing of the His6 tag and all of domain II was replaced by a single residue, Gly183. In addition, three naturally occurring variations, Arg44Ser, Val67Met and Ile132Val, are present in our construct, which are also found in the PI-SceI sequence of the DH1-1A wild yeast strain (26). The plasmid was used to transform Escherichia coli BL21(DE3) (Stratagene) cells which were grown in LB medium. Overexpression of the gene was induced with 1 mM IPTG. Cells were lysed in a French pressure cell and PI-SceI-DI was purified by Ni–NTA chromatography according to the manufacturer’s protocol (Qiagen) followed by gel filtration on a Superdex 75 column (Pharmacia). PI-SceI-DI was stored in 100 mM ammonium acetate, 50 mM sodium acetate, pH 4.7.
Crystallization, data collection and processing
Domain I of PI-SceI crystallized under a number of PEG conditions present in the Hampton Crystallization Screen (27). The crystal used for structure determination came from a crystallization attempt originally set up to produce protein– DNA co-crystals with an 18mer (the minimal binding region, base pairs +5 to +22, of the specific recognition sequence of PI-SceI). The complex solution contained a 1.05 molar excess of DNA and the final composition of the buffer was 54 mM ammonium acetate, 27 mM sodium acetate pH 4.7, 38 mM Tris–HCl pH 7.5 and 188 mM MgCl2. Crystals of size 0.4 × 0.1 × 0.1 mm were obtained by the hanging drop vapor diffusion method 2 days after mixing 2 µl of protein/DNA solution (0.35 mM) with 1 µl of reservoir solution, containing 30% PEG 4000, 0.1 M sodium citrate pH 5.6 and 0.2 M ammonium acetate at room temperature. A high resolution data set with a maximal resolution of 1.35 Å was collected at beamline BW7B at DESY, Hamburg, as well as two low resolution data sets with maximal resolutions of 2.2 and 3.0 Å. Data were processed and merged by DENZO and SCALEPACK (28).
Structure determination and refinement
Phases were obtained by the molecular replacement method using the program AMoRe (29) with the coordinates of 1vde (8). The program ARP (30) was used for an automated refinement procedure and for tracing, model building, automated side chain matching and for a water search. Further model building and refinement were done with the programs ONO (31) and REFMAC5 (32), respectively. Individual anisotropic B factors were refined and 303 solvent molecules were fitted into the electron density.
RESULTS AND DISCUSSION
Structure determination and validation
Out of 237 amino acids of the PI-SceI domain I construct (including the His6 tag) 202 were placed correctly by the program ARP (30), yielding an average confidence level of 99%. Only 15 more residues had to be positioned manually; the missing 20 residues (residues –10 to –3 of the His6 tag and loop Gln55–Glu66) were not seen in the electron density due to positional disorder. 181 (94.8%) of 191 non-glycine and non-proline residues are in the most favored region of the Ramachandran plot, the other 10 (5.2%) being in additional allowed regions. The structure was refined to final Rcryst and Rfree values of 15.0 and 18.9%, respectively. Data collection and refinement statistics are given in Table 1.
Table 1. Data collection and refinement statistics.
| Data collection | |
| Resolution (Å) | 20–1.35 (1.37–1.35) |
| Number of observations | 359 618 |
| Unique reflections | 51 602 (1141) |
| Data completeness (%) | 94.1 (64.1) |
| Average I/σ(I) | 34.5 (2.5) |
| Rmergea (%) | 2.9 (16.4) |
| Rr.i.m.b (%) | 4.1 (20.8) |
| Rp.i.m.c (%) | 2.7 (13.4) |
| Space group | C2 |
| Unit cell parameters | a = 102.9 Å |
| b = 47.6 Å | |
| c = 60.2 Å | |
| β = 121.4° | |
| Monomers in the asymmetric unit | 1 |
| Refinement | |
| Structure determination method | MR (1vde) |
| Protein atoms (non-hydrogens) | 1758 |
| Rcrystd (%) | 15.0 |
| Rfreee (%) | 18.9 |
| r.m.s.d. bond lengths (Å) | 0.018 |
| r.m.s.d. bond angles (°) | 1.83 |
| Average B factorf, all protein atoms (Å2) | 23.3 |
| Average r.m.s.d. for main chain B factorsf (Å2) | 0.83 |
| Average r.m.s.d. for side chain B factorsf (Å2) | 2.33 |
| Solvent molecules | 303 |
| Average B factorf, all solvent atoms (Å2) | 37.1 |
Values in parentheses refer to the outer resolution shell.
aRmerge = ΣhklΣi|Ii – <I>|/Σ<I>.
bRr.i.m. = Σhkl[N/(N – 1)]1/2Σi|Ii – <I>|/Σ<I>.
cRp.i.m. = Σhkl[1/(N – 1)]1/2Σi|Ii – <I>|/Σ<I>, where Ii is the intensity of the observation of reflection hkl, <I> is the average intensity of a reflection and N is the redundancy (50).
dRcryst = Σ|Fobs – Fcalc|/Σ|Fobs|.
eRfree was calculated using 7% randomly selected reflections.
fCalculated with BAVERAGE (32).
Overall structure of PI-SceI-DI
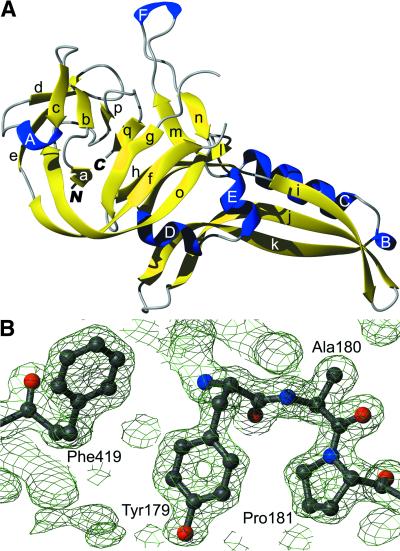
PI-SceI-DI is a 27 kDa protein that consists mainly of β-strands (51% of the observed sequence) and to a smaller extent of helices (14%). Figure 1A gives a cartoon representation of the molecule and introduces the numbering of the secondary structural elements. A total of 17 strands form six antiparallel sheets. Of them, strands a, d, e, f, g and o combine to form a twisted barrel. Of the six helices, two are α-helices (C and E) and four are of 310 type (A, B, D and F). Strands j and k together with helices B and C form a tongs-like subdomain (residues 86–154) that can be viewed separately from the core and is connected to it by a hinge-like joint. Helices D and E and strand l also might belong to that subunit. Figure 1B shows parts of the electron density and reflects the quality of the structure where, at a maximal resolution of 1.35 Å, many details can be observed. The average B factor for protein atoms of 23.0 Å2 (37.1 Å2 for solvent atoms) shows the high quality of the coordinates and the low positional flexibility of the atoms. Although not all amino acids can be observed in the electron density, this model is well defined in some regions that are not or not clearly observed in other structures (see below).
Figure 1.
(A) Ribbon model of the homing endonuclease PI-SceI, domain I (PDB code 1gpp). Strands are in yellow, helices in blue. (B) 2Fo – Fc electron density of a selected area of the protein, contoured with 1.5σ. Ball-and-stick representation of selected amino acids with oxygen atoms in red, nitrogen in blue and carbon in grey. All molecule representations were prepared with the programs MOLMOL (49) and POV-Ray (http://www.povray.org).
Domain I of PI-SceI adopts the fold of the hedgehog/intein (Hint) domain and is a member of the superfamily with the same name [classified with SCOP (33); CATH ID 2.170.16.10 (34)]. It belongs to the intein (protein splicing domain) family, other members of which are the PI-PfuI intein and the GyrA intein. The structure presented here can be aligned with these proteins as well as to the hedgehog C-terminal (Hog) autoprocessing domain, a member of the other family in that superfamily. r.m.s. deviations of the structural alignments are 2.2 Å with PI-PfuI of Pyrococcus furiosus (14% sequence identity, PDB code 1dq3; 21), 2.0 Å with GyrA of Myco bacterium xenopi (19% sequence identity, PDB code 1am2; 35) and 2.2 Å with hedgehog autoprocessing domain 17 kDa fragment of Drosophila melanogaster (13% sequence identity, PDB code 1at0; 36). These three proteins also give the only hits in a DALI search (37) with Z scores above 3 (Z scores of 13.7 for 1am2, 13.6 for 1at0 and 11.8 for 1dq3-A). However, only the core subdomain is covered by these alignments. A DALI search with only the tongs-like subdomain gives some minor hits (highest Z score 4.4) but none of the proteins found show the tongs-like element and only align with helix C and directly adjacent parts of strands i, j and k (data not shown). A similar result was obtained in the PI-PfuI structure analysis. In addition to the common core domain, there is a stirrup domain which yields no structural homologs in a DALI search (21). In contrast to PI-SceI, this stirrup domain of PI-PfuI is inserted between the protein splicing and the endonuclease domains, whereas the tongs-like structure of PI-SceI is inserted in an internal loop within the Hint domain.
Comparison of all five PI-SceI domain I structures
The overall structure of domain I is in general agreement with the four structures of domain I already published as part of the full-length protein: 1vde (8), 1dfa (9),1ef0 (10) and 1jva (11). All of these were determined at a resolution of 2 Å or lower. Thus, the 1.35 Å structure presented here provides by far the most detailed view of domain I. For this reason, modeling of DNA binding to PI-SceI-DI (see below) was based on a consensus model for the full-length protein based on this crystal structure.
Some differences between the various domain I models are observed, in part due to different protein constructs and crystal forms. Differences in secondary structure are marginal. The barrel mentioned above only closes because the additional N-terminal residues in our construct form an additional short β-sheet, which is also observed in 1jva. Equivalent sheets in 1vde are sheets 2–4 (strands β3–β7 and β24–β26). However, the additional β-sheet is also seen in 1ef0 chain B, where short parts of the original extein boundaries are present, as well as mutations of the terminal intein residues. However, a barrel is not recognized by the program PROMOTIF (38). Another small difference is that sheet 5 (strands β8, β12, β13 and β23) of 1vde appears to be split into two smaller sheets here (sheet 3 consisting of strands h and l and sheet 5 consisting of strands m and n). The additional helix F forms in 1vde where the connecting residues to domain II are and is therefore due to the protein construct.
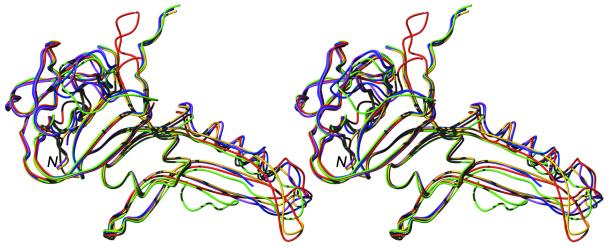
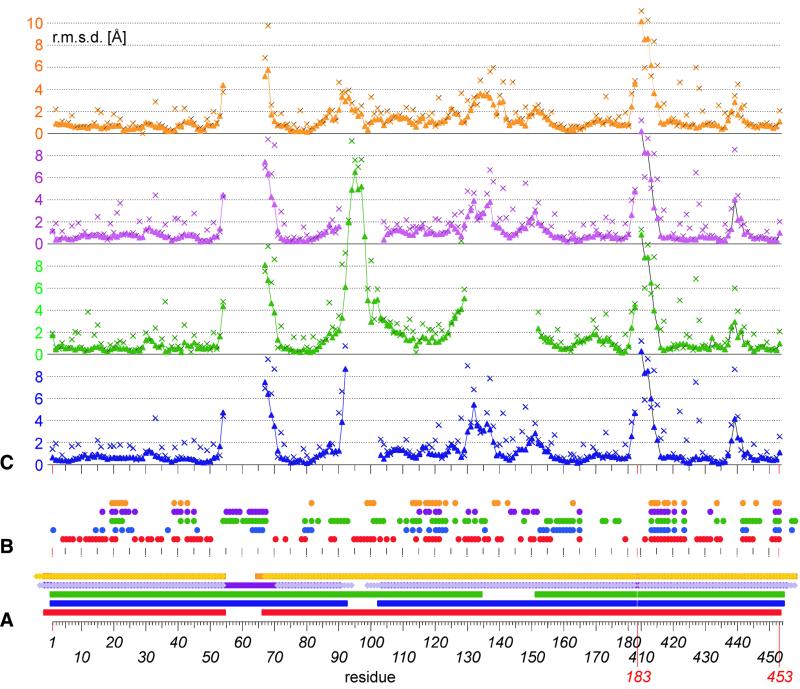
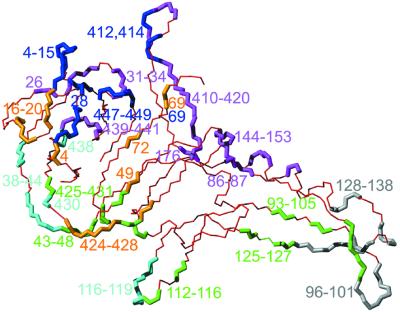
Interestingly, in none of the structures are all residues visible in the electron density, with the disordered residues being in different locations of the protein. Here, as well as in 1jva, residues Gln55–Glu66 are disordered, a loop that is well structured in 1vde. On the other hand, 1gpp (this structure) contains residues Ser93–Phe102 and Gly135–Asn151 which are absent from both 1vde and 1dfa. 1ef0, in addition, has one monomer in which the loop Arg91–Glu103 is not visible and one monomer in which residues Gln55–Leu70 and Thr95– Gly98 are not observed. Figure 2 shows a structural alignment of domain I from all five structures. Some regions show large displacements, most pronounced at the borders of the loops missing in this structure (residues 53, 54 and 67–70) as well as those missing in other structures (residues 91–102, 130–138 and 149–153) and of course residues 181–415, where in the structure presented here Gly183 replaces the entire domain II (Fig. 3A and C). This pattern is in general consistent with regions of high B factor and obviously represents the flexible loops of the structure.
Figure 2.
Stereo plot of the structural alignment of PI-SceI domain I (all atoms of residues 1–182 and 410–453). Only backbone atoms are depicted; 1gpp in red (this work), 1vde chain A in blue, 1dfa in green, 1ef0 chain A in magenta.
Figure 3.
Comparison of PI-SceI domain I residues. (A) Residues present in the crystal structure of 1gpp (red squares), 1vde chains A and B (blue squares), 1dfa (green squares), 1ef0 chain A (magenta squares), 1ef0 chain B (violet rhombuses), 1jva chain A (orange squares) and 1jva chain B (light orange rhombuses). (B) Crystal contacts of amino acids of 1gpp (red), 1vde chain A (blue), 1dfa (green), 1ef0 chain A (magenta) and 1jva chain A (orange). A filled circle is added when the respective residue has a contact surface with a symmetry-related molecule or a domain II residue in the crystal. (C) r.m.s.d. for residues of 1vde chain A (blue), 1dfa (green), 1ef0 chain A (magenta) and 1jva chain A (orange) after structural alignment with all atoms of 1gpp, shown for main chain atoms (triangles) and side chain atoms (crosses).
Two regions showing further small differences are residues 30–32 and 438–441. Both are close to each other and form a contact to helix C of the symmetry-related molecule (–x, y, –z) in 1gpp, whereas the first region has no crystal contact in any other structure and the latter contacts the loop of symmetry-related molecules of 1vde and 1dfa that is missing in 1gpp (around residue 55), domain II in 1jva and has no crystal contacts in 1ef0. Crystal contacts play a role for all structures (Fig. 3B) and are most pronounced for 1gpp, where 96 of 217 (44%) residues are involved in lattice contacts (Fig. 4) (domain I only for 1vde, 49 of 217; 1dfa, 82 of 210; 1ef0_A, 48 of 217; 1jva_A, 38 of 223). This accounts for ∼3200 Å2 of solvent-accessible surface that is covered by symmetry-related molecules (27% of the total accessible surface; calculated with NACCESS; 39).
Figure 4.
Crystal contacts of PI-SceI domain I (PDB code 1gpp). Only backbone atoms are depicted. The thin red line represents residues without crystal contacts. Thick colored lines represent residues with a contact surface to the symmetry-related molecule after symmetry operation: (–x, y, –z) in magenta, (–½+x, ½+y, z) in dark blue, (½–x, ½+y, –1–z) in orange, (½–x, 1+½+y, –1–z) in light blue, (–x, y, –1–z) in green and (½+y, 1½+y, z) in grey.
Protein splicing site
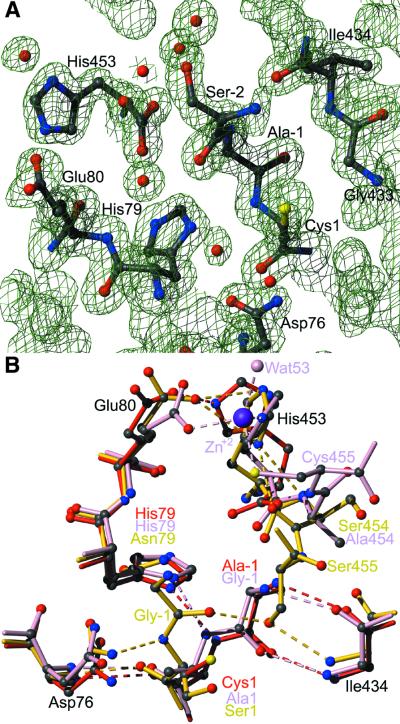
The active center of PI-SceI, where protein splicing takes place, is only partially visible in the structure. The C-terminal extein is completely missing as well as the C-terminal residue (Asn454) of the intein. The N-terminal intein is complete (with Cys1) and a part of the purification tag appears to mimic the N-terminal extein, but with changed sequence (Ala–1 and Ser–2 instead of Gly–1 and Val–2 in the natural sequence). The structure of the splice site is best compared with the structures presented by Poland et al. (1ef0; 10) and Mizutani et al. (1jva; 11), where extein residues on both sides were observed. In 1ef0, residues 1 and 454 are mutated to alanine, in 1jva to serine to prevent the splicing reaction. Additionally, 1jva contains the mutations His79→Asn and Cys455→Ser. In 1ef0, a Zn2+ ion is coordinated by His453, Cys455, Glu80 and Wat53. This is not found here (see the electron density of this site in Fig. 5A) due to the absence of residues 454 and 455. In fact the side chains of His453 and Glu80 in 1gpp are twisted compared with 1ef0, which is unique for all structures in the case of His453. However, the metal ion was described to be most likely of structural and not of functional importance.
Figure 5.
Active site of PI-SceI domain I, the protein splicing site. (A) 2Fo – Fc electron density contoured with 1.5σ. Electron density for a metal ion is not observed; Wat57 of 1gpp is not identical to Wat53 of 1ef0_A. (B) Protein splicing active center after structural alignment of all atoms of 1gpp (red), 1ef0_B (pink) and 1jva_A (yellow). Labels in black are residues identical in all three proteins; colored labels represent amino acids only present in the respective molecule. Hydrogen bonds are depicted as dashed lines; the Zn2+ ion and Wat53 belong to 1ef0 chain B.
Positioning of the exteins differs substantially but is not important for the conformation of the inteins that are structurally almost identical (Figs 2 and 5B). Residue –1 (Ala in 1gpp, Gly in 1ef0) is part of the first β-strand and forms typical β-sheet hydrogen bonds to residue Ile434 (strand o). In 1jva, on the other hand, Gly–1 and therefore the N-terminal extein is oriented towards the opposite side, fixed by a hydrogen bond between Ser1-N and Asp76-Nδ2. At the same time, Gly–1-O forms a hydrogen bond with Ser455-Oγ (Cys455 in the natural sequence). This means that the heteroatom of residue 455, the first C-terminal residue, is already in close approximation to Gly–1-C, the site of nucleophilic attack. In 1ef0_B, on the other hand, Cys455-Sγ is coordinated by Zn2+ and more than 7 Å away from the reaction center. Therefore, an inhibitory effect of Zn is likely, as already described for RecA (40). Nevertheless, the first step of the protein splicing mechanism, the N-S acyl shift as described by Noren et al. (41), can be structurally understood and confirmed. In this current model, Cys1-Sγ initiates the rearrangement by a nucleophilic attack on the carbonyl carbon of residue –1. Cys1-N, the N-terminus of the resulting intein, is stabilized by Nδ1 of the conserved His79 by a hydrogen bond.
DNA binding
How DNA is bound by PI-SceI is largely unclear, since no structure of a complex is available yet. Although PI-SceI and its domain I alone bind tightly to the recognition sequence, as seen in gel retardation assays (15,16) and filter binding experiments (W.Wende, unpublished data), crystal formation of the protein alone seems to be greatly favored over complex crystallization. This was observed not only in this study but also by Hu et al. (9). The observation that PI-SceI loses its endonucleolytic activity but preserves the specific binding capacity after denaturation/renaturation cycles or tryptic cleavage at position Arg277 (42) and that the isolated domains neither form a stable complex with each other nor show a supershift with DNA (15) is a hint that the arrangement of the domains with respect to each other might play an important role in the DNA binding and catalytic process. However, the protein alone seems very stable and the energy required for a conformational rearrangement (and possibly the loss of important contacts) of the domains must be compensated for by tight DNA binding.
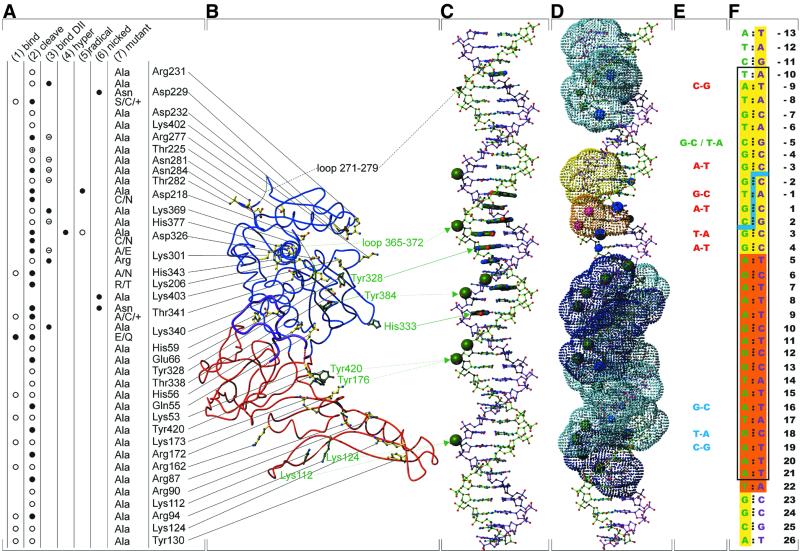
Detailed biochemical data concerning PI-SceI activity are available and are summarized in Figure 6. Mutations of protein residues and DNA base pairs (13,14,17,24), ethylation and methylation interference assays (14), hydroxyl radical protection experiments (16,17) and photo-crosslinking (9,22,23) were used to explore the activity and the DNA binding of PI-SceI. Taken together with electrostatic considerations (8), the combination of these data allowed the construction of models where the obvious protein-facing side of the recognition sequence (the ‘left’ side in the orientation of Fig. 6C and D) was docked to the protein. Three of these models (9,22,23) are consistent with each other and the biochemical data and revise the first model proposed by Duan et al. (8). Bending of the DNA, which is required to fit the complete protein (the sizes of the protein and DNA in Fig. 6 are proportional), was considered. Gel retardation assays with circularly permuted binding fragments (12) showed a bend of 45 ± 15° for the lower complex (DNA binding to domain I alone) and of 75 ± 15° for the upper complex (DNA binding to the whole protein), both centered at base pair +7 (±1).
Figure 6.
Biochemical information about PI-SceI DNA binding and activity (see text for references). (A) Summary of reduced (open circle) binding activity (column 1); reduced (open circle), lost (filled circle) or improved (circle with cross) cleavage activity (column 2); no (circle with bar) or tight (filled circle) DNA binding of domain II (column 3); no (filled circle) hydroxyl radical hypersensitivity (column 4); reduced (open circle) or no (filled circle) hydroxyl radical activity (column 5); and nicked-strand preference (filled circle) (column 6) of existing PI-SceI mutants (column 7). For Asp229, + means D229E, D229Q or D229T; for Thr342, + means T341D or T341S. (B) Ribbon representation of the full-length construct of PI-SceI. Domain I (1gpp part, residues 1–53, 73–179 and 418–453) in red, missing loop (from 1vde chain A, residues 54–72) in purple and domain II (from 1vde chain A, residues 180–417) in blue. Amino acid side chains of important residues are shown in ball-and-stick representation, with yellow bonds if a mutant exists (see A) and with green bonds if photo-crosslink data are available (see C). Missing loops of domain II (residues 271–279 and 369–274) are shown as thin lines. (C) Summary of crosslink data, recognition sequence part. The top strand is in green, the bottom strand in magenta (also in D and F). Green spheres represent phosphates where photo-crosslinks via p-azidophenacylphosphorothioate were established; nucleobases with thick bonds represent those sites where photo-crosslinks of 5-iodopyrimidines were observed. For the cases where the crosslinked amino acid is known, this is represented by arrows (solid line, zero length crosslink; dotted line, non-zero length crosslink; dashed line, FeEDTA cleavage). (D) Summary of methylation and ethylation interference assays and of hydroxyl radical protection assays. Spheres (large, strong interference; medium sized, weak interference) represent the atoms where interference by a methyl group (blue, methylation of Gua-N7 or Ade-N3) or an ethyl group (green, phosphates) with DNA binding was found. Dotted surfaces (light blue, weak protection; dark blue, strong protection; yellow, weak hypersensitivity; orange, strong hypersensitivity) represent the results from hydroxyl radical protection assays. (E) Mutations in the PI-SceI recognition sequence. Red, loss-of-cleavage mutations; blue, loss-of-binding mutations; green, hypercleavable mutations. (F) Recognition sequence of PI-SceI with the cleavage site (blue line) and numbering of the base pairs (centered at the middle of the cleavage site). Base pairs with an orange background represent the minimal binding region (base pairs +5 to +21), nucleobases with a yellow background are protected from DNase I cleavage and the base pairs in the black box are considered the minimal sequence required for cleavage (base pairs –10 to +21).
A view of the electrostatic surface potential of domain I (Fig. 7A) supports the actual model. Positive charges, potential binders for the negatively charged DNA backbone, are located at the tongs-like part of domain I. It is very likely that helices D and E and strand l also belong to this subdomain, since they contain some of the residues thought to be important for DNA binding: Lys53, Lys173, Lys112, Lys124, Arg90 and Arg94 (see Fig. 6). No mutants or contacts are known for Lys113, His170 and Arg147 that are also potential DNA binders. No change in acitivity was observed for the mutant Lys97→Ala (13,43). The orientation of Lys97 in this structure is strongly influenced by crystal contacts and might have no meaning for DNA binding. The alignment of all residues with influence on the activity of PI-SceI in domain I (Fig. 7B) shows two classes of residues. The first, consisting of Tyr176, Tyr420, Arg172 and Arg162 but also Lys112 and Lys124, shows very small structural differences and could therefore be responsible for the initial positioning of the DNA. Residues of the second class, that differ structurally between the single structures, might move towards the ligand upon binding. Those latter residues are in the loop 55–66 and include arginines 87, 90 and 94 and tyrosines 130 and 173 (see also Fig. 3C).
At this point, we must remind ourselves that proteins were always treated as rigid objects in the above considerations and that the number of proven protein–DNA contacts is small. In fact, only four amino acids of PI-SceI have proven and close contacts to known sites in the recognition sequence, all of which are in domain II. These are the active site residues Asp218 and Asp326 and the residues Tyr328 and His333 with zero length crosslinks to G4 (top strand) and T9 (bottom strand), respectively. Three more crosslinks are established between Tyr384 and P of T7 (bottom strand), between Tyr420/Tyr176 and P of G13 (top strand) and between Lys112/Lys124 and P of C18 (bottom strand) at a maximal distance of ∼11 Å, the length of the crosslinker p-azidophenacylphosphorothioate (44).
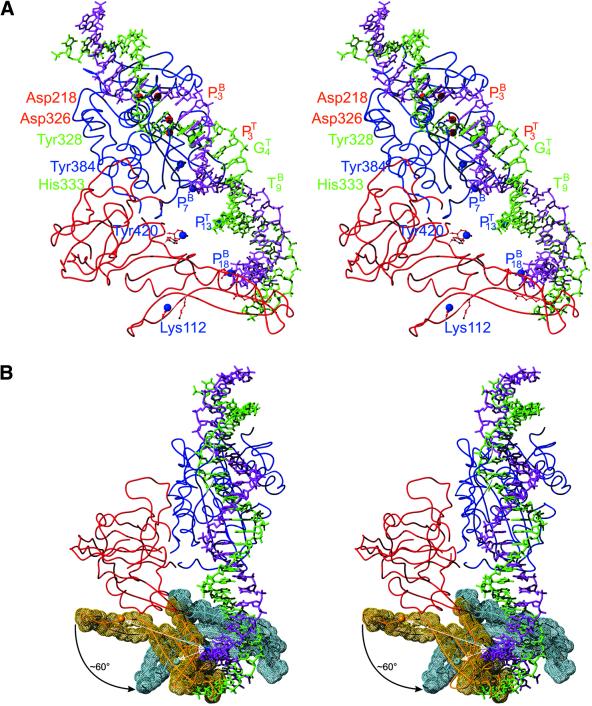
For a more detailed DNA binding model which considers a possible domain movement we used the following approach. A full-length consensus structure of PI-SceI was derived by alignment of 1vde_A with 1gpp (r.m.s.d. 2.0 Å for Cα, 2.6 Å for all atoms, calculated with the program LSQKAB; 32). The structure has residues 1–53, 73–179 and 418–453 from 1gpp as well as residues 54–72 (containing the missing loop in 1gpp) and 180–417 (containing domain II) from 1vde_A. A DNA fragment of 31 bp (–10 to +21, the minimal sequence required for cleavage) was constructed with a total bend of ∼75°. The model for this was a regularly bent DNA published by Carter and Tung (‘curve.pdb’; 45), which was manually mutated to correspond to the PI-SceI recognition sequence. The atoms with the closest contacts of the above described proven links were selected and aligned with LSQKAB (32): Asp218-Oδ2, P(–3) (bottom strand); Asp326-Oδ1, P(+3) (top strand); Tyr328-Cζ, G(+4)-N7 (bottom strand); His333-Cε1, T(+9)C5 (top strand). Recall that Asp218 participates in the cleavage of the top strand but lies close to the cleavage site of the bottom strand and vice versa for Asp326. This can be simulated by a structural alignment of 1vde (domain II) with the DNA complex of I-CreI (PDB code 1bp7; 20) (see the discussion of the jing-jang motif in Christ et al.; 17). N7 of guanine is the closest atom compared with C5 of 5-iodouridine which was inserted instead of G(+4) to establish the zero length crosslink (46). Those four atom pairs can be aligned with an r.m.s.d. of 2.3 Å (LSQKAB; 32) and yield a coordinate file with the 75° bent DNA docked to the full-length protein construct (ignoring overlaps of protein and DNA parts) (Fig. 8A and B).
Figure 8.
Docking model of PI-SceI (full-length construct) with the minimal sequence required for cleavage (31mer, bend 75°) after alignment of the four proven direct contact sites. Ribbon representations of the backbone and selected amino acid side chains in the ball-and-stick representation are shown. (A) Front view of the crystal structure-based model with domain I in red, domain II in blue, the DNA top strand in green and the bottom strand in magenta. Large spheres represent the sites of contact, with the nucleolytic active sites in red, the zero length crosslink sites in green and the non-zero length crosslink sites in blue. (B) ‘Hinge view’ with the tongs residues (amino acids 86–154) in front of the backbone surface drawing. The original orientation in 1gpp is in orange, the subdomain after the possible movement towards the major groove of the recognition sequence (the rearranged model) in light blue. The large spheres represent the Nζ atom of Lys112, which would come to crosslink distance to the phosphate of C18 of the bottom strand by the conformational change of the tongs subdomain. The possible movement of helices D and E and strand l, also belonging to this subdomain, is not shown for the sake of clarity.
This model is in partial disagreement with those previously published (see above), since the DNA points away from the tongs part of domain I with the ‘wrong’ side of the DNA (the right side in the orientation of Fig. 6C and D) facing the protein. Since the sites of zero length crosslinks are close to each other and the active sites (as well as the other residues of domain II proven to be important; see Fig. 6A and B) are consistent with the biochemical data, the model might be valid to some extent for domain II but requires a conformational change of at least the tongs subdomain or parts thereof. This is shown in Figure 8B, where a possible movement of this subdomain of ∼60° (and an additional one towards the back of the viewer’s plane) is outlined in the ‘hinge’ view. This movement would bring β-strands i, j and k of the tongs subdomain to the major groove at base pairs 16–18 and Lys112 from a distance of 35 Å to crosslink distance of the phosphate of C18. Other consequences of the movement would be the disruption of the contacts between strands j/k and helix D on the one side (boundary of the core and tongs subdomains of domain I) and on the other side new possible contacts between helix C and the loop of residues 409–413 and those of residues 150–152 with loops 30–31 and 439–441. The arginines 90 and 94 that prevent binding when mutated to alanine would come close to top strand nucleotides 14/15 and 16, respectively. Lysines 170 and 173 come close to nucleotides 10–12 of the top strand. The movement of the entire rigid tongs domain visualized in Figure 8B can be achieved using only a few degrees of freedom. Obviously, more subtle and complex conformational rearrangements upon DNA binding that involve only parts of the tongs subdomain cannot be excluded.
Another way to fit the biochemical data would be a twist of the DNA in addition to the bend that brings the protein-facing DNA part close to the residues with proven importance for DNA binding. One also has to take into account the possible movement of amino acid side chains (between 2.4 Å for Asp and 6.0 Å for Arg, measured from Cβ to the tip) and the 11 Å crosslinker p-azidophenacylphosphorothioate. It must be emphasized that the presented model is based on crystallographic and biochemical data and includes hypothetical movements of parts of the protein relative to each other, which are not yet proven and, therefore, require verification by a crystallographic analysis. Up to now, no co-crystals of a PI-SceI–DNA complex are available, neither are comparable complex structures that could help understand DNA binding by PI-SceI. The DNA complex of I-CreI (20) only covers domain II of PI-SceI (and is a good model for this part; 17) and the other homing endonuclease for which DNA complexes are available, I-PpoI (47), is structurally unrelated to PI-SceI. DNA binding is facilitated by three β-strands that reach into the major groove, but this part of the protein does not align with the tongs part of PI-SceI domain I.
Accession number
Coordinates of the structure of domain I of the S.cerevisiae homing endonuclease PI-SceI have been deposited with the Protein Data Bank (48), PDB code 1gpp.
Acknowledgments
ACKNOWLEDGEMENTS
We are grateful to Prof. Y. Satow (Tokyo) for making coordinates for 1jva available before public release. X-ray data were measured at beamline BW7B of the EMBL outstation at DESY, Hamburg, with kind help from local staff. This work was supported by the Deutsche Forschungs gemeinschaft through He 1318/24-1 and the Fonds der Chemischen Industrie.
PDB no. 1gpp
REFERENCES
- 1.Mueller J.E., Bryk,M., Loizos,N., Belfort,M., Lloyd,R.S. and Roberts,R.J. (1993) Homing endonucleases. In Linn,S.M. (ed.), Nucleases. Cold Spring Harbor Laboratory Press, Cold Spring Harbor, NY, pp. 111–143.
- 2.Jurica M.S. and Stoddard,B.L. (1999) Homing endonucleases: structure, function and evolution. Cell. Mol. Life Sci., 55, 1304–1326. [DOI] [PMC free article] [PubMed] [Google Scholar]
- 3.Chevalier B.S. and Stoddard,B.L. (2001) Homing endonucleases: structural and functional insight into the catalysts of intron/intein mobility. Nucleic Acids Res., 29, 3757–3774. [DOI] [PMC free article] [PubMed] [Google Scholar]
- 4.Belfort M. and Roberts,R.J. (1997) Homing endonucleases: keeping the house in order. Nucleic Acids Res., 25, 3379–3388. [DOI] [PMC free article] [PubMed] [Google Scholar]
- 5.Gimble F.S. and Thorner,J. (1992) Homing of a DNA endonuclease gene by meiotic gene conversion in Saccharomyces cerevisiae. Nature, 357, 301–306. [DOI] [PubMed] [Google Scholar]
- 6.Gimble F.S. and Thorner,J. (1993) Purification and characterization of VDE, a site-specific endonuclease from the yeast Saccharomyces cerevisiae. J. Biol. Chem., 268, 21844–21853. [PubMed] [Google Scholar]
- 7.Lambowitz A.M. and Belfort,M. (1993) Introns as mobile genetic elements. Annu. Rev. Biochem., 62, 587–622. [DOI] [PubMed] [Google Scholar]
- 8.Duan X., Gimble,F.S. and Quiocho,F.A. (1997) Crystal structure of PI-SceI, a homing endonuclease with protein splicing activity. Cell, 89, 555–564. [DOI] [PubMed] [Google Scholar]
- 9.Hu D., Crist,M., Duan,X., Quiocho,F.A. and Gimble,F.S. (2000) Probing the structure of the PI-SceI-DNA complex by affinity cleavage and affinity photocross-linking. J. Biol. Chem., 275, 2705–2712. [DOI] [PubMed] [Google Scholar]
- 10.Poland B., Xu,M.-Q. and Quiocho,F.A. (2000) Structural insights into the protein splicing mechanism of PI-SceI. J. Biol. Chem., 275, 16408–16413. [DOI] [PubMed] [Google Scholar]
- 11.Mizutani R., Nogami,S., Kawasaki,M., Ohya,Y., Anraku,Y. and Satow,Y. (2002) Protein-splicing reaction via a thiazolidine intermediate: crystal structure of the VMA1-derived endonuclease bearing the N and C-terminal propeptides. J. Mol. Biol., 316, 919–929. [DOI] [PubMed] [Google Scholar]
- 12.Wende W., Grindl,W., Christ,F., Pingoud,A. and Pingoud,V. (1996) Binding, bending and cleavage of DNA substrates by the homing endonuclease PI-SceI. Nucleic Acids Res., 24, 4123–4132. [DOI] [PMC free article] [PubMed] [Google Scholar]
- 13.He Z., Crist,M., Yen,H.-c., Duan,X., Quiocho,F.A. and Gimble,F.S. (1998) Amino acid residues in both the protein splicing and endonuclease domains of the PI-SceI intein mediate DNA binding. J. Biol. Chem., 273, 4607–4615. [DOI] [PubMed] [Google Scholar]
- 14.Gimble F.S. and Wang,J. (1996) Substrate recognition and induced DNA distortion by the PI-SceI endonuclease, an enzyme generated by protein splicing. J. Mol. Biol., 263, 163–180. [DOI] [PubMed] [Google Scholar]
- 15.Grindl W., Wende,W., Pingoud,V. and Pingoud,A. (1998) The protein splicing domain of the homing endonuclease PI-SceI is responsible for specific DNA binding. Nucleic Acids Res., 26, 1857–1862. [DOI] [PMC free article] [PubMed] [Google Scholar]
- 16.Gimble F.S. and Stephens,B.W. (1995) Substitutions in conserved dodecapeptide motifs that uncouple the DNA binding and DNA cleavage activities of PI-SceI endonuclease. J. Biol. Chem., 270, 5849–5856. [DOI] [PubMed] [Google Scholar]
- 17.Christ F., Schoettler,S., Wende,W., Steuer,S., Pingoud,A. and Pingoud,V. (1999) The monomeric homing endonuclease PI-SceI has two catalytic centres for cleavage of the two strands of its DNA substrate. EMBO J., 18, 6908–6916. [DOI] [PMC free article] [PubMed] [Google Scholar]
- 18.Guex N. and Peitsch,M.C. (1997) SWISS-MODEL and the Swiss-Pdb Viewer: an environment for comparative protein modeling. Electrophoresis, 18, 2714–2723. [DOI] [PubMed] [Google Scholar]
- 19.Heath P.J., Stephens,K.M., Monnat,R.J.,Jr and Stoddard,B.L. (1997) The structure of I-CreI, a group I intron-encoded homing endonuclease. Nature Struct. Biol., 4, 468–476. [DOI] [PubMed] [Google Scholar]
- 20.Jurica M.S., Monnat,R.J.,Jr and Stoddard,B.L. (1998) DNA recognition and cleavage by the LAGLIDADG homing endonuclease I-CreI. Mol. Cell, 2, 469–476. [DOI] [PubMed] [Google Scholar]
- 21.Ichiyanagi K., Ishino,Y., Ariyoshi,M., Komori,K. and Morikawa,K. (2000) Crystal structure of an archaeal intein-encoded homing endonuclease PI-PfuI. J. Mol. Biol., 300, 889–901. [DOI] [PubMed] [Google Scholar]
- 22.Christ F., Steuer,S., Thole,H., Wende,W., Pingoud,A. and Pingoud,V. (2000) A model for the PI-SceIxDNA complex based on multiple base and phosphate backbone-specific photocross-links. J. Mol. Biol., 300, 867–875. [DOI] [PubMed] [Google Scholar]
- 23.Pingoud V., Thole,H., Christ,F., Grindl,W., Wende,W. and Pingoud,A. (1999) Photocross-linking of the homing endonuclease PI-SceI to its recognition sequence. J. Biol. Chem., 274, 10235–10243. [DOI] [PubMed] [Google Scholar]
- 24.Hu D., Crist,M., Duan,X. and Gimble,F.S. (1999) Mapping of a DNA binding region of the PI-SceI homing endonuclease by affinity cleavage and alanine-scanning mutagenesis. Biochemistry, 38, 12621–12628. [DOI] [PubMed] [Google Scholar]
- 25.Bairoch A. and Apweiler,R. (2000) The SWISS-PROT protein sequence database and its supplement TrEMBL in 2000. Nucleic Acids Res., 28, 45–48. [DOI] [PMC free article] [PubMed] [Google Scholar]
- 26.Gimble F.S. (2001) Degeneration of a homing endonuclease and its target sequence in a wild yeast strain. Nucleic Acids Res., 29, 4215–4223. [DOI] [PMC free article] [PubMed] [Google Scholar]
- 27.Jancarik J. and Kim,S.-H. (1991) Sparse matrix sampling: a screening method for crystallization of proteins. J. Appl. Crystallogr., 24, 409–411. [Google Scholar]
- 28.Otwinowski Z. and Minor,W. (1997) Processing of X-ray diffraction data collected in oscillation mode. Methods Enzymol., 276, 307–326. [DOI] [PubMed] [Google Scholar]
- 29.Navaza J. (1994) AMoRe: an automated package for molecular replacement. Acta Crystallogr. A, 50, 157–163. [Google Scholar]
- 30.Lamzin V.S. and Wilson,K.S. (1993) Automated refinement of protein models. Acta Crystallogr. D, 49, 129–149. [DOI] [PubMed] [Google Scholar]
- 31.Jones T.A., Zou,J.Y., Cowan,S.W. and Kjeldgaard,M. (1991) Improved methods for building protein models in electron density maps and the location of errors in these models. Acta Crystallogr. A, 47, 110–119. [DOI] [PubMed] [Google Scholar]
- 32.Collaborative Computational Project No. 4 (1994) The CCP4 suite: programs for protein crystallography. Acta Crystallogr. D, 50, 760–763. [DOI] [PubMed] [Google Scholar]
- 33.Murzin A.G., Brenner,S.E., Hubbard,T.J.P. and Chothia,C. (1995) SCOP: a structural classification of protein database for the investigation of sequences and structures. J. Mol. Biol., 247, 536–540. [DOI] [PubMed] [Google Scholar]
- 34.Orengo C.A., Michie,A.D., Jones,S., Jones,D.T., Swindells,M.B. and Thornton,J.M. (1997) CATH—a hierarchic classification of protein domain structures. Structure, 5, 1093–1108. [DOI] [PubMed] [Google Scholar]
- 35.Klabunde T., Sharma,S., Telenti,A., Jacobs,W.R.,Jr and Saccettini,J.C. (1998) Crystal structure of GyrA intein from Mycobacterium xenopi reveals structural basis of protein splicing. Nature Struct. Biol., 31, 31–36. [DOI] [PubMed] [Google Scholar]
- 36.Hall T.M.T., Porter,J.A., Young,K.E., Koonin,E.V., Beachy,P.A. and Leahy,D.J. (1997) Crystal structure of a hedgehog autoprocessing domain: homology between hedgehog and self-splicing proteins. Cell, 91, 85–97. [DOI] [PubMed] [Google Scholar]
- 37.Holm L. and Sander,C. (1993) Protein structure comparison by alignment of distance matrices. J. Mol. Biol., 233, 123–138. [DOI] [PubMed] [Google Scholar]
- 38.Hutchinson E.G. and Thornton,J.M. (1996) PROMOTIF—a program to identify and analyze structural motifs in proteins. Protein Sci., 5, 212–220. [DOI] [PMC free article] [PubMed] [Google Scholar]
- 39.Hubbard S.J. and Thornton,J.M. (1993) NACCESS. Department of Biochemistry and Molecular Biology, University College, London, UK.
- 40.Mills K.V. and Paulus,H. (2001) Reversible inhibition of protein splicing by zinc ion. J. Biol. Chem., 276, 10832–10838. [DOI] [PubMed] [Google Scholar]
- 41.Noren C.J., Wang,J. and Perler,F.B. (2000) Dissecting the chemistry of protein splicing and its applications. Angew. Chem. Int. Ed., 39, 450–466. [PubMed] [Google Scholar]
- 42.Pingoud V., Grindl,W., Wende,W., Thole,H. and Pingoud,A. (1998) Structural and functional analysis of the homing endonculease PI-SceI by limited proteolytic cleavage and molecular cloning of partial digestion products. Biochemistry, 37, 8233–8243. [DOI] [PubMed] [Google Scholar]
- 43.Wende W., Schöttler,S., Grindl,W., Christ,F., Scheuer,S., Noel,A.J., Pingoud,V. and Pingoud,A. (2000) A mutational analysis of DNA binding and cleavage by the homing endonuclease PI-SceI. Mol. Biol., 34, 902–912. [Google Scholar]
- 44.Yang S.-W. and Nash,H.A. (1994) Specific photocrosslinking of DNA-protein complexes: identification of contacts between integration host factor and its target DNA. Proc. Natl Acad. Sci. USA, 91, 12183–12187. [DOI] [PMC free article] [PubMed] [Google Scholar]
- 45.Carter E.S. and Tung,C.S. (1996) NAMOT2—a redesigned nucleic acid modeling tool: construction of non-canonical DNA structures. Comput. Appl. Biosci., 12, 25–30. [DOI] [PubMed] [Google Scholar]
- 46.Norris C.L., Meisenheimer,P.L. and Kock,T.H. (1996) Mechanistic studies of the 5-iodouracil chromophore relevant to its use in nucleoprotein photo-cross-linking. J. Am. Chem. Soc., 118, 5796–5803. [Google Scholar]
- 47.Flick K.E., Jurica,M.S., Monnat,R.J.,Jr and Stoddard,B.L. (1998) DNA binding and cleavage by the nuclear intron-encoded homing endonuclease I-PpoI. Nature, 394, 96–101. [DOI] [PubMed] [Google Scholar]
- 48.Berman H.M., Westbrook,J., Feng,Z., Gilliland,G., Bhat,T.N., Weissig,H., Shindyalov,I.N. and Bourne,P.E. (2000) The protein data bank. Nucleic Acids Res., 28, 235–242. [DOI] [PMC free article] [PubMed] [Google Scholar]
- 49.Koradi R., Billeter,M. and Wüthrich,K. (1996) MOLMOL: a program for display and analysis of macromolecular structures. J. Mol. Graph., 14, 51–55. [DOI] [PubMed] [Google Scholar]
- 50.Weiss M.S. (2001) Global indicators of X-ray data quality. J. Appl. Crystallogr., 34, 130–135. [Google Scholar]


