

Abstract
The tumor promoter 12-O-tetradecanoylphorbol-13-acetate (TPA) is a potent inducer of differentiation in human promyelocytic leukemia cells. Recently, TPA has been successfully administered to patients with myelocytic leukemia and has produced therapeutic effects that led to temporary remission. These studies demonstrated the potential efficacy of TPA in cancer chemotherapy. We now seek to understand the biological effects and molecular mechanisms of differentiation in response to TPA treatment in leukemia cells by expression profiling using DNA microarray. Our results show distinct temporal and coordinated gene changes that are consistent with differentiation and activation of multiple biochemical pathways in HL-60 cells exposed to TPA. Alterations of gene expression in HL-60 cells include various transcription factors, cytokines and protein markers that are consistent with the induction of differentiation elicited by TPA. These temporal patterns of gene expression were abolished or greatly diminished in an HL-60 derived TPA- resistant variant cell line (HL-525), thus revealing transcriptional and consequential biochemical changes that may be required for TPA-induced differentiation. In addition, certain genes were upregulated by TPA in TPA-resistant HL-525 cells but not in TPA-sensitive HL-60 cells suggesting that these genes may play a role in the resistant pheno type. These patterns of gene expression may be important for predicting response to TPA.
INTRODUCTION
12-O-tetradecanoylphorbol-13-acetate (TPA)-induced cellular differentiation of a number of leukemia cell lines including HL-60 human myeloid leukemia cells has been extensively investigated. These effects of TPA are thought, in part, to be due to the activation of protein kinase Cβ (1,2). Induction of terminal differentiation in leukemia cells is also associated with the activation of the stress-activated protein kinase (SAPK), release of cytochrome c, activation of caspases and ultimately the induction of apoptosis (3,4).
Recently, exploiting its potent effects on the induction of differentiation in human leukemia cells in vitro, TPA was administered by intravenous infusions to patients with myelocytic leukemia, who were refractory to all-trans retinoic acid, cytosine arabinoside (AraC) and other chemotherapeutic drugs (5). TPA, given alone, or in combination with vitamin D3 and a low dose of AraC, was shown to decrease the number of myeloblasts and conferred remissions in some of these patients. It was shown further that white blood cell counts were increased to the normal range when TPA was given alone in patients with depressed white blood cell and neutrophil counts due to prior treatment with bone marrow suppressive chemotherapeutic drugs (6). These results, although preliminary, indicated therapeutic efficacy for TPA in leukemic patients and also indicated its ability to overcome the marrow suppressive effects associated with the use of cytotoxic chemotherapeutic regimens.
Further molecular and genetic analyses of the effects of TPA are needed to obtain a better understanding of the mechanisms contributing to differentiation and therapeutic response. Gene expression analyses have identified a number of downstream targets that are induced by TPA, and some of them may be essential for the onset of differentiation. For example, expression of the ubiquitin C-terminal hydrolase gene has been shown to be associated with TPA-induced differentiation of an acute lymphoblastic leukemia cell line, Reh, to a mature non-dividing state (7). Differential regulation of c-myc, c-max and mxi1 expression has also been reported in leukemia cells undergoing TPA-induced differentiation (8). Recently, the pattern of gene expression in HL-60 cells treated with TPA was examined by DNA microarray (9). Alterations in the expression of a large number of genes were observed and some of these gene changes are in concordance with previous findings of their role in differentiation. Despite these analyses, our understanding of the global mechanisms of TPA-induced differentiation is still sketchy.
In this study, we hope to gain further insights into the biological effects and molecular mechanisms of TPA-induced differentiation in leukemia cells by comparing the expression profiles of HL-60 and its TPA-resistant derivative, HL-525 cells, in response to TPA treatment. Since HL-525 cells are resistant to TPA-induced differentiation (10), expression profiling with this TPA-resistant mutant might reveal genes and pathways that are crucial for the TPA-mediated differentiation program and mechanisms of TPA resistance.
MATERIALS AND METHODS
Cell lines
HL-60 and its TPA-resistant derivative variant HL-525 cells (10) were cultured in RPMI media supplemented with 10% fetal bovine serum, penicillin (100 U/ml), streptomycin (100 µg/ml) and l-glutamine (300 µg/ml) as previously described (11). TPA was purchased from Alexis Biochemicals (San Diego, CA). Cultured cells were grown at 37°C in a humidified atmosphere of 5% CO2 and were passed twice a week to keep the cell density under 1.5 × 10⁶ cells/ml. For the differentiation assay, HL-60 and HL-525 cells were seeded at a density of 0.2 × 10⁶ cells/ml and treated with 32 nM TPA for various times up to 48 h. At each time point, the number of viable cells was determined by trypan blue exclusion assay and cell viability was >90%. The number of adherent cells was scored in randomly selected microscopic field (200-fold magnification) using a phase-contrast microscope (Nikon Phase-Contrast 2, Japan). The percent of adherent cells as a percentage of total viable cells, determined by trypan blue exclusion assay, was calculated for each time point.
Microarrays
Human GeneFilters™ arrays, GF211, were obtained from Research Genetics, Inc. (Huntsville, AL). These arrays, printed on 5 × 7 cm nylon membranes, contained approximately 4200 expressed sequence tags (ESTs/cDNA elements) corresponding to known genes in the GenBank database. All the EST clones have been sequence verified. The array also contained 192 spots of total genomic DNA and 168 housekeeping genes, which serve as reference points for the image analysis software, Pathways™ (Research Genetics, Inc.), for normalization and for verifying the homogeneity of the hybridization.
RNA extraction, probe preparation and labeling, hybridization and scanning
RNA was extracted from the HL-60 and HL-525 cells using the Triazol reagent (LTI, Inc., Gaithersburg, MD). Qualities of all RNA samples were monitored by gel electrophoresis before further use. The labeling procedures were conducted as specified by the manufacturer and details of the protocols are downloadable from the Research Genetics, Inc. web site (http://www.resgen.com). In brief, cDNA targets were synthesized from total RNA with [33P]dCTP by oligo dT-primed polymerization using Superscript II reverse transcriptase (LTI, Inc.). Approximately 5 µg of total RNA samples were used in each labeling reaction. The pool of nucleotides in the labeling reaction was 0.5 mM dGTP, dATP and dTTP, and 0.2 mM dCTP. Probes were purified by gel chromatography (BioSpin 6; Bio-Rad, Hercules, CA) and ethanol precipitated, and then resuspended in 100 µl of TE buffer and an aliquot was withdrawn for determination of incorporation efficiency. Prior to hybridization, the solution was boiled for 2 min then allowed to cool to room temperature. An equal number of counts (c.p.m.) were applied from each sample for hybridization at 46°C. At the end of hybridization, filters were washed for 20 min in 2× SSC, 0.2% SDS at room temperature, and then for 30 min in 0.1× SSC, 0.2% SDS, at 60°C. Arrays were then exposed on phosphorimage screen for the appropriate time and scanned on a Molecular Dynamics Storm Phosphor imager (Molecular Dynamics/Amersham Biosciences, Sunnyvale, CA). The scanned images were analyzed with the Pathways™ software.
Statistical methods
Trans-activation and -repression of gene expression may be regulated transiently, protractedly and periodically. We reasoned that these patterns of gene change might be predicted using the algorithm of polynomial functions. The gene expression data obtained were first normalized after background subtraction using the Pathways™ software and the normalized data for each gene were then analyzed by regression models to fit polynomial functions of the logarithm of time up to third degree for each gene. Genes that showed >2-fold changes for at least two consecutive time points were included in the polynomial regression analysis. A subset of genes with significant coefficients of the highest degree (i.e. cubic, quadratic or linear) at the significance level of 2% (to control possible type-I error rate from multiple comparisons) was selected for bioinformatics searches. Moreover, local regression models were also used to fit quadratic polynomials of the logarithm of time to find genes with only a short period of peak over time. Five consecutive time points were used for the local regression model, and genes with significant coefficients of quadratic term at 0.5% significance level (to further control possible type-I error rate from multiple comparisons) were selected. For the selected genes, the patterns of gene expression were log transformed, centered by median, and subjected to cluster analyses by centered correlation and average linkage as the similarity/distance metric, using the hierarchical cluster algorithm in Cluster and TreeView software suite (12). The entire data set for the microarray experiments described in this study is available for searches and downloading at http://cinj.umdnj.edu/drug_resistance.
RESULTS
Previous gene expression analyses using traditional molecular approaches have led to the identification of a diverse number of genes that are variously implicated in TPA-induced differentiation in human leukemic cells in vitro. Recent use of DNA microarray similarly captured the expression profile of a large number of genes, with expected changes that correlate with previous findings, as well as some unexpected altered gene expressions that are thought to be novel and possibly crucial for the effects of TPA (9). Nevertheless, the biochemical and genetic pathways governing the differentiation program by TPA are still incompletely understood.
To further delineate the mechanisms of TPA-induced differentiation, we examined in this study the differential expression profiles of HL-60 and its TPA-resistant variant HL-525 cells in response to TPA treatment. HL-525 cells are resistant to TPA-induced differentiation (Fig. 1), and genes whose expressions are altered in HL-60 but not HL-525 cells may play a role in the TPA-induced differentiation phenotype.
Figure 1.
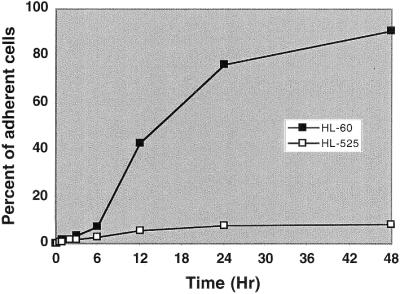
Differentiation of HL-60 and HL-525 cells by TPA. Cells were exposed to 32 nM TPA for various times up to 48 h and adherent cells, indicative of differentiation, were scored. Percent of adherent cells as a function of time for HL-60 and HL-525 cells are shown.
We first monitored the expression profiles of the HL-60 leukemia cells in response to treatment with TPA in a time-course analysis. RNAs were isolated from cells treated with TPA at 0, 0.25, 0.5, 1, 2, 3, 6, 12, 24 and 48 h and compared with untreated controls. Samples were labeled by reverse transcription and then hybridized to cDNA arrays with 4105 genes printed on nylon membranes (Research Genetics, Inc.) (for details see Materials and Methods). Normalized data were analyzed by regression models and the expression levels for each gene were fitted to polynomial functions relative to the logarithm of time up to the third degree for each gene. Statistically significant alterations in the expression of many genes were observed as described in the Materials and Methods. A subset of them, whose functions and biological significance are related to TPA action and differentiation, were selected for Cluster analysis and the results displayed by TreeView (12). The data indicated temporal patterns of altered gene expression that can be classified as early, intermediate and late response genes (Fig. 2). The remaining genes are available as Supplementary Material for searches and downloading.
Figure 2.

Cluster analysis of TPA-induced expression profiles of HL-60 and HL-525 cells. Cells were treated with TPA and then harvested at the indicated times for microarray experiments and the expression data were then analyzed by regression models as described in Materials and Methods. Representative clusters of genes were shown in the clustergram for their temporal pattern of expression. Transition of color for each gene from brown to green indicates a gradual decrease in expression with time, and from brown to red indicates upregulation of gene expression.
The early response genes were induced within 15 min after treatment with TPA and their expression was undetectable by 2–3 h. Some of the early response genes induced by TPA include JunD (13), FosB (14), homeobox protein NKX2.1 (15), transcription factor 3 (E2A immunoglobulin enhancer binding factors E12/E47, tcf3) (16), Kruppel-like zinc finger factor (KLF4) (17) and Rab2 (18) (Fig. 2). The onset of induction of the intermediate response genes occurred ∼2–3 h after TPA treatment and the expression of these genes was shut off by 12–24 h, and they include interleukin 8 (19) and the small inducible cytokines A2, A3, A4 and A7 (20), early growth response-1 and -2 (EGR-1 and -2) (21,22) and Pac-1 (23) (Fig. 2). The late response genes were induced or repressed between 12 and 24 h and their expression either peaked or declined by 48 h. Some of the late genes include differentiation markers such as myeloperoxidase (24), villin (25), vimentin (26) and activin A (27,28).
As evident from the above data, several patterns of gene expression could be visually identified in TPA-treated cells. We wished to develop more quantitative models that would allow us to predict whether particular genes conform to these patterns in a statistically significant manner. Microarray data were analyzed by regression models to fit the polynomial functions relative to the logarithm of time up to the third degree for all genes (see Materials and Methods). The mean fold-changes in expression of the subset of genes corresponding to those in Figure 2 were obtained and further analyzed as a function of time. These included 13 early response, 21 intermediate response and 19 late response genes that were upregulated in HL-60 cells as well as 11 biphasic response genes. The expression of all of these genes was upregulated in HL-60 cells but not in HL-525 cells. An additional five genes were downregulated in HL-60 cells but not in HL-525 cells. Our results showed that TPA-induced temporal expression patterns of upregulation in HL-60 cells fitted the polynomial functions relative to the logarithm of time (Fig. 3). Interestingly, early response genes that were upregulated tend to be quadratic in pattern, and these genes were induced within 15 min after TPA treatment and returned to basal levels within 2–3 h (Fig. 3A). Additionally, we observed that intermediate and late response genes also responded to TPA induction in a quadratic fashion (Fig. 3B and C). Since our time-course experiments did not extend beyond 48 h, extrapolation of the pattern of late response genes to later time points was not possible. Nevertheless, a cyclical pattern of gene expression that fits the cubical degree of the regression model was also observed (Fig. 3D). The periodic change in the expression of these genes may implicate their association with the cell cycle (9). In contrast, a linear pattern of expression was observed for most genes that were targeted for downregulation by TPA (data not shown). Studies on TPA-induced temporal expression of the same genes that were examined in Figure 2 in HL-60 cells (Figs 2 and 3A–D) showed that these genes were not responsive to TPA in HL-525 cells (Figs 2 and 3E–H).
Figure 3.

Effect of TPA on expression profiles of HL-60 and HL-525 cells by regression modeling. For the normalized expression data, regression models were used to fit the polynomial functions relative to the logarithm of time up to the third degree for each gene. A subset of upregulated genes with significant coefficients of the highest degree (i.e. cubic, quadratic or linear) at significance levels of <5% was selected for the HL-60 cells (Fig. 2). These genes are shown in (A)–(D). The effect of TPA on the same genes was also shown for HL-525 cells (E–H). The average fold-changes for the respective cluster of genes were plotted as a function of time in relation to the sequence of their expression. The solid line represents a 2-fold cut-off for the expression levels for these genes. The time points examined in these experiments include 0, 0.25, 0.5, 1, 2, 3, 6, 12, 24 and 48 h.
Coordinated changes in the transcriptions of various genes that shared common biochemical pathways were also found. For example, expression of TGF-β2 (Fig. 4B) (29), TGF-β receptor type III (Fig. 2) (30), TSC-22 (Fig. 4B) (31) and activin A (Fig. 2) (32), are coordinately regulated. Gene clusters with common biochemical pathways, such as those of the interleukin 1 signaling pathway (33) (the interleukin I receptor type I and II precursors, the interleukin 1 receptor accessory protein and the interleukin receptor 1 antagonist), calcium signaling and metabolism (34,35) (S100 calcium binding proteins A2, A3 and A8, the calcium activated potassium channel SKCA3, transient receptor potential channel 1 and calgizzarin), and cell migration and tumor-cell invasion factors (36,37) [plasminogen activator (urokinase receptor), plasminogen activator inhibitor, matrix metalloproteinase 2 (38), prolyl endopeptidase, dipeptidylpeptidase IV and the metalloprotease-disintegrin MDC9] and actin binding proteins [villin (26), vimentin (27) and filamin (39)], were induced either in parallel or in tandem by TPA (Figs 2 and 4B).
Figure 4.
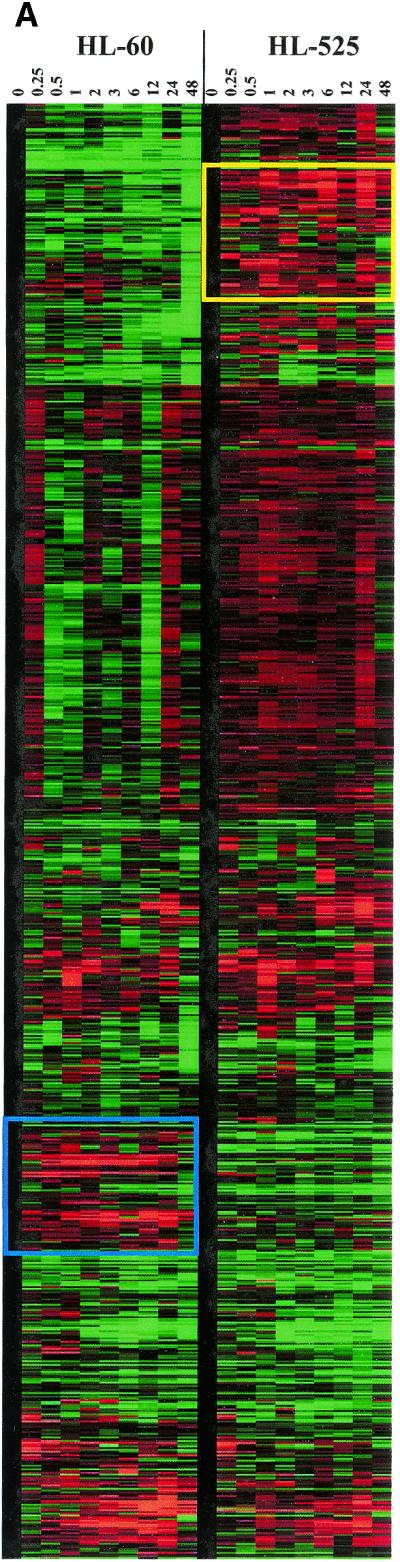

Comparison of the expression profiles between HL-60 and HL-525 cells. (A) Clustergram of all genes examined by microarray in HL-60 and HL-525 cells. The yellow and blue boxes showed clusters of genes uniquely induced in either HL-60 or HL-525 cells, respectively. (B) Clustergram of genes induced in both HL-60 and HL-525 cells. A subset of genes induced by TPA in both HL-60 and HL-525 were subjected to cluster analysis independently. These genes are probably not involved in differentiation. (C) Clustergram of genes induced by TPA in HL-525 but not in HL-60 cells. Comparison of a subset of genes induced by TPA mostly in HL-525 cells, but that was not significantly altered in HL-60 cells, was cluster analyzed independently as above. Red squares represent higher than uninduced control levels of gene expression (upregulation) and green squares lower than uninduced control levels (downregulation).
To further determine the genes that are specifically associated with the differentiation phenotype, we investigated the expression profiles of the HL-60 derived TPA-resistant mutant HL-525 cells (10,40). These cells do not undergo appreciable macrophage differentiation which is characteristic of HL-60 cells in response to TPA treatment (Fig. 1). The HL-525 cells also exhibit defective expression in the β isotype of protein kinase C (PKCβ) (41), and introduction of wild- type PKCβ has been shown to restore the capacity for differentiation in these cells (1). Expression profiling by DNA microarray showed that the distinct temporal patterns of TPA-induced changes in gene expression found in the HL-60 cells were largely abolished in the HL-525 mutant in response to TPA (Figs 2 and 3E–H), thus indicating that these clusters of genes, including JunD, FosB, EGR-1 and -2, interleukin 8, the small inducible cytokines (A2–A5) and some of the interleukin receptors may be a part of the transcription program for TPA-induced differentiation in HL-60 cells and their expressions may be mediated by PKCβ.
Although there are differences in TPA-induced gene expression in HL-60 and HL-525 cells, not all of the changes in gene expression are statistically significant in our analysis (Fig. 4A). Some genes, including Ini1, colony stimulating factor 1 receptor, TGF-β2, the A-kinase anchoring protein 18 (AKAP18), monocyte chemotactic protein 3 and 5-lipoxygenase activating protein, were induced by TPA in both the wild-type and the TPA-resistant mutant cells, thus suggesting that they are not involved in differentiation (Fig. 4B). The levels of induction of many of these genes in HL-525 cells, however, were lower than those in HL-60 cells. Additionally, the mutant cells also failed to exhibit the cyclical pattern of expression for TGF-β2 that was observed in HL-60 cells (Fig. 4B). By this approach, the temporal and coordinated changes in gene expression induced by TPA in HL-60 but not in HL-525 cells (Figs 2 and 3) suggest that some of these genes are involved in differentiation.
It is also apparent from the clustergram that a novel cluster of genes was induced temporally by TPA in the HL-525 cells that were unaltered in their expression in HL-60 cells [Fig. 4A (cluster in yellow box) and C and Table 1]. It is possible that the upregulation of these genes plays a role in the TPA-resistant phenotype of HL-525 cells. Genes induced by TPA in HL-525 cells include the stress-activated protein kinase, SAPK/JNK1 (42), JNKK2, (43), the erythrocyte membrane protein band 4.1 (protein 4.1) (44), the DEAD-box RNA helicase, DDX3 (45), p110 subunit of eIF-3 (46) and the transcription factor GATA-6 (47) (Fig. 4C).
Table 1. TPA-induced temporal gene expression in HL-525 cellsa.
| GenBank accession no. | Gene name and description | Expression |
|---|---|---|
| Early response genes | ||
| AA446018 | Ini1, subunit of SWI/SNF chromatin remodeling complex | ↑ |
| AA029890 | PKCα | ↑ |
| AA284954 | Colony stimulating factor 1 receptor | ↑ |
| AA454947 | AKAP149 | ↑ |
| AA626845 | DEAD-box RNA helicase (DDX3) | ↑ |
| AA405569 | Fibroblast activating protein, dipeptidyl peptidase and gelatinase | ↑ |
| R01238 | Tip associating protein, transport | ↑ |
| AA454094 | Cullin (Cul-2), interacts with VHL/elongin B and C to form an ubiquitin-ligase complex | ↑ |
| H80712 | Caspase 10 | ↑ |
| H77651 | GATA-6, transcription factor | ↑ |
| Intermediate response genes | ||
| AA454585 | Splicing factor, arginine/serine rich-2 (SFRS2) | ↑ |
| W72693 | hnRNP A/B (ABBP1), splicing | ↑ |
| AA040170 | Monocyte chemotactic protein 3 | ↑ |
| AA262719 | Protein tyrosine phosphatase, non-receptor type 7 | ↑ |
| H85962 | JNK kinase 2 (JNKK2) | ↑ |
| W45690 | Mitogen-activated protein kinase 1 | ↑ |
| AA454612 | Huntingtin, microtubule-mediated transport or vesicle function | ↑ |
| R89082 | AKAP18 | ↑ |
| AA459308 | Elastin | ↑ |
| H50344 | Tight junction protein | ↑ |
| R89567 | Vitamin D binding protein | ↑ |
| AA703141 | Protein 4.1 | ↑ |
| AA019320 | Adducin 2 | ↑ |
| Late response genes | ||
| N21576 | Mitochondrial 1,25-dihydroxyvitamin D3 24-hydroxylase | ↑ |
| AA664389 | TSC-22, TGFβ-stimulated protein | ↑ |
| H44953 | Caspase-4 | ↑ |
| H96235 | v-ets avian erythroblastosis virus E2 oncogene homolog 2 (ETS-2) | ↑ |
| AA436163 | Prostaglandin E synthase | ↑ |
| T53298 | Prostacyclin-stimulating factor | ↑ |
| T49652 | 5-Lipoxygenase activating protein | ↑ |
| AA496780 | Rab7, endocytic transport | ↑ |
| AA487593 | Transferrin receptor | ↑ |
| AA486112 | Vacuolar H+-ATPase | ↑ |
aExpression of these genes is not affected in HL-60 cells.
Coordinated changes were also observed in the mutant cells treated with TPA, which include a cluster of genes involved in protein folding, transport and secretion [heat shock cognate 71 kDa protein (48); Rab7, involved in endocytic protein transport (49); the signal sequence receptor δ subunit (translocon-associated protein δ) (50); TAP, the human homolog of Mex67p that mediates CTE-dependent RNA export from the nucleus (51); the p110 subunit of eIF-3, a Nip1 homolog in yeast required for nuclear export (46); and huntingtin, involved in microtubule-mediated transport or vesicle function (52)], and the parallel expression of the signal transduction cluster SAPK/JNK1 and JNKK2. Induction of proteases, such as caspase-4 and -10, and the fibroblast activating protein, which is a dipeptidyl peptidase and gelatinase (53), by TPA were also found in HL-525, but not in HL-60 cells.
Furthermore, changes in the expression of some genes in HL-525 cells induced by TPA, including the DEAD-box RNA helicase, cullin, vacuolar H+-ATPase, coronin-like protein (actin-binding protein), ATP synthase γ subunit (H-type), NUP 88 (nucleoporin), ADP ribosylation factor 4 and the ADP/ATP mitochondrial carrier protein, are functionally similar to those in Caenorhabditis elegans that are required for cell division (54), thus indicating that the mutant cells responded to TPA differently from the wild-type cells and were not differentiating.
DISCUSSION
Gene expression induced by TPA has been examined extensively. Many genes have been serially identified over the years that are thought to be part of the transcription program for TPA-induced differentiation. Nevertheless, the mechanisms of the temporal changes in gene expression and the subset of genes required for differentiation are still not fully appreciated. Previous microarray analysis of TPA-induced differentiation of HL-60 cells resulted in the identification of a large number of genes that showed altered expression (9). However, samples were only profiled at 0.5, 4 and 24 h after TPA treatment. Therefore, given the few time points examined in that study, more subtle patterns of the induction of gene expression by TPA were not effectively captured.
We report here more detailed time-course analyses and comparative expression profiling of the effects of TPA in HL-60 and its TPA-resistant mutant derivative HL-525 cells. Application of the algorithm of polynomial functions for regression modeling (see Materials and Methods) facilitated the identification of distinct temporal alterations in gene expression that can be distinguished as early-, intermediate- and late-response genes upon TPA treatment (Figs 2 and 3). TPA-induced sequential gene changes also seem to be hierarchical and coordinated. TPA treatment resulted in the induction of a cluster of mostly transcription factors and also growth factor stimulators leading the cascade in the early response phase, followed by the expression of a group of chemotactic factors and chemoattractants, some transcription factors, growth factors and protein kinases and phosphatases at the intermediate phase, and finally the coordinated response of genes of various biochemical pathways with distinct functional properties including maintenance of differentiation in the late phase in HL-60 cells. The transcription profile is also pyramidal, with a small number of genes activated in the early response cluster at the apex, followed by a modest, but substantial, increase in the intermediate cluster and a large number of late genes that confer and maintain the differentiation phenotype.
Early gene changes involving transcription factors such as JunD, FosB, EGR-1 and -2, KLF4 and TCF3 (Fig. 2) are in agreement with those reported in the literature. The expression of JunD has been shown to be associated with cell growth inhibition, which is consistent with the growth arrest observed with HL-60 cells undergoing differentiation (55). Increased expression of the transcription factors TCF3, which forms heterodimers with tissue-specific basic helix-loop-helix proteins and regulates early B-cell differentiation (19), and KLF4, which binds the CACCC core sequence and controls differentiation of epithelial cells (20), may further trigger the transcription of various downstream target genes that form the clusters of intermediate and late response genes. Some of these downstream gene changes observed in our results, including the downregulation of myeloperoxidase (25) and CD31 (56), increased expression of activin A (32), vimentin (27), filamin (39), the hematopoietic proteoglycan core protein (57), matrix metalloproteinase 2 (38) and its substrate galectin 3 (58,59), are indicative of TPA induced differentiation of HL-60 cells (Fig. 2) (60).
More importantly, comparative analysis between HL-60 and the TPA-resistant mutant HL-525 cells enabled us to identify the genes that may have specific roles in TPA-induced differentiation (Figs 2 and 3). Except for PKCβ, expression of various PKC isozymes (PKCα, -β, -γ, -δ, ε and -ζ) is comparable between HL-60 and HL-525 cells (41). Since HL-525 cells exhibit defective expression of PKCβ, we conclude that: (i) genes that were induced by TPA in HL-60 but not in HL-525 cells may be mediated by PKCβ; (ii) some of these genes may have specific roles in differentiation; (iii) genes that were induced by TPA in both HL-60 and HL-525 cells may not be important for differentiation; and (iv) genes selectively induced in HL-525 cells may play a role in preventing TPA-induced differentiation.
In addition to the deficiency in PKCβ, HL-525 cells are also defective in the expression of a myeloid-specific X-linked protein kinase, PRKX (61,62). It was shown further that PRKX is required for TPA-induced differentiation in HL-60 cells. PRKX expression is induced by TPA but requires the presence of PKCβ. Restoration of PRKX expression in the PKCβ-deficient HL-525 cells renders them sensitive to TPA-induced differentiation that is independent of PKCβ (62). Therefore, it is likely that the genes that are required for TPA-induced differentiation are downstream targets of PRKX.
With the loss of PKCβ, HL-525 responded to TPA differently from the wild-type HL-60 cells. The coordinated regulation of SAPK/JNK1, JNNK2 and MAP kinase 1, in HL-525 cells suggests a stress response to TPA (63). It has been shown that JNK1 influences the basal (unstimulated) growth of the human glioblastoma T98G cells (64), thus raising the possibility that activation of the SAPK and MAP kinase pathways may deter HL-525 cells from undergoing TPA-induced differentiation. Additionally, we observed that some of the TPA-induced gene changes in HL-525 cells are functionally similar to some genes in C.elegans that are required for cell division (54). Functional characterization of genes on chromosome III of the C.elegans genome using RNA-mediated interference and differential interference contrast microscopy revealed a subset of genes on this chromosome that are essential for proper cell division. Some of these genes induced by TPA in HL-525 cells include the DEAD-box RNA helicase, cullin, vacuolar H+-ATPase, coronin-like protein (actin-binding protein), ATP synthase γ subunit (H-type), NUP 88 (nucleoporin), ADP ribosylation factor 4 and the ADP/ATP mitochondrial carrier protein, all genes demonstrated to participate in cell division in C.elegans (54), further supporting that HL-525 cells did not undergo differentiation in response to TPA but continued on a course of normal growth.
Genes that are induced by TPA in both wild-type and mutant HL-60 cells, by this comparison, may not have roles in TPA-induced differentiation. For example, the rapid onset of induction of Ini1, which encodes a subunit of the SWI/SNF complex involving in ATP-dependent chromatin remodeling that facilitates the access of transcription factors to regulatory DNA sequences (65), in both HL-60 and HL-525 cells by TPA implicates the central role of Ini1 in priming the genome for the ensuing wave of gene expression mediated by the early response transcription factors, but excludes its role in TPA-induced differentiation.
We also realized that the transcription profiles observed with the HL-525 mutant might not be entirely influenced by the mutation in the PKCβ signaling pathway. It is likely that additional mutations might have been acquired in response to the selection with TPA, thereby giving rise to the unique expression profiles that may implicate their association with the resistance to differentiation, the stress response, and the incomplete erythrocytic differentiation pathway in response to TPA in HL-525 cells.
TPA-induced expression of most genes found in this study, including EGR-1 and -2, the diphtheria toxin receptor (heparin-binding epidermal growth factor-like growth factor), the small inducible cytokine A3 (macrophage inflammatory protein 1 α), TGF-β2, interleukin 8, activin A, myeloperoxidase, the proteases and various other genes, are in concordance with those in the literature as well as those reported in another expression profiling analysis (9). We have also identified gene changes that are not in agreement with published results. For example, Rantes, a chemokine that may play an autocrine role in mediating TPA-induced terminal differentiation, was found to be downregulated in response to TPA in our study, instead of being upregulated as reported earlier (66). The reason for this discrepancy is not known.
Querying the patterns of gene changes in response to TPA using DNA microarray has yielded a lucid chronological expression profile of TPA-induced differentiation and implication for the biological mechanisms of differentiation. Querying the transcription profile of the TPA-resistant cells lends further insights into genes that are involved in differentiation and the failure to elicit the expression of these genes in response to the TPA may be indicative of resistance to TPA-induced differentiation. In addition, selective TPA-induced expression of certain genes in the TPA-resistant cell line but not in TPA-sensitive cells may be important for the TPA-resistant phenotype. Clearly, with increasing clinical administration of TPA in patients, the signature expression profiles captured from our study may provide further understanding of the potential mechanisms of TPA resistance and ultimately may be predictive of response in the treatment myeloid leukemias.
SUPPLEMENTARY MATERIAL
Supplementary Material is available at NAR Online.
Acknowledgments
ACKNOWLEDGEMENTS
This work was supported by U.S. Public Health Service Grant CA 80826 from the National Institutes of Health to E.H.
REFERENCES
- 1.Tonetti D.A., Henning-Chubb,C., Yamanishi,D.T. and Huberman,E. (1994) Protein kinase C-beta is required for macrophage differentiation of human HL-60 leukemia cells. J. Biol. Chem., 269, 23230–23235. [PubMed] [Google Scholar]
- 2.Macfarlane D.E. and Manzel,L. (1994) Activation of beta-isozyme of protein kinase C (PKC beta) is necessary and sufficient for phorbol ester-induced differentiation of HL-60 promyelocytes. Studies with PKC beta-defective PET mutant. J. Biol. Chem., 269, 4327–4331. [PubMed] [Google Scholar]
- 3.Ito Y., Mishra,N.C., Yoshida,K., Kharbanda,S., Saxena,S. and Kufe,D. (2001) Mitochondrial targeting of JNK/SAPK in the phorbol ester response of myeloid leukemia cells. Cell Death Differ., 8, 794–800. [DOI] [PubMed] [Google Scholar]
- 4.Laouar A., Glesne,D. and Huberman,E. (2001) Protein kinase C-β, fibronectin, α5β1-integrin, and tumor necrosis factor-alpha are required for phorbol diester-induced apoptosis in human myeloid leukemia cells. Mol. Carcinog., 32, 195–205. [DOI] [PubMed] [Google Scholar]
- 5.Han Z.T., Zhu,X.X., Yang,R.Y., Sun,J.Z., Tian,G.F., Liu,X.J., Cao,G.S., Newmark,H.L., Conney,A.H. and Chang,R.L. (1998) Effect of intravenous infusions of 12-O-tetradecanoylphorbol-13-acetate (TPA) in patients with myelocytic leukemia: preliminary studies on therapeutic efficacy and toxicity. Proc. Natl Acad. Sci. USA, 95, 5357–5361. [DOI] [PMC free article] [PubMed] [Google Scholar]
- 6.Han Z.T., Tong,Y.K., He,L.M., Zhang,Y., Sun,J.Z., Wang,T.Y., Zhang,H., Cui,Y.L., Newmark,H.L., Conney,A.H. and Chang,R.L. (1998) 12-O-Tetradecanoylphorbol-13-acetate (TPA)-induced increase in depressed white blood cell counts in patients treated with cytotoxic cancer chemotherapeutic drugs. Proc. Natl Acad. Sci. USA, 95, 5362–5365. [DOI] [PMC free article] [PubMed] [Google Scholar]
- 7.Maki A., Mohammad,R.M., Smith,M. and Al-Katib,A. (1996) Role of ubiquitin carboxyl terminal hydrolase in the differentiation of human acute lymphoblastic leukemia cell line, Reh. Differentiation, 60, 59–66. [DOI] [PubMed] [Google Scholar]
- 8.Meinhardt G. and Hass,R. (1995) Differential expression of c-myc, max and mxi1 in human myeloid leukemia cells during retrodifferentiation and cell death. Leuk. Res., 19, 699–705. [DOI] [PubMed] [Google Scholar]
- 9.Tamayo P., Slonim,D., Mesirov,J., Zhu,Q., Kitareewan,S., Dmitrovsky,E., Lander,E.S. and Golub,T.R. (1999) Interpreting patterns of gene expression with self-organizing maps: methods and application to hematopoietic differentiation. Proc. Natl Acad. Sci. USA, 96, 2907–2912. [DOI] [PMC free article] [PubMed] [Google Scholar]
- 10.Homma Y., Henning-Chubb,C.B. and Huberman,E. (1986) Translocation of protein kinase C in human leukemia cells susceptible or resistant to differentiation induced by phorbol 12-myristate 13-acetate. Proc. Natl Acad. Sci. USA, 83, 7316–7319. [DOI] [PMC free article] [PubMed] [Google Scholar]
- 11.Zheng X., Chang,R.L., Cui,X.X., Kelly,K., Shih,W.J., Lin,Y., Strair,R., Suh,J.H., Han,Z.T., Rabson,A. and Conney,A.H. (2001) Synergistic effects of clinically achievable concentrations of 12-O-tetradecanoylphorbol-13-acetate in combination with all-trans retinoic acid, 1α, 25-dihydroxyvitamin D3 and sodium butyrate on differentiation in HL-60 cells. Oncol. Res., 12, 419–427. [PubMed] [Google Scholar]
- 12.Eisen M.B., Spellman,P.T., Brown,P.O. and Botstein,D. (1998) Cluster analysis and display of genome-wide expression patterns. Proc. Natl Acad. Sci. USA, 95, 14863–14868. [DOI] [PMC free article] [PubMed] [Google Scholar]
- 13.Lord K.A., Abdollahi,A., Hoffman-Liebermann,B. and Liebermann,D.A. (1993) Proto-oncogenes of the fos/jun family of transcription factors are positive regulators of myeloid differentiation. Mol. Cell. Biol., 13, 841–851. [DOI] [PMC free article] [PubMed] [Google Scholar]
- 14.Heximer S.P., Cristillo,A.D., Russell,L. and Forsdyke,D.R. (1996) Sequence analysis and expression in cultured lymphocytes of the human FOSB gene (G0S3). DNA Cell Biol., 15, 1025–1038. [DOI] [PubMed] [Google Scholar]
- 15.Guazzi S., Price,M., De Felice,M., Damante,G., Mattei,M.G. and Di Lauro,R. (1990) Thyroid nuclear factor 1 (TTF-1) contains a homeodomain and displays a novel DNA binding specificity. EMBO J., 9, 3631–3639. [DOI] [PMC free article] [PubMed] [Google Scholar]
- 16.Kamps M.P., Murre,C., Sun,X.H. and Baltimore,D. (1990) A new homeobox gene contributes the DNA binding domain of the t(1;19) translocation protein in pre-B ALL. Cell, 60, 547–555. [DOI] [PubMed] [Google Scholar]
- 17.Yet S.F., McA’Nulty,M.M., Folta,S.C., Yen,H.W., Yoshizumi,M., Hsieh,C.M., Layne,M.D., Chin,M.T., Wang,H., Perrella,M.A., Jain,M.K. and Lee,M.E. (1998) Human EZF, a Kruppel-like zinc finger protein, is expressed in vascular endothelial cells and contains transcriptional activation and repression domains. J. Biol. Chem., 273, 1026–1031. [DOI] [PubMed] [Google Scholar]
- 18.Zahraoui A., Touchot,N., Chardin,P. and Tavitian,A. (1989) The human Rab genes encode a family of GTP-binding proteins related to yeast YPT1 and SEC4 products involved in secretion. J. Biol. Chem., 264, 12394–12401. [PubMed] [Google Scholar]
- 19.Steube K.G., Meyer,C. and Drexler,H.G. (2000) Induction and secretion of the chemokines interleukin-8 and monocyte chemotactic protein-1 in human immature leukemia cell lines. Mol. Cell. Biol. Res. Commun., 3, 60–65. [DOI] [PubMed] [Google Scholar]
- 20.Bruserud O. and Gjertsen,B.T. (2000) New strategies for the treatment of acute myelogenous leukemia: differentiation induction-present use and future possibilities. Stem Cells, 18, 157–165. [DOI] [PubMed] [Google Scholar]
- 21.Kharbanda S., Nakamura,T., Stone,R., Hass,R., Bernstein,S., Datta,R., Sukhatme,V.P. and Kufe,D. (1991) Expression of the early growth response 1 and 2 zinc finger genes during induction of monocytic differentiation. J. Clin. Invest., 88, 571–577. [DOI] [PMC free article] [PubMed] [Google Scholar]
- 22.Krishnaraju K., Hoffman,B. and Liebermann,D.A. (1998) The zinc finger transcription factor Egr-1 activates macrophage differentiation in M1 myeloblastic leukemia cells. Blood, 92, 1957–1966. [PubMed] [Google Scholar]
- 23.Rohan P.J., Davis,P., Moskaluk,C.A., Kearns,M., Krutzsch,H., Siebenlist,U. and Kelly,K. (1993) PAC-1: a mitogen-induced nuclear protein tyrosine phosphatase. Science, 259, 1763–1766. [DOI] [PubMed] [Google Scholar]
- 24.Herblot S., Vekris,A., Rouzaut,A., Najeme,F., de Miguel,C., Bezian,J.H. and Bonnet,J. (1997) Selection of down-regulated sequences along the monocytic differentiation of leukemic HL60 cells. FEBS Lett., 414, 146–152. [DOI] [PubMed] [Google Scholar]
- 25.Garcia de Herreros A., Fabre,M., Batlle,E., Balague,C. and Real,F.X. (1993) The tumor promoter 12-O-tetradecanoylphorbol-13-acetate blocks differentiation of HT-29 human colon cancer cells. J. Cell Sci., 105, 1165–1172. [DOI] [PubMed] [Google Scholar]
- 26.Dellagi K. and Brouet,J.C. (1984) Alteration of vimentin intermediate filaments expression during differentiation of HL60 and U937 human leukemic cell lines. Leuk. Res., 8, 611–616. [DOI] [PubMed] [Google Scholar]
- 27.Yamada R., Suzuki,T., Hashimoto,M., Eto,Y., Shiokawa,K. and Muramatsu,M. (1992) Induction of differentiation of the human promyelocytic cell line HL-60 by activin/EDF. Biochem. Biophys. Res. Commun., 187, 79–85. [DOI] [PubMed] [Google Scholar]
- 28.Yu J., Maderazo,L., Shao,L.E., Frigon,N.L., Vaughan,J., Vale,W. and Yu,A. (1991) Specific roles of activin/inhibin in human erythropoiesis in vitro. Ann. N. Y. Acad. Sci., 628, 199–211. [DOI] [PubMed] [Google Scholar]
- 29.Alitalo R., Makela,T.P., Koskinen,P., Andersson,L.C. and Alitalo,K. (1988) Enhanced expression of transforming growth factor beta during megakaryoblastic differentiation of K562 leukemia cells. Blood, 71, 899–906. [PubMed] [Google Scholar]
- 30.Massague J. (1992) Receptors for the TGF-beta family. Cell, 69, 1067–1070. [DOI] [PubMed] [Google Scholar]
- 31.Jay P., Ji,J.W., Marsollier,C., Taviaux,S., Berge-Lefranc,J.L. and Berta,P. (1996) Cloning of the human homologue of the TGF beta-stimulated clone 22 gene. Biochem. Biophys. Res. Commun., 222, 821–826. [DOI] [PubMed] [Google Scholar]
- 32.van der Kruijssen C.M., Feijen,A., Huylebroeck,D. and van den Eijnden-van Raaij,A.J. (1993) Modulation of activin expression by type beta transforming growth factors. Exp. Cell Res., 207, 407–412. [DOI] [PubMed] [Google Scholar]
- 33.Dinarello C.A. (1996) Biologic basis for interleukin-1 in disease. Blood, 87, 2095–2147. [PubMed] [Google Scholar]
- 34.Schlegel W., Mollard,P., Demaurex,N., Theler,J.M., Chiavaroli,C., Guerineau,N., Vacher,P., Mayr,G., Krause,K.H., Wollheim,C.B., et al. (1993) Calcium signalling: comparison of the role of Ca2+ influx in excitable endocrine and non-excitable myeloid cells. Adv. Second Messenger Phosphoprotein Res., 28, 143–152. [PubMed] [Google Scholar]
- 35.Donato R. (2001) S100: a multigenic family of calcium-modulated proteins of the EF-hand type with intracellular and extracellular functional roles. Int. J. Biochem. Cell Biol., 33, 637–668. [DOI] [PubMed] [Google Scholar]
- 36.Chang C. and Werb,Z. (2001) The many faces of metalloproteases: cell growth, invasion, angiogenesis and metastasis. Trends Cell Biol., 11, S37–S43. [DOI] [PMC free article] [PubMed] [Google Scholar]
- 37.Andreasen P.A., Egelund,R. and Petersen,H.H. (2000) The plasminogen activation system in tumor growth, invasion, and metastasis. Cell Mol. Life Sci., 57, 25–40. [DOI] [PMC free article] [PubMed] [Google Scholar]
- 38.Xie B., Laouar,A. and Huberman,E. (1998) Autocrine regulation of macrophage differentiation and 92-kDa gelatinase production by tumor necrosis factor-α via α5β1 integrin in HL-60 cells. J. Biol. Chem., 273, 11583–11588. [DOI] [PubMed] [Google Scholar]
- 39.Watts R.G. (1995) Role of gelsolin in the formation and organization of triton-soluble F-actin during myeloid differentiation of HL-60 cells. Blood, 85, 2212–2221. [PubMed] [Google Scholar]
- 40.Homma Y., Gemmell,M.A. and Huberman,E. (1988) Protein kinase C activities with different characteristics, including substrate specificity, from two human HL-60 leukemia cell variants. Cancer Res., 48, 2744–2748. [PubMed] [Google Scholar]
- 41.Tonetti D.A., Horio,M., Collart,F.R. and Huberman,E. (1992) Protein kinase C beta gene expression is associated with susceptibility of human promyelocytic leukemia cells to phorbol ester-induced differentiation. Cell Growth Differ., 3, 739–745. [PubMed] [Google Scholar]
- 42.Derijard B., Hibi,M., Wu,I.H., Barrett,T., Su,B., Deng,T., Karin,M. and Davis,R.J. (1994) JNK1: a protein kinase stimulated by UV light and Ha-Ras that binds and phosphorylates the c-Jun activation domain. Cell, 76, 1025–1037. [DOI] [PubMed] [Google Scholar]
- 43.Wu Z., Wu,J., Jacinto,E. and Karin,M. (1997) Molecular cloning and characterization of human JNKK2, a novel Jun NH2-terminal kinase-specific kinase. Mol. Cell. Biol., 17, 7407–7416. [DOI] [PMC free article] [PubMed] [Google Scholar]
- 44.Tang T.K., Leto,T.L., Correas,I., Alonso,M.A., Marchesi,V.T. and Benz,E.J.,Jr (1998) Selective expression of an erythroid-specific isoform of protein 4.1. Proc. Natl Acad. Sci. USA, 85, 3713–3717. [DOI] [PMC free article] [PubMed] [Google Scholar]
- 45.Owsianka A.M. and Patel,A.H. (1999) Hepatitis C virus core protein interacts with a human DEAD box protein DDX3. Virology, 257, 330–340. [DOI] [PubMed] [Google Scholar]
- 46.Gu Z., Moerschell,R.P., Sherman,F. and Goldfarb,D.S. (1992) NIP1, a gene required for nuclear transport in yeast. Proc. Natl Acad. Sci. USA, 89, 10355–10359. [DOI] [PMC free article] [PubMed] [Google Scholar]
- 47.Morrisey E.E., Ip,H.S., Lu,M.M. and Parmacek,M.S. (1996) GATA-6: a zinc finger transcription factor that is expressed in multiple cell lineages derived from lateral mesoderm. Dev. Biol., 177, 309–322. [DOI] [PubMed] [Google Scholar]
- 48.Dworniczak B. and Mirault,M.E. (1987) Structure and expression of a human gene coding for a 71 kd heat shock ‘cognate’ protein. Nucleic Acids Res., 15, 5181–5197. [DOI] [PMC free article] [PubMed] [Google Scholar]
- 49.Vitelli R., Santillo,M., Lattero,D., Chiariello,M., Bifulco,M., Bruni,C.B. and Bucci,C. (1997) Role of the small GTPase Rab7 in the late endocytic pathway. J. Biol. Chem., 272, 4391–4397. [DOI] [PubMed] [Google Scholar]
- 50.Holthuis J.C., van Riel,M.C. and Martens,G.J. (1995) Translocon-associated protein TRAP delta and a novel TRAP-like protein are coordinately expressed with pro-opiomelanocortin in Xenopus intermediate pituitary. Biochem. J., 312, 205–213. [DOI] [PMC free article] [PubMed] [Google Scholar]
- 51.Izaurralde E. (2001) Friedrich Miescher Prize awardee lecture review. A conserved family of nuclear export receptors mediates the exit of messenger RNA to the cytoplasm. Cell Mol. Life Sci., 58, 1105–1112. [DOI] [PMC free article] [PubMed] [Google Scholar]
- 52.Dyer R.B. and McMurray,C.T. (2001) Mutant protein in Huntington disease is resistant to proteolysis in affected brain. Nature Genet., 29, 270–278. [DOI] [PubMed] [Google Scholar]
- 53.Mathew S., Scanlan,M.J., Mohan Raj,B.K., Murty,V.V., Garin-Chesa,P., Old,L.J., Rettig,W.J. and Chaganti,R.S. (1995) The gene for fibroblast activation protein alpha (FAP), a putative cell surface-bound serine protease expressed in cancer stroma and wound healing, maps to chromosome band 2q23. Genomics, 25, 335–337. [DOI] [PubMed] [Google Scholar]
- 54.Gonczy P., Echeverri,G., Oegema,K., Coulson,A., Jones,S.J., Copley,R.R., Duperon,J., Oegema,J., Brehm,M., Cassin,E., Hannak,E., Kirkham,M., Pichler,S., Flohrs,K., Goessen,A., Leidel,S., Alleaume,A.M., Martin,C., Ozlu,N., Bork,P. and Hyman,A.A. (2000) Functional genomic analysis of cell division in C. elegans using RNAi of genes on chromosome III. Nature, 408, 331–336. [DOI] [PubMed] [Google Scholar]
- 55.Pfarr C.M., Mechta,F., Spyrou,G., Lallemand,D., Carillo,S. and Yaniv,M. (1994) Mouse JunD negatively regulates fibroblast growth and antagonizes transformation by ras. Cell, 76, 747–760. [DOI] [PubMed] [Google Scholar]
- 56.Trayner I.D., Bustorff,T., Etches,A.E., Mufti,G.J., Foss,Y. and Farzaneh,F. (1998) Changes in antigen expression on differentiating HL60 cells treated with dimethylsulphoxide, all-trans retinoic acid, α1,25-dihydroxyvitamin D3 or 12-O-tetradecanoyl phorbol-13-acetate. Leuk. Res., 22, 537–547. [DOI] [PubMed] [Google Scholar]
- 57.Stellrecht C.M., Fraizer,G., Selvanayagam,C., Chao,L.Y., Lee,A. and Saunders,G.F. (1993) Transcriptional regulation of a hematopoietic proteoglycan core protein gene during hematopoiesis. J. Biol. Chem., 268, 4078–4084. [PubMed] [Google Scholar]
- 58.Lotan R., Carralero,D., Lotan,D. and Raz,A. (1989) Biochemical and immunological characterization of K-1735P melanoma galactoside-binding lectins and their modulation by differentiation inducers. Cancer Res., 49, 1261–1268. [PubMed] [Google Scholar]
- 59.Ochieng J., Fridman,R., Nangia-Makker,P., Kleiner,D.E., Liotta,L.A., Stetler-Stevenson,W.G. and Raz,A. (1994) Galectin-3 is a novel substrate for human matrix metalloproteinases-2 and -9. Biochemistry, 33, 14109–14114. [DOI] [PubMed] [Google Scholar]
- 60.Collins S.J. (1987) The HL-60 promyelocytic leukemia cell line: proliferation, differentiation, and cellular oncogene expression. Blood, 70, 1233–1244. [PubMed] [Google Scholar]
- 61.Klink A., Schiebel,K., Winkelmann,M., Rao,E., Horsthemke,B., Ludecke,H.J., Claussen,U., Scherer,G. and Rappold,G. (1995) The human protein kinase gene PKX1 on Xp22.3 displays Xp/Yp homology and is a site of chromosomal instability. Hum. Mol. Genet., 4, 869–878. [DOI] [PubMed] [Google Scholar]
- 62.Semizarov D., Glesne,D., Laouar,A., Schiebel,K. and Huberman,E. (1998) A lineage-specific protein kinase crucial for myeloid maturation. Proc. Natl Acad. Sci. USA, 95, 15412–15417. [DOI] [PMC free article] [PubMed] [Google Scholar]
- 63.Tibbles L.A. and Woodgett,J.R. (1999) The stress-activated protein kinase pathways. Cell Mol. Life Sci., 55, 1230–1254. [DOI] [PMC free article] [PubMed] [Google Scholar]
- 64.Potapova O., Gorospe,M., Bost,F., Dean,N.M., Gaarde,W.A., Mercola,D. and Holbrook,N.J. (2000) c-Jun N-terminal kinase is essential for growth of human T98G glioblastoma cells. J. Biol. Chem., 275, 24767–24775. [DOI] [PubMed] [Google Scholar]
- 65.Muchardt C. and Yaniv,M. (1999) The mammalian SWI/SNF complex and the control of cell growth. Semin. Cell Dev. Biol., 10, 189–195. [DOI] [PubMed] [Google Scholar]
- 66.Appay V. and Rowland-Jones,S.L. (2001) RANTES: a versatile and controversial chemokine. Trends Immunol., 22, 83–87. [DOI] [PubMed] [Google Scholar]
Associated Data
This section collects any data citations, data availability statements, or supplementary materials included in this article.