Abstract
A fundamental problem in DNA microarray analysis is the lack of a common standard to compare the expression levels of different samples. Several normalization protocols have been proposed to overcome variables inherent in this technology. As yet, there are no satisfactory methods to exchange gene expression data among different research groups or to compare gene expression values under different stimulus–response profiles. We have tested a normalization procedure based on comparing gene expression levels to the signals generated from hybridizing genomic DNA (genomic normalization). This procedure was applied to DNA microarrays of Mycobacterium tuberculosis using RNA extracted from cultures growing to the logarithmic and stationary phases. The applied normalization procedure generated reproducible measurements of expression level for 98% of the putative mycobacterial ORFs, among which 5.2% were significantly changed comparing the logarithmic to stationary growth phase. Additionally, analysis of expression levels of a subset of genes by real time PCR technology revealed an agreement in expression of 90% of the examined genes when genomic DNA normalization was applied instead of 29–68% agreement when RNA normalization was used to measure the expression levels in the same set of RNA samples. Further examination of microarray expression levels displayed clusters of genes differentially expressed between the logarithmic, early stationary and late stationary growth phases. We conclude that genomic DNA standards offer advantages over conventional RNA normalization procedures and can be adapted for the investigation of microbial genomes.
INTRODUCTION
DNA microarray technology (oligo and spotted microarrays) has become widely accepted for gene expression profiling (1,2). There is a growing interest in applying such technologies to investigate the transcription profiles of infectious agents on a genome-wide level to develop new vaccines and drugs to combat infectious disease. A leading candidate for this approach is Mycobacterium tuberculosis, the causative agent of human tuberculosis, responsible for 3 million annual mortalities (3). However, microarray analysis has a number of problems, including spotting efficiency, sample labeling efficiency, transcript representation and hybridization reproducibility (4), which are amplified with the analysis of mixed RNA samples from infected tissues. We propose an alternative procedure for array hybridization that may circumvent some problems resulting from variables associated with DNA microarrays.
Microarrays consist of in situ/pre-synthesized oligonucleotides or spotted cDNA representing all or a portion of expressed genes in an organism arrayed onto chemically treated glass slides or any other solid surface (5). Typically, transcripts from a variety of states are labeled with one of two dyes and pair-wise comparisons of relative changes in gene expression are estimated after co-hybridization to the same set of spotted arrays. There are a number of methods used to normalize these pair-wise comparisons. Current protocols for microarray data normalization use a ‘control’ RNA sample from a particular tissue or time point (RNA normalization), a pool of ‘grouped’ RNA samples from different tissues or different time points (6,7), or a subset of control ‘reference’ genes (8) of known transcription profile. There are several problems with these approaches. For example, only genes with hybridization signals from both RNA samples can be used to generate relative expression levels. Signals observed from only one RNA sample are discarded. Under some growth conditions, the transcription levels of some genes will be undetectable (or very low), resulting in unmeasurable relative expression levels. Furthermore, for microbial systems, the ‘grouped RNA normalization’ procedure may require pooling RNA from 20 or 30 experimental conditions at different growth phases. Comparisons of results to any new experimental condition would require a new control pool or a new set of hybridizations. Alternatively, using ‘control genes’ for microarray data normalization is subject to the problem of choosing the right control genes, especially when even ‘housekeeping genes’ can fluctuate under some experimental conditions (9). Even when a set of reference genes or an RNA pool is agreed upon for array analysis, the production of such control samples may vary from one experiment to another and from one laboratory to another.
In response to these problems, we have explored an alternative procedure for array hybridization. In this procedure, hybridization signals from cDNA (prepared from total RNA) are normalized to signals generated from genomic DNA (gDNA) from the same organism. The proposed normalization protocol was applied to cultures of M.tuberculosis grown to either logarithmic or stationary phase. We found that a higher reproducibility and wider dynamic range are achievable using genomic normalization compared to an RNA normalization protocol.
MATERIALS AND METHODS
Construction of DNA microarrays
We designed DNA microarrays by arraying an oligonucleotide set purchased from Operon Technologies (Alameda, CA), representing the whole genome of M.tuberculosis. The oligonucleotides were chosen using a proprietary algorithm (Operon Technologies) for selecting unique 70mers for each open reading frame (ORF) predicted in the published sequence of M.tuberculosis strain H37Rv (10) with an optimized melting temperature of 79°C (±5°C). All oligonucleotides were resuspended in 3× SSC at a concentration of 40 µM using the liquid handling station Biomek 2000 (Beckman Coulter, Fullerton, CA). Resuspended oligonucleotides were spotted onto poly-l-lysine-coated glass slides (11) using a custom-built robotic arrayer (Magna Arrayer) assembled at the University of Texas Southwestern Medical Center (http://microarray.swmed.edu/technology.htm) that generates microarrays with a DNA spot size of 150–200 µm in diameter.
Sample preparation and slide hybridizations
Mycobacterium tuberculosis H37Rv (ATCC no. 25618) was obtained from American Type Cell Culture. Logarithmic and stationary phase cultures for preparing RNA samples were grown in 7H9 medium supplemented with 10% OADC, at 37°C, and harvested at 14, 28 and 50 days. Total RNA was extracted from mycobacterial cultures in TRI reagent (Molecular Research Center, Cincinnati, OH) using 0.1 mm silica/zirconium beads in a BioSpec Mini-Beadbeater. RNA pellets were washed with cold 75% ethanol, air dried, and then resuspended in 50 µl of H2O pretreated with diethyl pyrocarbonate. RNA samples (7 µg each) (12) were labeled using a FairPlay Microarray labeling kit (Stratagene, La Jolla, CA) and Cy3 or Cy5 monofunctional dye (Amersham Pharmacia Biotech, Arlington Hights, IL) according to the manufacturer’s protocol. The M.tuberculosis cDNA was labeled using a minimal set of 37 mycobacterial genome-directed primers (mtGDP, 250 ng/µl) designed specifically to prime all ORFs in the sequenced M.tuberculosis genome (13).
To label the gDNA, three methods were compared. In the first, a standard nick translation reaction was used to generate randomly labeled DNA fragments (2 µg DNA of ∼500 bp) with Cy5 fluorescent dye according to the manufacturer’s protocol (Promega, Madison, WI). In the second method, mycobacterial gDNA (2 µg/reaction) was labeled using Taq polymerase (Promega) and mtGDP in the presence of Cy3-dCTP nucleotide and 200 nM dNTP (final concentration). We allowed only 15 cycles of denaturation at 94°C for 1 min, annealing at 45°C for 1 min and extension at 72°C for 2 min. The same amount of gDNA (2 µg) was used in the third labeling protocol where the Klenow fragment of DNA polymerase (Gibco BRL, Gaithersburg, MD) and random primers (or mtGDP) were used as previously reported (14). After the labeling reactions were completed, unincorporated nucleotides were removed from the labeled samples by passage over a gel filtration spin column (CentriFlex gel filtration cartridge; Edge Biosystem, Gaithersburg, MD) or centricon concentrators (Amicon, Beverly, MA) according to the manufacturer’s recommendations.
Equal volumes of the Cy3- and Cy5-labeled analytes (20 µl each) were adjusted to a final concentration of 4× SSC, 0.1% SDS and co-hybridized to the microarray glass slides overnight at 67°C using specialized hybridization chambers (Telechem Inc., Sunnyvale, CA). The slides were washed for 5 min at room temperature in low stringency buffer (1× SSC, 0.1% SDS) followed by a 5 min wash in a high stringency buffer (0.1× SSC) and drying by centrifugation at 1000 r.p.m. for 5 min.
Hybridization signal acquisition and data filtration
After hybridization, the microarray slides were scanned using a commercial laser scanner (GenePix4000; Axon Instruments Inc., Foster City, CA) with independent excitation of the fluorophores Cy3 and Cy5. The signal and background fluorescence intensities were calculated for each DNA spot using image analysis software (GenPixPro 3.0; Axon Instruments) by averaging the intensities of every pixel inside the target region (segmentation method). The signal intensity for each spot is the difference between the average signal intensity and the average local background intensity. All of the hybridizations were repeated at least four times and the data used for analysis were from two different cultures from the same growth phase employing the same RNA extraction and labeling protocols. For each of the hybridizations, signals below the threshold level (the mean background level of the whole experiment + SD) in the gDNA channel or from flagged spots (bad or undetectable spots) were rejected for further analysis (for the genomic normalization protocol). However, signals below the threshold level in the cDNA channel (for genomic or RNA normalizations) were set to the threshold level to avoid spurious expression ratios as suggested earlier (15,16). The data were then filtered by rejecting any genes that did not still have at least two spots in either logarithmic or stationary phase samples. The same ‘filters’ applied to the ratios (cDNAtest/gDNA) generated by genomic normalization were applied to the ratios (cDNAtest/cDNAcontrol) generated by the RNA normalization procedure.
Statistical analysis of gene expression levels
Following data filtration and signal ratio calculations, per chip normalizations were performed using the 50th percentile of all measurements for different hybridizations to make comparisons between different experiments valid. Addition ally, each gene was normalized to itself by making a synthetic positive control for that gene and dividing all measurements for that gene by this positive control. This synthetic control was the median of the gene’s expression values over all sample replicates. All data normalization and statistical analysis were performed using GeneSpring v.4.1 (Silicon Genetics, Redwood City, CA). A Kruskal–Wallis (non-parametric) test for testing of genes with significant expression levels at P < 0.01 was chosen to compare expression levels between both logarithmic and stationary phase samples.
Finally, hierarchical cluster analysis (17) was performed on Z scores calculated for each gene from the simple ratios of the hybridization signals (cDNA/gDNA). Z-score conversion was necessary to ‘center’ all expression levels around mean = 0 to obtain the ‘standard gene expression levels’ that are amenable to comparison between different samples. This approach is similar to the Z-score modeling approach suggested by Thomas et al. (18). The following formula was used to calculate the Z scores (19):
Z = (j1 – j¯)/σ1
where Z is the Z score for gene j1, j¯ is the mean ratios for all j genes and σ is the standard deviation from the mean.
Real time, quantitative PCR
To verify the fold change in gene expression estimated using microarray analysis, we used an amplification-based strategy, quantitative real time PCR (20). For each amplification run, the calculated threshold cycle (Ct) for each gene amplification was normalized to Ct of the 16S rRNA gene amplified from the corresponding sample before calculating the fold change from logarithmic to stationary phase using the following formula:
fold change = 2–ΔΔCt2
where ΔΔCt for gene j = (Ct,j – Ct,16S rRNA)logarithmic phase – (Ct,j – Ct,16S rRNA)stationary phase.
RESULTS
Evaluation of M.tuberculosis oligonucleotides arrays
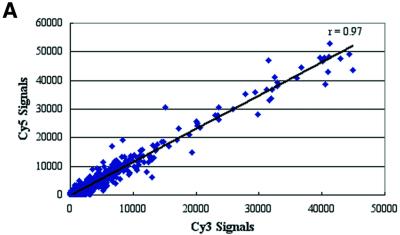
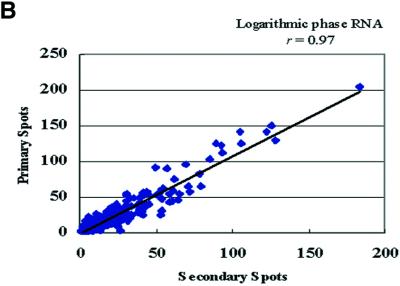
There is a growing interest in using whole-genome analysis for studying microbial expression profiles in vitro (21) and in vivo (13) to provide a better understanding of their molecular pathogenesis. We constructed M.tuberculosis oligonucleotide arrays representing 100% of the predicted ORFs of the sequenced genome of M.tuberculosis strain H37Rv (http://genolist.pasteur.fr/TubercuList). Onto each glass slide, the whole genome was printed twice in two different locations on the slide (primary and secondary spots) to check for hybridization consistency and increase the number of experimental replicates. Since using spotted (pre-synthesized) oligonucleotide arrays is relatively new for microbial genomes, we examined the hybridization signal quality and reproducibility of hybridizations using mycobacterial nucleic acids. To test for any biased incorporation of either fluorophores used for labeling M.tuberculosis RNA or gDNA, we labeled equal amounts of the same batch of total RNA or gDNA with either Cy3 or Cy5 fluorophores. Analytes (labeled samples) from the same starting materials (RNA or gDNA) but with different labeling fluorophores were hybridized to the same arrays. Signal intensities from analytes labeled with either Cy3 or Cy5 fluorophores were very similar with a correlation coefficient (r) >0.9 (Fig. 1A). The high r value demonstrates the unbiased incorporation of either fluorophore (Cy3 or Cy5) into M.tuberculosis RNA or gDNA when used to hybridize to the M.tuberculosis arrays. Additional analysis of the signal ratios generated from the hybridization signals of both replicates of the DNA spots revealed reproducible signals above the background levels, with r > 0.9 (Fig. 1B) indicating homogeneous sample hybridization to the DNA microarrays.
Figure 1.
Linear regression analysis of signals from different hybridizations to oligonucleotides microarrays. The scatter plots show true signals (signals above background) generated from the labeled cDNA (A) with either Cy3 or Cy5 fluorophores. Similar results were obtained for genomic DNA hybridizations (r = 0.93) (data not shown). (B) Scatter plot represents the correlation of signal ratios generated from duplicate spots (primary and secondary) of the oligonucleotides co-hybridized to genomic DNA and logarithmic phase RNA analytes. Pearson’s correlation coefficients (r) are indicated in each panel.
In almost all genes, signals generated from RNA samples were higher than signals generated from genomic DNA samples because of the presence of multiple transcripts/genes in RNA samples in contrast to the mainly single copies of genes available with gDNA labeling. However, in all of the hybridizations, the labeled gDNA analytes generated true signals (above background) in 85 to >99% of the mycobacterial predicted ORFs (depending on the labeling protocol and the amount of labeled analytes; see below), while only 45–70% of predicted ORFs showed true signals using the cDNA analytes, depending on the source of the RNA sample used for hybridization.
Genomic normalization for expression profiling
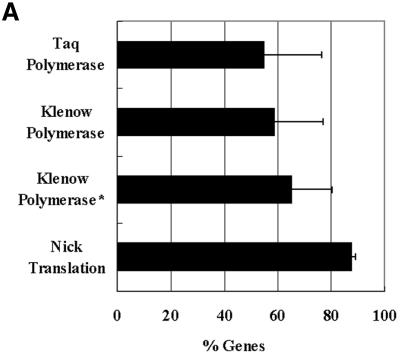
For the traditional RNA normalizaton protocol used in most spotted-microarray analyses, the expression levels detected for ‘test’ RNA sample are compared to another ‘control’ RNA sample to calculate relative expression levels. Additional fluorophore switching (color switching) experiments are required for each pair of samples to verify the expression levels. The method we have developed uses signals generated from hybridizing labeled gDNA as the ‘control’ sample to measure relative gene expression for the ‘test’ RNA sample. To test for optimum labeling protocols of mycobacterial gDNA (the control sample for genomic normalization), three different protocols were compared for labeling the same batch of mycobacterial gDNA and the whole experiment was repeated twice. The signals of Cy3-labeled gDNA with either Klenow or Taq polymerases were compared to the signals of Cy5-labeled gDNA with nick translation protocol after co-hybridization to the same oligonucleotide arrays. Using the same amount of gDNA (2 µg/reaction), the nick translation labeling protocol was superior to either the Klenow fragment or Taq DNA polymerase labeling protocols in both the generated signal intensity and the number of spots detected on the array (Fig. 2A). Additionally, we modified the Klenow fragment DNA polymerase procedure (14) to include mtGDP (13) instead of random primers (Klenow fragment plus). However, this modification had no significant effect on the percentage of genome coverage. The overall signal intensity generated by nick translation-labeled gDNA was nearly 2.5-fold higher than the signal generated by labeled gDNA produced using the other two techniques. In all subsequent experiments, we used the nick translation protocol to label gDNA with the Cy5 fluorophore and co-hybridize with Cy3-labeled cDNA generated from different RNA samples.
Figure 2.
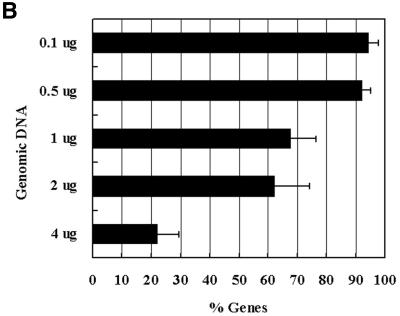
Optimum labeling/hybridization protocol for genomic normalization. (A) A histogram representing the percentage of genes with significant hybridization signals generated from different labeling protocols using equal amounts of mycobacterial genomic DNA. Short bars represent ± 1 SD. (B) A histogram showing the percentage of the mycobacterial transcriptome detected using varying concentrations of the labeled gDNA co-hybridized with the same amounts of labeled cDNA (a mix synthesized from logarithmic and stationary phase RNAs, equivalent to 7 µg of starting total RNA). Only genes with signals above the threshold level (true signals) in the cDNA channel were compared to the true signals in the gDNA channel.
In a co-hybridization protocol for spotted microarrays, both analytes compete to hybridize to the same DNA target (oligonucleotide spots). Consequently, increasing the amount of one sample can reduce the chance of hybridization for the second sample. To determine the optimal amounts of gDNA to be co-hybridized with the cDNA, decreasing amounts of labeled gDNA (prepared in one nick translation reaction) were co-hybridized with fixed amounts of labeled cDNA which was prepared from 7 µg total RNA (the same amount used for a typical RNA normalization protocol). The cDNA was generated from a mix of total RNA from logarithmic and stationary phase cultures, so most of the genes would be expressed and represented in the cDNA sample. As is evident in Figure 2B, an increasing number of genes were detected as less gDNA was used for normalization. Approximately 22% of the genes were detected using 4 µg of gDNA compared to 92% with 0.5 µg of gDNA. There was no significant difference between using 0.5 and 0.1 µg gDNA, however, ∼67% of the spots were at the threshold level of signal detection using 0.1 µg of gDNA compared to only ∼10% when 0.5 µg of gDNA was used. It is possible that the signals generated from gDNA hybridization may saturate the oligonucleotide sites competing for the labeled cDNA. Therefore, it may be necessary to empirically determine the optimal amount of gDNA used to hybridize each investigated genome.
To test for the hybridization reproducibility when gDNA is used as a normalizer, gDNA analytes labeled with a Cy5 fluorophore and Cy3-labeled cDNA synthesized from either logarithmic or stationary phase RNA were co-hybridized to the M.tuberculosis oligonucleotide arrays. Comparing the raw signal ratios (before normalization) of labeled analytes (Cy3/Cy5) generated from two different bacterial cultures, a high correlation level was obtained (r > 0.8) regardless of the source of the RNA sample (logarithmic or stationary phase cultures). In keeping with these results, we used 0.5 µg of nick translation-labeled gDNA for normalizing the expression levels of genes in subsequent experiments.
Comparing different protocols for expression data normalization
Once we established a protocol for genomic normalization to measure gene expression, this protocol was compared to the conventional one of co-hybridizing two cDNA samples. For this comparison we used RNA extracted from M.tuberculosis cultures growing in a synthetic medium (Middlebrook 7H9) from the mid-logarithmic to late stationary growth phases. The same RNA samples used to evaluate the genomic normalization protocol were also used for the RNA normalization protocol. For genomic normalization, the ratios of logarithmic to stationary phase cDNAs were estimated after dividing the primary ratios of the logarithmic phase samples (relative to gDNA) by the primary ratios of the stationary phase samples. For RNA normalization, we used logarithmic phase RNA as the ‘control’ sample (labeled with Cy3) while the stationary phase RNA was treated as the ‘test’ sample (labeled with Cy5) and vice versa (color-switching experiment).
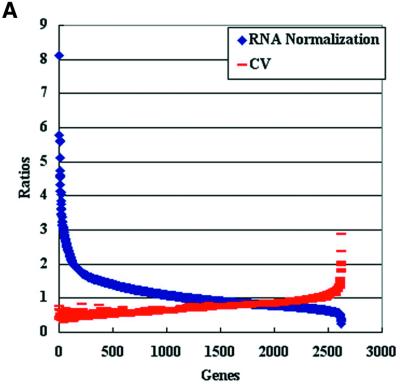
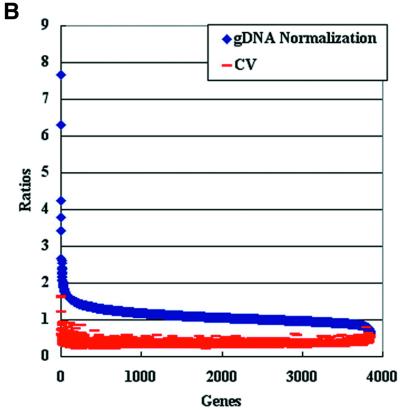
As detailed in Table 1, the percentage of detectable gene expression levels varied according to the normalization procedure used, with the highest detection level (98%) obtained when the genomic normalization protocol was applied. When RNA normalization procedures were applied, the total percentages of expressed genes dropped to 67% even after the color reversal experiments. Additionally, a low correlation level was obtained (r = 0.25) between fold changes calculated from the color-switching experiments. Taniguchi et al. (22) also experienced a low correlation between expression level in several mouse genes when color reversal experiments were conducted on the cDNA microarrays. Interestingly, when coefficient of variance (CV) was used to evaluate the reproducibility of gene expression levels (23,24) for RNA-normalized samples, genes with low expression ratios gave the highest CV values (Fig. 3A). In contrast, the CV values remained unchanged when the genomic normalization protocol was applied (Fig. 3B).
Table 1. The expression profile of M.tuberculosis growing to either logarithmic or stationary phase using different normalization procedures.
| Genomic normalization | Stationary normalization | Logarithmic normalization | |
|---|---|---|---|
| Expressed genesa | 3847 (98.0%) | 2637 (67.2%) | 2622 (66.8%) |
| Significant changes (P < 0.01)b | 207 (5.2%) | 123 (3.1%) | 115 (2.9%) |
| Logarithmic phase (>2-fold) | 123 (3.1%) | 46 (1.1%) | 316 (8.0%) |
| Stationary phase (>2-fold) | 38 (0.9) | 315 (8.0%) | 199 (5.0%) |
| RT–PCR agreement (%) | 28/31 (90.3%) | 9/31 (29.0%) | 20/31 (64.5%) |
aExpressed genes, genes with at least two measurable hybridization signals above the threshold level.
bSignificant change at P < 0.01 using the Wilcoxon–Mann–Whitney test.
Figure 3.
Reproducibility of expression levels of logarithmic phase RNA samples generated by RNA and genomic normalizations. (A) Scatter plot analysis of genes expression levels generated by stationary phase RNA normalization and their corresponding CV values (CV = ratio of the standard deviation relative to the mean hybridization intensities). The signal intensity ratios were sorted from the highest to the lowest (n = 3). (B) Scatter plot analysis of gene expression levels generated by genomic normalization and their corresponding CV values. The signal intensity ratios were sorted from the highest to the lowest (n = 3). Note the number of genes detected by each normalization procedure. Similar results were obtained when the expression levels were measured in the stationary phase RNA samples.
As proposed earlier (25) we used a t-test-based approach to identify genes that significantly changed their expression levels in different samples. With the genomic normalization, among the 98% of genes with detectable expression levels, 5.2% (207 genes) showed a significant change in their expression levels in either logarithmic or stationary phases (Table 1 and Supplementary Material). However, only 3% of the genes were significantly changed based on either RNA normalization procedures. Only 30 genes were shared between both groups of significantly changed genes when gDNA and RNA samples were used for normalization. A smaller number of genes (21 genes) were shared between both groups of significantly changed genes when logarithmic and stationary phase RNAs were used for normalization. Overall, genomic normalization identified a higher percentage of expressed genes with more genes of significant change in their expression levels than RNA normalization protocols.
Real time, quantitative PCR analysis
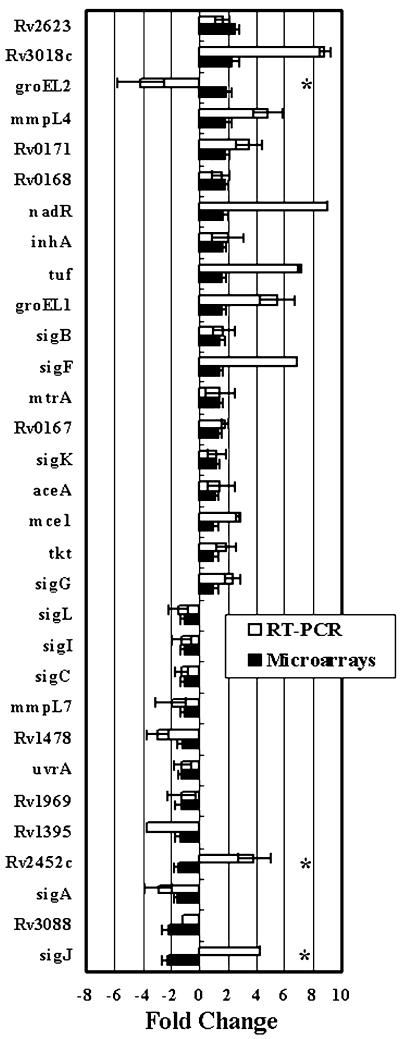
To further evaluate the performance of each normalization procedure (genomic or RNA) for microarray analysis we compared the microarray expression levels to real time, quantitative PCR. For this comparison, we considered that a normalization protocol is in agreement if gene expression levels were closely matched in the magnitude and direction (up- or down-regulation). Generally, amplification-based protocols gave higher estimates of gene expression levels. Nonetheless, in ∼90% of the genes examined (28/31) there was an agreement in expression fold change whether the expression level was estimated using genomic normalization or real time PCR (Fig. 4). However, this agreement dropped to 29–68% when stationary or logarithmic RNA samples were used as the normalizer, respectively (Table 1). Additionally, several key genes known to be highly regulated in the logarithmic and stationary phases [e.g. hspX (heat shock protein family), fdhF (molybdopetrin-containing oxidoreductase), glcB (malate synthase) and ppdK (pyruvate phosphate dikinase)], as reported previously for M.tuberculosis and Mycobacterium bovis BCG cultures (26,27), were correctly identified by the genomic normalization procedure and not detected or incorrectly identified using the RNA normalization procedures. However, a fewer number of genes [e.g. sigF, fprA and fprB (ferredoxin reductase)] had expression levels measured by microarray genomic normalization that are different from those previously reported (27,28). None of these genes was identified correctly with RNA normalization protocols. The disparity in the expression levels of these genes using microarray analysis and northern blot analysis used in the previous studies can be attributed to the differences in culture conditions and the mycobacterial strains used for conducting the analysis. Based on this set of analyses and the flexibility offered by genomic normalization protocols, we concluded that gDNA is the most suitable alternative for normalizing the gene expression levels and proceeded to further analysis of the expression data generated with genomic normalization.
Figure 4.
Comparison between microarray analysis and real time PCR for gene expression profiling. Fold change of genes expressed during M.tuberculosis growth from logarithmic to stationary phases based on the normalized microarray analysis versus real time PCR for a randomly selected set of genes (n = 31). Stars denote genes with disagreement between microarray data and real time PCR.
Expression profiles during different growth phases
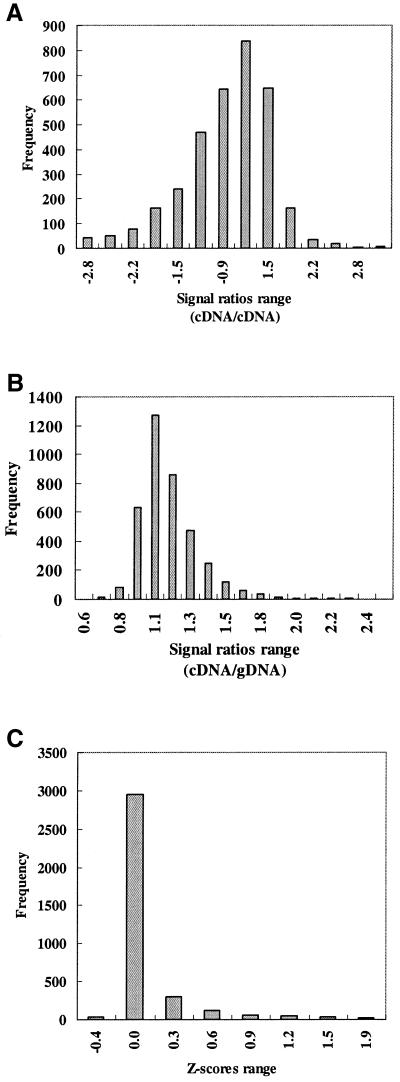
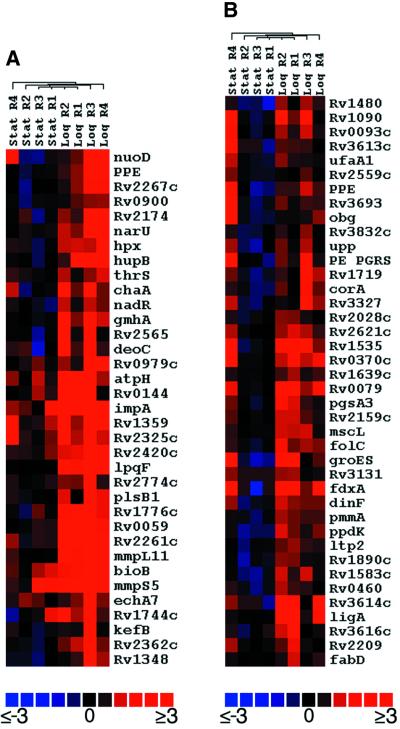
For some applications (such as vaccine development) (29), the magnitude of gene expression levels and the abundance of a particular transcript relative to others in a given sample is the most desired information as opposed to relative expression levels in two different samples. Several investigators working in the microarray field (25,30) now recognize the need to develop new protocols for microarray data handling to reliably estimate gene expression independent of using fold change as the deciding criterion for real expression change or transcription co-determination. In our analysis of gDNA normalization, we applied the Z-score statistics on the data generated by genomic normalization to estimate ‘standard’ gene expression levels within any given sample given that the expression levels were following a Gaussian distribution (Fig. 5). The Z-scores system is usually applied to computing student performance in different tests with different scoring scales (19); a task similar to assigning expression levels for genes from cultures growing to different growth phases. In our case, the use of Z-scores conversion ‘centered’ the expression levels estimated for each sample around a central ‘0 value’ to enable valid comparison of expression levels (18,21) (Fig. 5C). To demonstrate the usefulness of the Z scores in identifying differently expressed genes, we used a hierarchical cluster analysis algorithm (17) to cluster Z scores generated from different replicate hybridizations of the logarithmic phase or stationary phase samples. We also ‘spiked’ the stationary phase data with a data set where RNA was extracted from 28-day-old cultures (early stationary phase) instead of the regular 50-day-old cultures (late stationary phase) used throughout this study. As expected, all replicates were clustered according to the source of RNA samples used for hybridization either from logarithmic or stationary phase samples (Fig. 6), indicating a high level of hybridization reproducibility. In some instances, for example with bioB (biotin synthetase enzyme) and mmpS5 (mycobacterial membrane protein), the gene expression levels were high (red color) in all four replicates of the logarithmic phase as well as in three out of four replicates of stationary phase, indicating a low level of expression (blue color) in only one replicate (Fig. 6A). Interestingly, in another subset of the cluster (Fig. 6B) a group of 40 genes from one replicate of the early stationary phase hybridizations (28 days) was highly expressed in contrast to the rest of the late stationary phase replicates (50 days), indicating the ability of the proposed protocol to differentiate between samples collected at different time points.
Figure 5.
Distribution of gene expression ratios. (A) A histogram representing the range of ratios of signals generated from the RNA normalization protocol where signals from logarithmic phase cultures were normalized to signals from stationary phase cultures (cDNA/cDNA). (B) A histogram representing the hybridization ratios from a single experiment where signals derived from labeled cDNA (from cultures growing to logarithmic phase) were normalized to signals derived from gDNA hybridization (cDNA/gDNA). Similar results were obtained from the rest of the logarithmic and stationary phase samples. (C) A histogram representing the Z-score transformation of the expression ratios presented in (B).
Figure 6.
Hierarchical cluster analysis of four repeats of hybridizations (from different RNA extractions) with either logarithmic or stationary phase RNA-based analytes. The bottom color bar represents different Z-score values corresponding to each gene present in each panel. Gene names are shown to the right of the colored image while the corresponding source of the analyte is shown at the top. Log and Stat denote the source of the cDNA samples extracted from logarithmic or stationary phases cultures, respectively. R1–R4 denote the replicate number. (A) A subset of the whole cluster of 1337 genes (with Z scores ≥±0.5) displaying differential expression levels between the logarithmic and stationary phases is shown. (B) Another subset of genes displaying up-regulation in 28- but not 50-day cultures is represented by red bars in the Stat R4 replicate.
Overall, the hierarchical cluster analysis of Z scores identified a set of 183 genes with high expression activity in most of the hybridization replicates whether the logarithmic or stationary phase samples were investigated (see Supple mentary Material). Genes involved in transcription regulation (Rv0302, sigF, sig K and ATP-dependent helicase), cell wall synthensis (pbp4), ribosomal proteins (rpsC and rpmE) as well as metabolic activity genes (aceA, Rv2850c and Rv3729) were represented in this cluster, indicating their importance during growth of mycobacterial cultures in either logarithmic or stationary phase. The hierarchical clustering algorithm also identified genes (826 genes) with low levels of expression in almost all replicates of the logarithmic and stationary phase hybridizations. Currently, we are examining the contribution of the identified sets of genes to the transition from logarithmic to stationary phases. An earlier report (31) screened 600 mutants of Mycobacterium smegmatis and identified only six genes that could be involved in transition to the stationary phase. Clearly, the microarray expression profiling provides a more complete and dynamic view of gene expression changes during different growth phases.
DISCUSSION
DNA microarrays is a promising technology for estimating gene expression levels on a genome-wide level. However, the hybridization reproducibility and expression data normalization are some of the problems that need further investigation to maximize the utility of such analysis. In this report, we have tested a protocol based on normalizing all expression levels to the hybridization signals generated from the gDNA source for the RNA under investigation. Unlike an RNA normalization procedure, the genomic normalization procedure provided reproducible hybridization signals for 98% of the predicted mycobacterial ORFs. Evaluation of expression levels by real time, quantitative PCR revealed a higher percentage of agreement (90%) with the genomic normalization protocol for microarray analysis compared to RNA normalization (29–68%). The tested genomic normalization protocols recognized significant change in 5.2% of the expressed genes when mycobacterial cultures were grown to logarithmic or stationary phase. Comparison of four protocols for labeling gDNA for normalization demonstrated that a nick translation protocol is superior to the amplification-based protocols.
Genomic normalization procedures may provide a simple alternative for gene expression profiling. Tao et al. (16) and others (4,32) reported on several problems associated with microarray analysis (e.g. DNA spotting failures, biased incorporation of fluorophores during sample labeling, unequal distribution of the hybridizing analytes to the whole slide and different exposure times for each hybridization) that could be easily tracked and avoided by the genomic normalization protocol. For example, absence of the hybridization signals from the genomic DNA sample could be attributed to a failure in DNA deposition onto glass slides while absence of a hybridization signal from an RNA sample could be attributed to a failure in DNA deposition or inadequate representation of transcripts in the examined RNA samples. Although genomic normalization required two slide hybridizations to investigate a pair of RNA samples, using a designated fluorophore for normalization across different experimental conditions eliminates the need for ‘color-reversal’ experiments, which as we and others (22) have shown are quite variable. Moreover, time-course studies of microorganisms growing under different conditions can be easily compared using the hybridization signals generated from the gDNA (a relatively stable form of genetic information) as a common denominator. However, because of the complexity of the mammalian genomes (presence of exons and large numbers of repetitive sequences), the use of genomic normalization in such systems remains to be evaluated.
Another potential advantage of genomic normalization is that it may facilitate comparison of expression data between different groups. In our hands, the genomic normalization protocol allowed comparison of different samples across multiple conditions with high reproducibility and statistical confidence. Currently, we are applying genomic normalization to investigate the molecular pathogenesis of tuberculosis in vivo (unpublished data) as well as Borrelia burgdorferi (33). Such a system could be adapted to investigate any microbial genome.
SUPPLEMENTARY MATERIAL
Supplementary Material is available at NAR Methods Online.
Supplementary Material is available at NAR Methods Online.
Acknowledgments
ACKNOWLEDGEMENTS
The authors like to thank Ross Chambers for helpful discussions, Tim Macatee and Qihua Sun for technical support and Mike McGuire for comments on the manuscript. This work was supported by grants from the NIH to H.R.G., from the NIH to R.L. and from DARPA and the National Heart Lung and Blood Institute Programs for Genomic Applications, Southwestern PGA (U01 HL66880) to S.A.J. A.M.T. is supported in part by a Cardiology Training Grant fellowship. S.T.H. is supported in part by the Department of Veterans Affairs.
REFERENCES
- 1.Harrington C.A., Rosenow,C. and Retief,J. (2000) Monitoring gene expression using DNA microarrays. Curr. Opin. Microbiol., 3, 285–291. [DOI] [PubMed] [Google Scholar]
- 2.Greenfield A. (2000) Applications of DNA microarrays to the transcriptional analysis of mammalian genomes. Mamm. Genome, 11, 609–613. [DOI] [PubMed] [Google Scholar]
- 3.Dye C., Scheele,S., Dolin,P., Pathania,V. and Raviglione,R.C. (1999) Global burden of tuberculosis – estimated incidence, prevalence and mortality by country. J. Am. Med. Assoc., 282, 677–686. [DOI] [PubMed] [Google Scholar]
- 4.Beissbarth T., Fellenberg,K., Brors,B., Arribas-Prat,R., Boer,J.M., Scheideler,M., Hoheisel,J.D., Schutz,G., Poustka,A. and Vingron,M. (2000) Processing and quality control of DNA array hybridization data. Bioinformatics, 16, 1014–1022. [DOI] [PubMed] [Google Scholar]
- 5.DeRisi J.L., Iyer,V.R. and Brown,P.O. (1997) Exploring the metabolic and genetic control of gene expression on a genomic scale. Science, 278, 680–686. [DOI] [PubMed] [Google Scholar]
- 6.Iyer V.R., Eisen,M.B., Ross,D.T., Schuler,G., Moore,T., Lee,J.C.F., Trent,J.M., Staudt,L.M., Hudson,J., Boguski,M.S. et al. (1999) The transcriptional program in the response of human fibroblasts to serum. Science, 283, 83–87. [DOI] [PubMed] [Google Scholar]
- 7.Zweiger G. (1999) Knowledge discovery in gene-expression-microarray data: mining the information output of the genome. Trends Biotechnol., 17, 429–436. [DOI] [PubMed] [Google Scholar]
- 8.Manduchi E., Grant,G.R., Mckenzie,S.E., Overton,G.C. and Surrey,S. (2000) Generation of patterns from gene expression data by assigning confidence to differentially expressed genes. Bioinformatics, 16, 685–698. [DOI] [PubMed] [Google Scholar]
- 9.Manganelli R., Dubnau,E., Tyagi,S., Kramer,F.R. and Smith,I. (1999) Differential expression of 10 sigma factor genes in Mycobacterium tuberculosis. Mol. Microbiol., 31, 715–724. [DOI] [PubMed] [Google Scholar]
- 10.Cole S.T., Brosch,R., Parkhill,J., Garnier,T., Churcher,C., Harris,D., Gordon,S.V., Eiglmeier,K., Gas,S., Barry,C.E.,III et al. (1998) Deciphering the biology of Mycobacterium tuberculosis from the complete genome sequence. Nature, 393, 537–538. [DOI] [PubMed] [Google Scholar]
- 11.Chu S., DeRisi,J., Eisen,M., Mulholland,J., Botstein,D., Brown,P.O. and Herskowitz,I. (1998) The transcriptional program of sporulation in budding yeast. Science, 282, 699–705. [DOI] [PubMed] [Google Scholar]
- 12.Wei Y., Lee,J.M., Richmond,C., Blattner,F.R., Rafalski,J.A. and LaRossa,R.A. (2001) High-density microarray-mediated gene expression profiling of Escherichia coli. J. Bacteriol., 183, 545–556. [DOI] [PMC free article] [PubMed] [Google Scholar]
- 13.Talaat A.M., Hunter,P. and Johnston,S.A. (2000) Genome-directed primers for selective labeling of bacterial transcripts for DNA microarray analysis. Nat. Biotechnol., 18, 679–682. [DOI] [PubMed] [Google Scholar]
- 14.Pollack J.R., Perou,C.M., Alizadeh,A.A., Eisen,M.B., Pergamenschikov,A., Williams,C.F., Jeffrey,S.S., Botstein,D. and Brown,P.O. (1999) Genome-wide analysis of DNA copy-number changes using cDNA microarrays. Nature Genet., 23, 41–46. [DOI] [PubMed] [Google Scholar]
- 15.Lashkari D.A., DeRisi,J.L., McCusker,J.H., Namath,A.F., Gentile,C., Hwang,S.Y., Brown,P.O. and Davis,R.W. (1997) Yeast microarrays for genome wide parallel genetic and gene expression analysis. Proc. Natl Acad. Sci. USA, 94, 13057–13062. [DOI] [PMC free article] [PubMed] [Google Scholar]
- 16.Tao H., Bausch,C., Richmond,C., Blattner,F.R. and Conway,T. (1999) Functional genomics: expression analysis of Escherichia coli growing on minimal and rich media. J. Bacteriol., 181, 6425–6440. [DOI] [PMC free article] [PubMed] [Google Scholar]
- 17.Eisen M.B., Spellman,P.T., Brown,P.O. and Botstein,D. (1998) Cluster analysis and display of genome-wide expression patterns. Proc. Natl Acad. Sci. USA, 95, 14863–14868. [DOI] [PMC free article] [PubMed] [Google Scholar]
- 18.Thomas J.G., Olson,J.M., Tapscott,S.J. and Zhao,L.P. (2001) An efficient and robust statistical modeling approach to discover differentially expressed genes using genomic expression profiles. Genome Res., 11, 1227–1236. [DOI] [PMC free article] [PubMed] [Google Scholar]
- 19.Kirk R.E. (1990) Normal distribution and sampling distributions. In Kirk,R.E. (ed.), Statistics: An introduction. Holt, Rinehart and Winston, Philadelphia, PA, pp. 283–309.
- 20.Schmittgen T.D., Zakrajsek,B.A., Mills,A.G., Gorn,V., Singer,M.J. and Reed,M.W. (2000) Quantitative reverse transcription-polymerase chain reaction to study mRNA decay: comparison of endpoint and real-time methods. Anal. Biochem., 285, 194–204. [DOI] [PubMed] [Google Scholar]
- 21.Wilson W., DeRisi,J., Kristensen,H.H., Imboden,P., Rane,S., Brown,P.O. and Schoolnik,G.K. (1999) Exploring drug-induced alterations in gene expression in Mycobacterium tuberculosis by microarray hybridization. Proc. Natl Acad. Sci. USA, 96, 12833–12838. [DOI] [PMC free article] [PubMed] [Google Scholar]
- 22.Taniguchi M., Miura,K., Iwao,H. and Yamanaka,S. (2001) Quantitative assessment of DNA microarrays – comparison with Northern blot analyses. Genomics, 71, 34–39. [DOI] [PubMed] [Google Scholar]
- 23.Herwig R., Aanstad,P., Clark,M. and Lehrach,H. (2001) Statistical evaluation of differential expression on cDNA nylon arrays with replicated experiments. Nucleic Acids Res., 29, e117. [DOI] [PMC free article] [PubMed] [Google Scholar]
- 24.Salin H., Vujasinovic,T., Mazurie,A., Maitrejean,S., Menini,C., Mallet,J. and Dumas,S. (2002) A novel sensitive microarray approach for differential screening using probes labelled with two different radioelements. Nucleic Acids Res., 30, e17. [DOI] [PMC free article] [PubMed] [Google Scholar]
- 25.Long A.D., Mangalam,H.J., Chan,B.Y.P., Tolleri,L., Hatfield,G.W. and Baldi,P. (2001) Improved statistical inference from DNA microarray data using analysis of variance and a Bayesian statistical framework – analysis of global gene expression in Escherichia coli K12. J. Biol. Chem., 276, 19937–19944. [DOI] [PubMed] [Google Scholar]
- 26.Hu Y.M. and Coates,A.R.M. (1999) Transcription of the stationary-phase-associated hspX gene of Mycobacterium tuberculosis is inversely related to synthesis of the 16-kilodalton protein. J. Bacteriol., 181, 1380–1387. [DOI] [PMC free article] [PubMed] [Google Scholar]
- 27.Hutter B. and Dick,T. (1999) Up-regulation of narX, encoding a putative ‘fused nitrate reductase’ in anaerobic dormant Mycobacterium bovis BCG. FEMS Microbiol. Lett., 178, 63–69. [DOI] [PubMed] [Google Scholar]
- 28.DeMaio J., Zhang,Y., Ko,C., Young,D.B. and Bishai,W.R. (1996) A stationary-phase stress-response sigma factor from Mycobacterium tuberculosis. Proc. Natl Acad. Sci. USA, 93, 2790–2794. [DOI] [PMC free article] [PubMed] [Google Scholar]
- 29.Dhiman N., Bonilla,R., O’Kane,D. and Poland,G.A. (2001) Gene expression microarrays: a 21st century tool for directed vaccine design. Vaccine, 20, 22–30. [DOI] [PubMed] [Google Scholar]
- 30.Kim S.C., Dougherty,E.R., Chen,Y.D., Sivakumar,K., Meltzer,P., Trent,J.M. and Bittner,M. (2000) Multivariate measurement of gene expression relationships. Genomics, 67, 201–209. [DOI] [PubMed] [Google Scholar]
- 31.Keer J., Smeulders,M.J., Gray,K.M. and Williams,H.D. (2000) Mutants of Mycobacterium smegmatis impaired in stationary-phase survival. Microbiology, 146, 2209–2217. [DOI] [PubMed] [Google Scholar]
- 32.Schuchhardt J., Beule,D., Malik,A., Wolski,E., Eickhoff,H., Lehrach,H. and Herzel,H. (2000) Normalization strategies for cDNA microarrays. Nucleic Acids Res., 28, e47. [DOI] [PMC free article] [PubMed] [Google Scholar]
- 33.Revel A.T., Talaat,A.M. and Norgard,M.V. (2002) DNA microarray analysis of differential gene expression in Borrelial burgdorferi, the Lyme disease spirochete. Proc. Natl Acad. Sci. USA, 99, 1562–1567. [DOI] [PMC free article] [PubMed] [Google Scholar]


