Abstract
Although increasingly used for DNA quantification, little is known of the dynamics of the 5′ exonuclease assay, particularly in relation to amplicon length and mismatches at oligonucleotide binding sites. In this study we used seven assays targeting the c-myc proto-oncogene to examine the effects of sequence length, and report a marked reduction in efficiency with increasing fragment length. Three of the assays were further tested on 15 mammalian species to gauge the effect of sequence differences on performance. We show that the effects of probe and primer binding site mismatches are complex, with single point mutations often having little effect on assay performance, while multiple mismatches to the probe caused the greatest reduction in efficiency. The usefulness of the assays in predicting rates of ‘allelic dropout’ and successful polymerase chain reactions (PCRs) in microsatellite genotyping studies is supported, and we demonstrate that the use of a fragment more similar in size to typical microsatellites (190 bp) is no more informative than a shorter (81 bp) fragment. The assays designed for this study can be used directly for quantification of DNA from many mammalian species or, alternatively, information provided here can be used to design unique sequence-specific assays to maximise assay efficiency.
INTRODUCTION
In recent years, the 5′ exonuclease assay (1,2) has become the method of choice for accurate quantification of DNA extracts (3–8). Other methods, such as fluorometric analysis and competitive polymerase chain reaction (PCR), are hampered by the lack of specificity for host DNA and the limited linear range for quantification (8,9). The 5′ exonuclease assay incorporates the use of a double-labelled, template-specific probe that binds to the target DNA before being cleaved by the 5′–3′ exonuclease activity of the Taq polymerase. This cleavage of the probe results in the release of signal from the ‘reporter’ fluorescent dye. The intensity of the reporter fluorescence throughout the PCR cycle corresponds directly to the number of copies of PCR product present at each stage of the cycle. Samples of unknown concentration are compared with a standard curve created from samples of known DNA concentration, to estimate starting DNA template amount with a dynamic range of at least five orders of magnitude (7).
Quantitative PCR (qPCR) has also been used as a method for analysing low concentration DNA extracts such as those derived from non-invasive samples collected for use in wildlife genetic studies (8). Accurate quantification of such samples allows for a streamlined approach to the number of repetitions required for 99% confidence in genotypes obtained (8,10). However, possible problems that could compromise this application include (i) reduced efficiency of the assay for samples with minor mismatches at the probe binding site that, if undetected, will give inaccurate estimates of DNA quantity; (ii) quantification of contaminating human (or other) DNA instead of (or in addition to) target DNA; and (iii) possible discordance between results obtained for the short qPCR assay amplicon to the relatively larger amplicons typically used for microsatellite genotyping. This latter point is confounded by observations of a decrease in assay efficiency with an increase in assay amplicon length (11).
Klein et al. (6) have investigated the effects of probe mismatches on the efficiency of the 5′ nuclease assay, but the number of mismatches investigated was low, and there has been no attempt to characterise how such mismatches interact with other factors such as amplicon length and species-related DNA sequence differences to affect assay performance. Such information is useful for assessing the applicability of a given qPCR assay across a range of species or highly variable DNA sequences.
We designed seven separate 5′ exonuclease assays ranging from 81 to 429 bp in length. The aim of this study was to use these assays in association with a panel of 15 mammalian DNA samples to assess the performance of the assay on DNA fragments of different length within and across species. For each of the species, we sequenced the assay target region to provide exact data on number and placement of primer and probe mismatches. This information then made it possible to investigate a number of interactions between target template and assay performance. Previous work has concentrated on determining assay efficiency by examining the slope characteristics of the assay standard curve (6,12). In this study we utilise this method, but also introduce a system whereby the slope characteristics of the actual sample amplification plots are used, allowing direct assessment of assay efficiency between individual samples.
Finally, we tested whether the use of a qPCR assay that measures the quantity of DNA template for an amplicon size more typical of microsatellite loci would be a better predictor of PCR success and allelic dropout (AD) frequencies in studies using low quantity or quality DNA samples. AD is the stochastic amplification of only one of two alleles at a heterozygote locus that, if undetected, leads to the false inference of a homozygous genotype at that locus (8,13,14). We compared the results of two differently sized qPCR assays with previous data on percentage positive PCR and AD rates for samples from a population of wild chimpanzees (8) to assess the merits of longer qPCR assays for prioritising samples for repetition.
MATERIALS AND METHODS
DNA samples
A panel of 15 genomic DNA samples was constructed from commercial and private sources to test the phylogenetic coverage of the assays (Table 1). These high quality DNAs were extracted from cell line or blood samples by the suppliers (Table 1). Their concentrations were estimated first by absorbance at 260 nm (A260) in a spectrophotometer and then diluted with 0.1× TE buffer (10 mM Tris, 0.1 mM EDTA, pH 8.0) into aliquots with an approximate starting concentration of 10 ng/µl. Aliquots were stored frozen at –20°C.
Table 1. DNA type and source.
| Species | Source | c-myc sequence accession |
|---|---|---|
| Sus scrofa(pig) | Deutsche Sammlung von Mikroorganismen und Zellkulturen (DSMZ), Braunschweig, Germany. ID AM-C6SC8 | AF519454 |
| Bos taurus (cow) | DSMZ. ID EBL | AF519455 |
| Ovis aries (sheep) | Coriell Cell Repositories (CCR), Camden, New Jersey. ID GM03550 | Z68501 |
| Felis cattus (domestic cat) | CCR ID GM06206 | AF519449 |
| Mus musculus (mouse) | CCR ID GM00346B | AF519452 |
| Cricetulus griseus (Chinese hamster) | CCR ID GM00215A | AF519453 |
| Oryctolagus cuniculusi (rabbit) | CCR ID AG04677A | AF519451 |
| Cuon alpinus (dhole) | Dr Arati Iyengar, Laboratory for Conservation Genetics, Max Planck Institute for Evolutionary Anthropology, Leipzig, Germany | AF519448 |
| Pan troglodytes verus (chimpanzee) | Jo Fritz, Primate Foundation of Arizona, Phoenix, AZ | AF519445 |
| Saguinus oedipus (marmoset) | DSMZ ID B95-8 | AF519447 |
| Papio hamadryas (baboon) | Dr Jeff Rogers, Southwest Foundation for Biomedical Research, San Antonio, TX | AF519446 |
| Loxodonta africana (elephant) | Dr William J. Murphy Laboratory of Genomic Diversity, National Cancer Institute, Frederick, MD | AF519456 |
| Asioscalops altaica (mole) | Dr William J. Murphy | AF519458 |
| Chaetophractus villosus (armadillo) | Dr William J. Murphy | AF519457 |
| Plecotus auritus (micro bat) | Dr Tamsyn Burland, School of Biological Sciences, Queen Mary, University of London | AF519450 |
| Didelphis virgianus (opossum) | Dr William J. Murphy | Not applicable |
Assay design and implementation
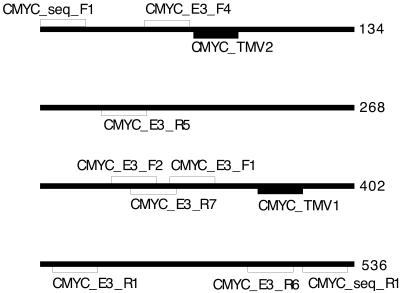
Seven 5′ exonuclease qPCR assays of different lengths were designed from an alignment of the c-myc proto-oncogene DNA sequences from mouse (GenBank accession no. X01023) and human (accession no. J00120). The smallest assay, c-myc81, is 81 bp in length and has been described previously (8). The design of the other assays, c-myc105, c-myc113, c-myc190, c-myc239, c-myc320 and c-myc429, followed published guidelines (11,15). Primers and probes for these assays were designed using the software Primer Express™ (V. 1.0; Applied Biosystems, Foster City, CA) and their sequences are given in Table 2. Primer and probe combinations for each assay are given in Table 3 and their position on the target sequence is shown in Figure 1. Reaction conditions were the same for all assays and were carried out in PCR volumes of 20 µl containing 2 µl of 10× Taqman Reaction System buffer (Eurogentec, Belgium), 4.5 mM MgCl2, 250 µM each of dATP, dCTP, dGTP, dTTP and dUTP, 0.5 U HotGoldStar Taq polymerase (Eurogentec), 0.8 mg/ml BSA, 0.01 U/µl uracil-DNA-glycosylase (Roche, Germany), 300 nM of each primer, 200 nM probe and 5 µl DNA template. Cycling was performed on an ABI Prism™ 7700 Sequence Detector (Applied Biosystems) with conditions as described in Morin et al. (8).
Table 2. Primer and probe sequences.
| Oligo | 5′ End | Middle | 3′ End |
|---|---|---|---|
| CMYC_E3_F1 | GCCAGA | GGAGGAA | CGAGCT |
| CMYC_E3_F2 | GGCGAAC | ACACAAC | GTCTTGG |
| CMYC_E3_F4 | AGGCCA | CAGCAA | ACCTCC |
| CMYC_E3_R1 | GGGCCTT | TTCATTG | TTTTCCA |
| CMYC_E3_R5 | TGGCAGC | AGGATA | GTCCTTC |
| CMYC_E3_R6 | TTTCAACT | GTTCTCG | TCGTTTCC |
| CMYC_E3_R7 | GGCGCT | CCAAG | ACGTTG |
| CMYC_TMV1 | TGCCCTG | CGTGAC | CAGATCC |
| CMYC_TMV2 | CACAGCCC | ACTGGTCC | TCAAGAGG |
| CMYC_seq_F1 | GAAATCG | ATGTTGT | TTCTGTG |
| CMYC_seq_R1 | CAAGAGT | TCCGTA | GCTGTTC |
Probes (TMV1 and TMV2) were labelled with VIC on the 5′ end and with TAMRA on the 3′ end.
Table 3. Assay primer and probe combinations.
| Assay | Forward primer | Probe | Reverse primer |
|---|---|---|---|
| c-myc81 | CMYC_E3_F1 | CMYC_TMV1 | CMYC_E3_R1 |
| c-myc105 | CMYC_E3_F2 | CMYC_TMV1 | CMYC_E3_R1 |
| c-myc113 | CMYC_E3_F4 | CMYC_TMV2 | CMYC_E3_R5 |
| c-myc190 | CMYC_E3_F1 | CMYC_TMV1 | CMYC_E3_R6 |
| c-myc239 | CMYC_E3_F4 | CMYC_TMV2 | CMYC_E3_R7 |
| c-myc320 | CMYC_E3_F4 | CMYC_TMV2 | CMYC_E3_R1 |
| c-myc429 | CMYC_E3_F4 | CMYC_TMV2 | CMYC_E3_R6 |
Figure 1.
Position of primer and probe oligos for the various c-myc assays (refer to Table 3 for combinations) and c-myc target sequence. The target fragment is a 533 bp portion of exon 3 of the c-myc proto-oncogene (accession no. J00120).
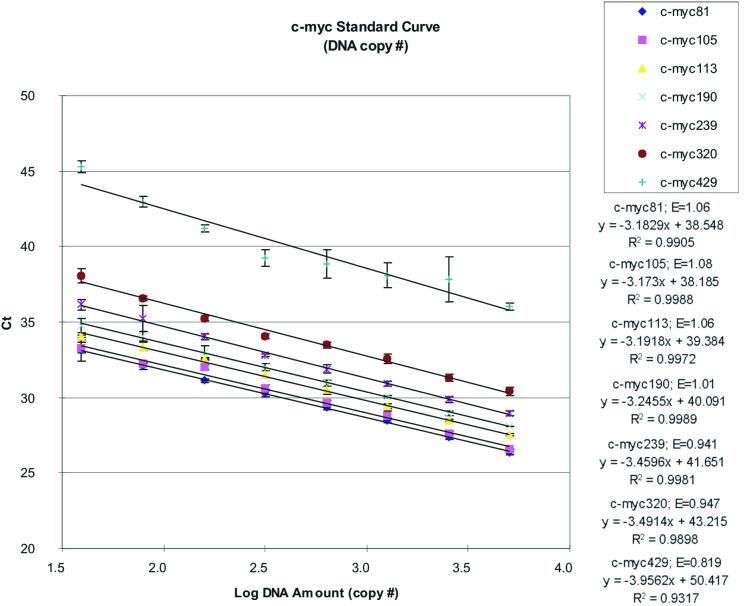
As an initial assessment of their performance, all seven assays were tested on a triplicate set of standards prepared and HPLC-quantified by Roboscreen (Leipzig, Germany) (16). The standard set comprised a 2-fold dilution series of a PCR product amplified from a 429 bp portion of the c-myc proto-oncogene and ranged from 5050 to 39 copies. The efficiency of the standard curves and amplification plots was analysed (see Fig. 3) and three assays (c-myc81, c-myc190 and c-myc239) were selected based on fragment size and assay performance for further use with the mammalian samples. All three assays failed for the opossum DNA so it was decided to exclude it from further analysis as marsupials represent a highly divergent lineage at this gene.
Figure 3.
Standard curves for c-myc assays 81, 105, 113, 190, 239, 320 and 429 based on the average of three replicates (± standard deviation). The c-myc113 and c-myc320 assays both had single data points removed, which represented failed or aberrant reactions, and the c-myc429 assay had two points requiring removal. The efficiency (E) for each assay is shown above the standard curve equation information.
Prior to the sample assays, a triplicate set of standards (from 1010 to 8 copies) was run to create the reference standard curve for amplifiable DNA calculation. Because this standard was a PCR product it was important that it be prepared and run separately from the sample plate to avoid possible carry-over contamination. Six ‘no template controls’ were included on the standard plate to monitor for master-mix reagent contamination. A single reagent cocktail was used for the standards, negative controls and test DNA samples. Data analysis was performed using the ABI Prism™ 7700 Sequence Detector software, and standard curves and quantities were calculated according to Morin et al. (8). For each assay, averages of three replicates were used for the standard curve, and all data points were used for each assay except c-myc239, for which the last data point, corresponding to eight copies, was deleted because of failed or aberrant reactions.
Sequencing of the target region
The published sequences of exons 2 and 3 of the c-myc proto-oncogene for 18 eutherian mammalian species and two avian species (17) were used to design a conserved PCR primer set that would amplify the region of the gene containing all of the assays (Table 2). PCR amplifications were performed in 15 µl reaction volumes containing 1× reaction buffer (10 mM Tris–HCl, 50 mM KCl, pH 8.3), 2.5 mM MgCl2, 250 µM dNTPs, 0.3 U Taq polymerase (Roche) and 200 nM of each primer. A ‘touch-down’ PCR programme was employed that consisted of a 3 min incubation at 95°C followed by step-down cycles of 94°C for 30 s, 64°C for 30 s and 72°C for 1 min. The annealing temperature was reduced by 1°C each cycle until an annealing temperature of 48°C was reached. A further 13 cycles at this annealing temperature took place with a final extension phase of 72°C for 10 min. Amplification products were purified using the QIAquick PCR Purification Kit from Qiagen and then sequenced using the ABI big-dye terminator cycle sequencing kit 2.0, and electrophoresed on an ABI 3700 automated sequencer (Applied Biosystems).
The newly generated sequences were aligned with those published by Miyamoto et al. (17) using the program Bioedit (V. 5.0.6) (18) (aligned sequences can be viewed in the Supplementary Material). Phylogenetic analyses of the aligned sequences were performed using the Phylip software package (V. 3.6) (19). A DNA distance matrix was calculated using the F84 model (20,21) and this matrix was used to construct a neighbour-joining tree using two avian species as outgroups. Bootstrap support for this tree was generated by performing 1000 re-sampling iterations of the original data set prior to the distance matrix and tree calculations and then creating a majority rule consensus tree (22).
Assay efficiency and oligonucleotide mismatch analysis
The slopes of the standard curves were used to calculate efficiencies (E) of the assays using the equation E = 10–1/s – 1, where s = slope of the regression curve (6). The slopes of the exponential phase of the amplification plots [amplification plot slope (APS)] were determined by creating a plot of average fluorescence versus cycle number using seven data points encompassing the threshold fluorescence value from the exponential phase of the original amplification plot. The slope was recorded from the equation for the linear regression trendline of this plot and was accepted for the selected seven data points when the R2 value exceeded 0.99. For mismatch analysis, the probes and primers in each assay were divided into three even parts each (when possible), as shown in Table 2, and mismatches between the oligonucleotide and the corresponding DNA sequence for each species were counted. To get an indication of the effect of mismatches in each section of each oligonucleotide, the APSs for each species were plotted against the respective number of mismatches for each probe section, and a linear regression was used to infer the correlation between mismatches and assay efficiency (data not shown).
Correlation with allelic dropout
A subset of the chimpanzee faecal DNA extracts used by Morin et al. (8) were used to test the relative ability of the assays to predict amplification success and AD rates. Samples from 45 individuals were quantified using two 5′ exonuclease assays (c-myc81 and c-myc190). The results from these assays were compared with the microsatellite data and information on AD from the previous study. For fitting regression curves, all data were transformed to make them non-zero (by addition of 0.1 to the copy number and 0.1% to the percentage positive PCR or percentage AD), and the program SPSS (version 8.0; SPSS inc., Chicago, IL) was used to find the curve that best fit the data by testing regressions and significance levels. Tested regression models included observed, linear, log, quadratic, cubic, compound, power and growth.
RESULTS
Sequences and phylogeny
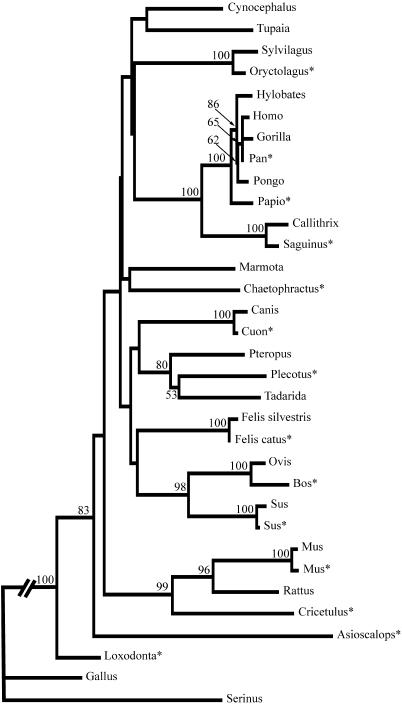
DNA sequences for a 533 bp fragment of the c-myc proto-oncogene were obtained for 14 mammals. Repeated sequencing reaction failures for the opossum DNA forced its exclusion from further analysis. The sheep DNA produced unclean sequence so the published sequence was used for phylogenetic and mismatch analyses. The sequences were aligned with the previously published mammalian and bird sequences (17) and phylogenetic analysis was done on the resulting 495 bp of aligned sequence for 33 species (Fig. 2). The phylogenetic relationships derived from the c-myc sequence are consistent with relationships inferred from other molecular sequences (23), and this locus appears to be useful for a wide range of divergence times, from the deep branches of mammalian radiation to closely related genera.
Figure 2.
Unrooted phylogenetic tree constructed using the neighbour- joining method based on genetic distance analysis of the c-myc sequences. Genetic distances were calculated using the F84 model in the Phylip software package (19). Bootstrap values exceeding 50% are shown on the corresponding branches. *Indicates newly generated sequences.
DNA quantification: consistency of measurements between assays
The standard curves for all assays are shown in Figure 3. The assays exhibited different efficiencies, ranging from 1.08 to 0.82 (Fig. 3), which means that the number of copies of PCR product that was produced in each cycle of the PCR was lower in each successive assay as the length of the product increased from 81 to 429 bp. The y-intercepts of the assays were also significantly different, with assays shifted up the y-axis as the assay product length increased. This also reflects an overall decrease in sensitivity of the longer assays, such that the threshold fluorescence values are reached later in the PCR cycling. Reduction in efficiency with increased length is a typical characteristic of the 5′ exonuclease assay (11), though its predictability is not complete and it has not been characterised previously in any detail.
Four of the assays exhibited E values higher than the theoretical maximum of 1 (c-myc81, c-myc105, c-myc113 and c-myc190). The reason for this is that the estimation of overall assay efficiency is affected by variations in tube-to-tube amplification efficiency. The E values are calculated from the slope of the standard curve for each assay, consequently any factors that impact on the amplification efficiency of the points used to construct the curve will also impact on the calculated E value. The quantification of low copy number samples results in larger associated confidence intervals due to the relative impact of stochastic factors involved in the PCR (12). When the two lowest copy number points are removed from each of these four assays, and the calculated E values from the individual replicates are averaged, there is no significant departure from the theoretical maximum of 1 (α = 0.05). The APS provides a more sensitive measure of efficiency as it is calculated individually for each sample undergoing PCR. The average APS values of the six replicates for the two lowest copy number standards are significantly lower than those for the other standard points in three of the four assays that show overall E values higher than 1 (α = 0.05). These variations within the standard assays do not affect the relative quantifications within assays, as the same standards are used across all samples.
If the c-myc 5′ exonuclease assays efficiently produce fluorescent signal that is directly proportional to the accumulation of PCR product, and the efficiency is equal to that of the assays performed on the standard curve sample (a PCR product with perfect sequence match to the primers and probes), then the estimates of DNA quantity should be approximately the same for each assay. If an assay has reduced efficiency, because of primer sequence mismatches that reduce the rate of production of PCR product or probe mismatches that reduce the correlation between fluorescent signal and PCR product yield, the calculated amount of starting template will be lower than the actual starting amount.
Fifteen mammalian DNA samples were quantified using the three c-myc assays (opossum failed for all three assays). For all of the species, the 239 bp assay performed poorly or there was no signal at all. For the two shorter assays, seven of the 15 species’ DNA had higher calculated starting template amounts with the 190 bp assay compared with the 81 bp assay, and eight had lower amounts. This indicates an overall slightly lower efficiency of the c-myc190 assay, but the efficiency is somewhat sequence dependent, and the overall correlation between the two mean starting template calculations is strong (linear regression R2 = 0.68 for 15 species; R2 = 0.80 if the cat sample, which had an ∼3-fold difference between replicate measures, was excluded).
Effects of sequence mismatches
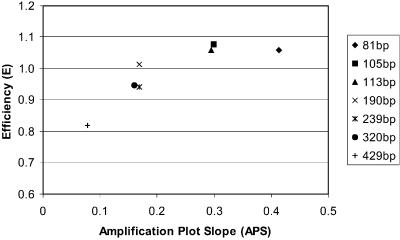
The amplification plots and primer and probe mismatches with the template sequences were examined to determine whether the differences in the calculated template amounts between assays were due to changes in the efficiency of the assays, and what factors might be involved. The slope of the exponential phase of the amplification plot (APS) was used to determine the efficiency of the assay. When an assay is 100% efficient, the PCR exactly doubles the number of product copies in each cycle, and the increase in fluorescence will be directly proportional to the amount of product. This will result in a standard curve slope of –3.333, which corresponds to a 3.333 cycle difference between dilutions in a 10-fold template DNA dilution series (6). The slope of the exponential phase of the amplification plot is also maximised at 100% efficiency. Figure 4 highlights the relationship between efficiency (E) as measured by the slope of the assay standard curve and efficiency as measured by the average of the slopes of the exponential phases (APS) of the individual standard amplification plots. It shows that there is a linear correlation until a threshold level corresponding to a fragment length of ∼190 bp where E values plateau and the APS becomes more informative. The APS values for the three assays used on the mammalian samples were 0.456, 0.166 and 0.172 (c-myc81, c-myc190 and c-myc239 respectively) for the standard DNA (average of three replicates for each assay, at highest concentration of starting template). For all remaining analyses, we use the APS values as surrogate measures for the actual assay efficiency calculations.
Figure 4.
Plot of assay efficiency (E), as measured by standard curve slope, against average slope of the exponential phase of the amplification plots (APS) for each standard.
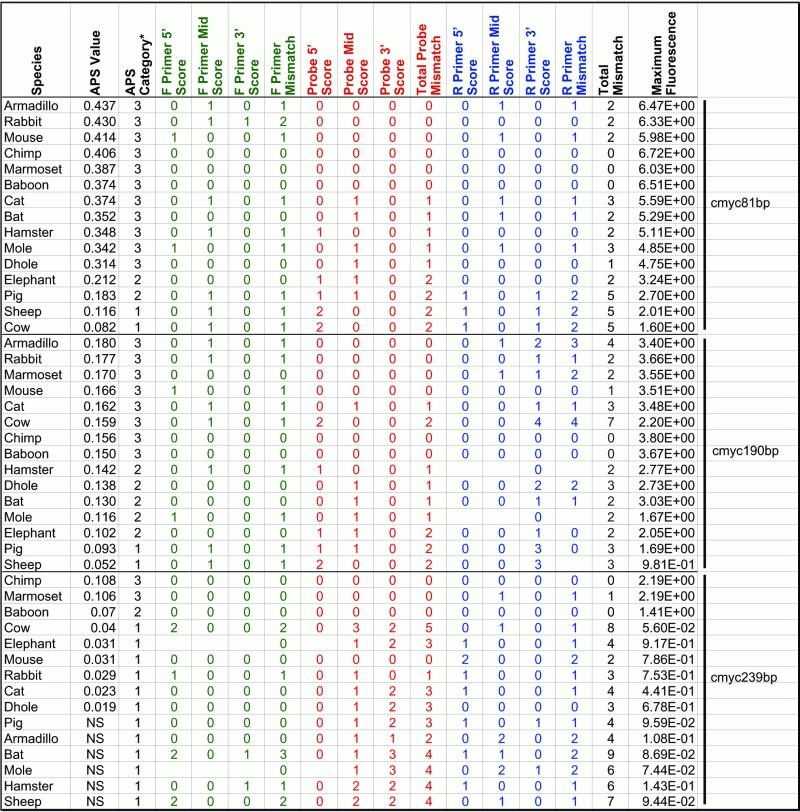
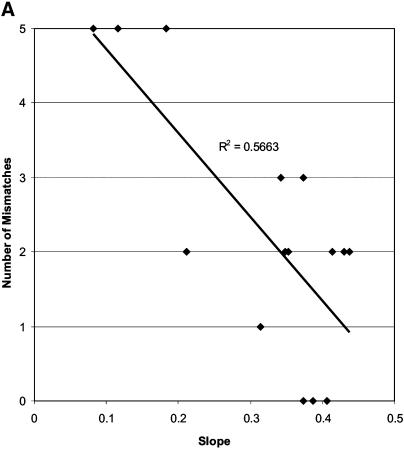
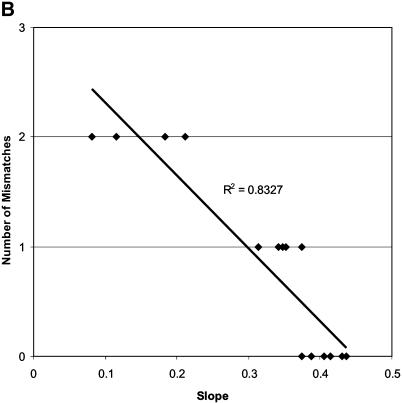
We compared the observed APS values for the assays with DNA templates of different species, and correlated changes in primer and probe binding site sequences that might cause significant changes in assay efficiency. The c-myc81 assay exhibited a non-continuous distribution of APS values for the 15 species. Samples were categorised as having APS values >0.25 (category 3), between 0.15 and 0.25 (category 2) and <0.15 (category 1) (Table 4). Observation of mismatches between probe and primer binding sites showed that, for this assay, there was a strong effect of total number of mismatches in all primer and probe sites (R2 = 0.5663) (Fig. 5A), but the number of mismatches in the probe binding site explained the majority of the change in APS (R2 = 0.83) (Fig. 5B), with all samples in category 3 having zero or one mismatch, and all those in categories 1 and 2 having two mismatches. However, three of the four samples with the lowest slopes also had reverse primer mismatches in the 3′ one-third of the reverse primer (all 5 bp from the 3′ terminus), so combined effects may be causing the low observed slopes. As noted by Klein et al. (6), simple mismatches of 1 nt in the probe or primer binding sites do not necessarily cause significant decreases in assay efficiency.
Table 4. Primer and probe mismatch scores and slope values for mammalian species.
Blank cells represent missing data. NS, no signal.
Figure 5.
Plot of the APS values against (A) total number of mismatches for the c-myc81 assay and (B) probe binding site mismatches for the c-myc81 assay. Trendline and correlation coefficient (R2) are shown for each plot.
The c-myc190 assay exhibited a consistently lower (all <0.2) and more continuous variation in the APS values, as well as a larger range of primer and probe binding site mismatches. The APS values between assays for each species were highly correlated [R2= 0.4772 for 14 species; R2 = 0.9162 when cow is removed (see below)]. Surprisingly, three species (chimpanzee, baboon and mouse) with perfect matches between the template and assay oligonucleotides exhibited intermediate APS values, falling below other species that possessed up to a total of seven mismatches, including two in the probe binding site and four in the 3′ one-third of the reverse primer (cow). All probe and primer binding sites were analysed for position of mismatches in 5′, central or 3′ thirds, and there was also no clear pattern of effect. This analysis was limited by the actual distribution of mismatches, which tended to fall in the central portion of the forward primer, the 5′ and central portions of the probe and the 3′ portion of the reverse primer binding site. The highest correlation coefficient between APS and number of mismatches was for the total number of mismatches in the probe binding site (R2 = 0.5681), followed by the number of mismatches at the 5′ end of the probe (R2 = 0.3439). No other correlation coefficients were greater than 0.2.
The c-myc239 assay exhibited slopes below 0.12 for all species, and half of the species samples produced no assay signal. Sequence analysis showed that only the primate and mouse sequences had no mismatches with the probe. All other species had between one and five probe mismatches, and up to nine total mismatches. Of those that produced a fluorescent signal, there was again no clear pattern of APS versus mismatch, though the highest correlation coefficients were for 5′ probe mismatch, total probe mismatch and total site mismatch (R2 = 0.3711, 0.3568 and 0.3640 respectively). The cow sample again was somewhat anomalous, as the APS was higher than that of the mouse sample (three mismatches), but there were five probe site mismatches, and three more primer binding site mismatches, for a total of eight mismatches in the assay oligonucleotide binding sites.
Allelic dropout
Chimpanzee DNA samples, extracted from faeces collected in the Taï National Park, Côte d’Ivoire, were selected from a previous study of AD and amplification success (8). Thirty-one samples, for which repeated genotyping had been completed, were re-analysed for DNA quantity using the c-myc81 assay after 1.5–2 years of storage at –20°C, and also assayed using the c-myc190 assay. Although the previous measures were determined against a genomic DNA standard, measured in picograms instead of copy number (so absolute quantities were not directly comparable), samples were of the same general concentration as measured previously, with a correlation coefficient between measurements of R2 = 0.7207 (n = 31).
Chimpanzee faecal samples yield very low quantities of highly degraded DNA (8,10,13,14,24–26). It is expected, both because of the lower efficiency of the assay and because of the larger PCR product, that the c-myc190 assay would detect smaller quantities of DNA, and that the variation in degradation between samples would introduce variation in detectable amounts of template DNA as well. Twenty-four of the 45 faecal extracts measured by both methods yielded no detectable product in the c-myc190 assay (data not shown). All of these contained small amounts (fewer than 200 copies; average = 40 copies) of template DNA, as detected by the c-myc81 assay, with one extract yielding no product from either assay. For all 44 samples with detectable DNA in the c-myc81 assay, the amount of DNA detected by the c-myc190 assay was highly positively correlated (R2 = 0.8011).
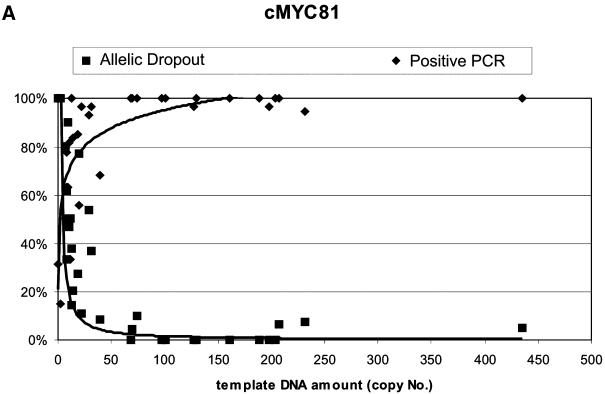
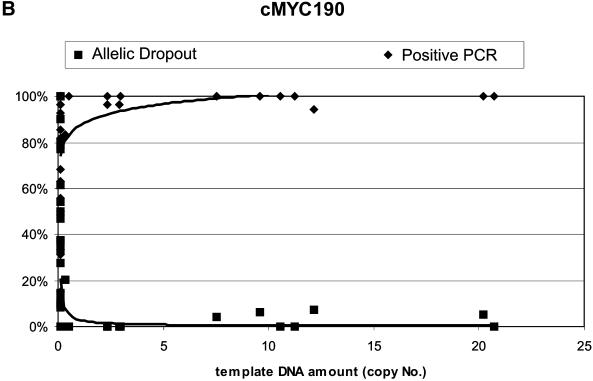
We tested multiple models to find the best-fit regression model for the relationship between amplifiable copy number in each assay and the percentage positive PCR or percentage AD determined from repeated genotyping of microsatellite loci on these samples (8). Correlation coefficients and statistical significance from SPSS statistical analysis software indicated that the highest correlation coefficients for significant fits (P <0.006) for positive PCR were logarithmic curves for both the c-myc81 and c-myc190 assays. For AD, the logarithmic curve fit best for the c-myc81 assay, but the power curve fit best for the c-myc190 assay, though the power curve was a highly significant fit for both assays (P <0.0001).
Figure 6 shows the plots of copy number versus percentage positive PCR and percentage AD for both assays, with the power curve fitted to the AD data of both assays for comparative purposes. The correlation of both AD and percentage positive PCR to copy number was better for the c-myc81 assay (R2 = 0.696 and 0.591 respectively, for c-myc81; R2 = 0.393 and 0.229 respectively, for c-myc190), and it is clear that the c-myc190 assay rarely detects template DNA below the level where AD rises above 5% or positive PCR falls below 95%, so the assay is not useful for defining categories of replication to ensure 99% confidence levels for genotypes (8,14). The 190 bp assay did not, contrary to expectations, predict AD or positive PCR better for samples that had relatively high levels of degradation, as indicated by relatively low amounts of the larger assay product. There is not sufficient power to detect the significance of the correlations, but AD was detected for three samples out of the 10 with the highest amount of DNA as measured by the c-myc81 assay, but for four samples out of the highest 10 measurements for the c-myc190 assay.
Figure 6.
Plots of percentage positive PCR and percentage AD against DNA quantity (copy number) as measured by the (A) c-myc81 assay and (B) the c-myc190 assay.
DISCUSSION
Previous studies have demonstrated that the 5′ nuclease assay is an accurate and reliable method for the estimation of amplifiable DNA concentration (3,6,8), and the findings of this study support that conclusion. However, we have shown that assay efficiency decreases as fragment size increases, and the effect of various primer and probe mismatches is complicated, but clear factors include (i) single point mutations in probe or primer binding sites alone do not necessarily have a significant impact on assay efficiency; (ii) combined effects of probe and primer mismatches possibly giving rise to more pronounced reductions in assay efficiency; (iii) a strong effect of reduced assay efficiency with increasing number of total primer and probe mismatches; and (iv) mismatches at the probe binding site having the greatest effect on assay efficiency.
This represents a significant expansion on the data presented by Klein et al. (6) and provides further insight into the dynamics of the 5′ nuclease assay. However, correlations between efficiency and number or placement of mismatches remain unclear. In some cases, perfectly matched samples exhibit lower efficiency than mismatched samples, indicating that other factors, such as secondary structure, may affect assay efficiency on a particular sequence or species. Further experimentation is required to clarify this issue. It may be that partial complementarity to other regions of the genomic DNA template results in probe competition in some species. This possibility is supported by the occurrence of pseudogenes within the myc gene family; however, there is no evidence of this for the c-myc gene specifically (27). GenBank Blast search results for the c-myc81 and c-myc190 probe do not show matches outside the c-myc gene (data not shown) but genomic coverage of most of the mammals used in this study is limited in the public databases.
Within an assay it is possible to detect reductions in efficiency for different samples by measuring the slope of a dilution series plot (6), or more simply by comparing the APS. This latter method is more sensitive to small changes in efficiency, and is easily performed without the need to assay dilution series from each sample. Reductions in efficiency indicate the likely presence of mismatches between template DNA and primer or probe oligos without the need for sequencing the fragment. Detecting such mismatches is important for qPCR assays because their presence means that the calculated amount of amplifiable DNA will be an underestimation of the actual amount if measured against a perfectly matched standard. In some cases it is possible to use APS differences between sample reactions to detect the presence of contaminating DNA within extracts (P.Wandeler and S.Smith, manuscript in preparation). Contaminant DNA competes with the target template during the PCR and, if there are sequence differences at the probe or primer binding sites, produces different APS characteristics when compared with reactions containing only pure template. The magnitude of this difference relates to the proportion of contaminant DNA in the reaction, the extent of oligo binding site mismatches and the amplicon length employed for the assay.
The assays used in this study can be applied to other projects where accurate quantification of amplifiable DNA is required. The deep phylogenetic signal for this gene, which is evident from the sequence alignment and Figure 2, suggests that within species, polymorphism is likely to be very low. This should facilitate the use of assays designed from this gene for relative quantification of samples. The sequence data presented here can be used to design species-specific assays for improved efficiency and also for the exclusion of contaminating DNA such as human or prey species that might otherwise confound the results. Caution must be taken with this approach, however, to ensure that DNA from other species is indeed excluded by the assay. This can be accomplished by designing probes with greater than two mismatches to the contaminant template and also by increasing the stringency of the assay conditions such that perfectly matched template is exclusively amplified. In addition to the species tested here, the sequencing primers lie in conserved regions of exon 3 of the c-myc proto-oncogene and are suitable to use for assay design across a broad range of mammalian species.
AD is a significant problem for genotyping studies employing small amounts of DNA, and qPCR has been suggested as a means for improving genotyping efficiency and accuracy (8). Data from this study support this conclusion, but the application of an assay that measured quantity of DNA template for a fragment more similar in size to those used in typical microsatellite genotyping studies (the c-myc190 assay) did not improve the predictive ability of qPCR to determine numbers of repetitions required to obtain 99% confidence of genotypes. However, as a simple test of samples that should perform with >95% amplification success and <5% AD, the c-myc190 PCR product can be used, with simple agarose gel electrophoresis, to provide a sample quality cut-off when qPCR instruments are not available (data not shown). This can be achieved after preliminary testing to associate AD rates and target locus PCR success in the species and sample types of interest.
SUPPLEMENTARY MATERIAL
Supplementary Material is available at NAR Methods Online.
Supplementary Material is available at NAR Methods Online.
Acknowledgments
ACKNOWLEDGEMENTS
We are grateful to the people and organisations in Table 1 who provided DNA for this study. We thank Susan Ptak for help with statistical analysis, Hendrik Poinar for helpful discussion, Karen Chambers for helpful discussion and comments on the manuscript, and two anonymous reviewers for helpful comments. This work was supported by the Max Planck Institute for Evolutionary Anthropology.
DDBJ/EMBL/GenBank accession nos+ To whom correspondence should be addressed. Tel: +49 341 995 2538; Fax: +49 341 995 2555; Email: AF519445–AF519458
REFERENCES
- 1.Holland P.M., Abramson,R.D., Watson,R. and Gelfand,D.H. (1991) Detection of specific polymerase chain reaction product by utilizing the 5′ to 3′ exonuclease activity of Thermus aquaticus DNA polymerase. Proc. Natl Acad. Sci. USA, 88, 7276–7280. [DOI] [PMC free article] [PubMed] [Google Scholar]
- 2.Livak K., Flood,S.J.A., Marmaro,J., Giusti,W. and Deetz,K. (1995) Oligonucleotides with fluorescent dyes at opposite ends provide a quenched probe system useful for detecting PCR product and nucleic acid hybridization. PCR Methods Appl., 4, 357–362. [DOI] [PubMed] [Google Scholar]
- 3.Heid C.A., Stevens,J., Livak,K.J. and Williams,P.M. (1996) Real time quantitative PCR. Genomic Res., 6, 986–994. [DOI] [PubMed] [Google Scholar]
- 4.Smith G.J. III, Helf,M., Nesbet,C., Betita,H.A., Meek,J. and Ferre,F. (1999) Fast and accurate method for quantitating Escherichia coli host-cell DNA contamination in plasmid DNA preparations. Biotechniques, 26, 518–525. [DOI] [PubMed] [Google Scholar]
- 5.de Kok J.B., Hendriks,J.C., van Solinge,W.W., Willems,H.L., Mensink,E.J. and Swinkels,D.W. (1998) Use of real-time quantitative PCR to compare DNA isolation methods. Clin. Chem., 44, 2201–2204. [PubMed] [Google Scholar]
- 6.Klein D., Janda,P., Steinborn,R., Muller,M., Salmons,B. and Gunzburg,W.H. (1999) Proviral load determination of different feline immunodeficiency virus isolates using real-time polymerase chain reaction: influence of mismatches on quantification. Electrophoresis, 20, 291–299. [DOI] [PubMed] [Google Scholar]
- 7.Lie Y.S. and Petropoulos,C.J. (1998) Advances in quantitative PCR technology: 5′ nuclease assays. Curr. Opin. Biotechnol., 9, 43–48. [DOI] [PubMed] [Google Scholar]
- 8.Morin P.A., Chambers,K.E., Boesch,C. and Vigilant,L. (2001) Quantitative polymerase chain reaction analysis of DNA from noninvasive samples for accurate microsatellite genotyping of wild chimpanzees (Pan troglodytes verus). Mol. Ecol., 10, 1835–1844. [DOI] [PubMed] [Google Scholar]
- 9.Sundfors C. and Collan,Y. (1996) Basics of quantitative polymerase chain reaction. 2. Electrophoresis and quantitation of polymerase chain reaction products. Electrophoresis, 17, 44–48. [DOI] [PubMed] [Google Scholar]
- 10.Bradley B.J., Chambers,K.E. and Vigilant,L. (2001) Accurate DNA-based sex identification of apes using non-invasive samples. Conservation Genetics, 2, 179–181. [Google Scholar]
- 11.Morin P.A., Saiz,R.S. and Monjazeb,A. (1999) High-throughput single nucleotide polymorphism genotyping by fluorescent 5′ exonuclease assay. Biotechniques, 27, 538–552. [DOI] [PubMed] [Google Scholar]
- 12.Raeymaekers L. (1999) General principles of quantitative PCR. In Kochanowski,B. and Reischl,U. (eds), Methods in Molecular Medicine. Humana Press Inc., Totowa, NJ, Vol. 26, pp. 31–41. [DOI] [PubMed]
- 13.Navidi W., Arnheim,N. and Waterman,M.S. (1992) A multiple-tubes approach for accurate genotyping of very small DNA samples by using PCR: statistical considerations. Am. J. Hum. Genet., 50, 347–359. [PMC free article] [PubMed] [Google Scholar]
- 14.Taberlet P., Griffin,S., Goossens,B., Questiau,S., Manceau,V., Escaravage,N., Waits,L.P. and Bouvet,J. (1996) Reliable genotyping of samples with very low DNA quantities using PCR. Nucleic Acids Res., 24, 3189–3194. [DOI] [PMC free article] [PubMed] [Google Scholar]
- 15.Livak K., Marmaro,J. and Flood,S. (1995) Guidelines for designing TaqMan™ fluorogenic probes for 5′ nuclease assay. PE Applied Biosystems, Foster City, CA, USA.
- 16.Kohler T., Rost,A.K. and Remke,H. (1997) Calibration and storage of DNA competitors used for contamination-protected competitive PCR. Biotechniques, 23, 722–726. [DOI] [PubMed] [Google Scholar]
- 17.Miyamoto M.M., Porter,C.A. and Goodman,M. (2000) C-myc gene sequences and the phylogeny of bats and other eutherian mammals. Syst. Biol., 49, 501–514. [DOI] [PubMed] [Google Scholar]
- 18.Hall T. (2001) BioEdit. 5.0.6 ed. Distributed by the author. Department of Microbiology, North Carolina State University, Raleigh, NC.
- 19.Felsenstein J. (1993) PHYLIP (Phylogeny Inference Package) version 3.6., Distributed by the author. Department of Genetics, University of Washington, Seattle, WA.
- 20.Kishino H. and Hasegawa,M. (1989) Evaluation of the maximum likelihood estimate of the evolutionary tree topologies from DNA sequence data, and the branching order in hominoidea. J. Mol. Evol., 29, 170–179. [DOI] [PubMed] [Google Scholar]
- 21.Felsenstein J. and Churchill,G.A. (1996) A hidden Markov model approach to variation among sites in rate of evolution. Mol. Biol. Evol., 13, 93–104. [DOI] [PubMed] [Google Scholar]
- 22.Margush T. and McMorris,F.R. (1981) Consensus N-trees. Bull. Math. Biol., 43, 239–244. [Google Scholar]
- 23.Murphy W.J., Eizirik,E., Johnson,W.E., Zhang,Y.P., Ryder,O.A. and O’Brien,S.J. (2001) Molecular phylogenetics and the origins of placental mammals. Nature, 409, 614–618. [DOI] [PubMed] [Google Scholar]
- 24.Frantzen M.A., Silk,J.B., Ferguson,J.W., Wayne,R.K. and Kohn,M.H. (1998) Empirical evaluation of preservation methods for faecal DNA. Mol. Ecol., 7, 1423–1428. [DOI] [PubMed] [Google Scholar]
- 25.Gagneux P., Boesch,C. and Woodruff,D.S. (1997) Microsatellite scoring errors associated with noninvasive genotyping based on nuclear DNA amplified from shed hair. Mol. Ecol., 6, 861–868. [DOI] [PubMed] [Google Scholar]
- 26.Kohn M., Knauer,F., Stoffella,A., Schröder,W. and Pääbo,S. (1995) Conservation genetics of the European brown bear – a study using excremental PCR of nuclear and mitochondrial sequences. Mol. Ecol., 4, 95–103. [DOI] [PubMed] [Google Scholar]
- 27.DePinho R.A., Hatton,K.S., Tesfaye,A., Yancopoulos,G.D. and Alt,F.W. (1987) The human myc gene family: structure and activity of L-myc and an L-myc pseudogene. Genes Dev., 1, 1311–1326. [DOI] [PubMed] [Google Scholar]


